
The completed run reported a successful check result.
Laravel health checks
Monitor your Laravel app’s health.
Check the services it relies on.
Laritor is a performance monitoring and issue tracking tool for Laravel. Check whether your database, cache, queues, storage, and other services are working. Add custom checks for your APIs or application logic, inspect failed runs, and get notified where your team works.
Free trial: 300K events · Unlimited apps and environments
01
Check your dependenciesBuilt-in and custom checks.
02
Understand failed runsOutput, timing, and recorded context.
03
Notify your teamChoose rules and destinations.
Built-in Laravel health checks
Start with the services
your app uses every day.
A request can fail because a dependency is unavailable, even when your code has not changed. Laritor’s built-in checks help you review the common services your Laravel application relies on.
Start with these checks, then add your own for the dependencies and conditions specific to your app.
Explore built-in health checksDatabase connectivity
Check whether your app can connect to its database. Investigate connection failures alongside requests and query activity.
ExploreCache availability
Check whether your configured cache is available. Inspect failures and follow up with the related cache operations.
ExploreQueue worker health
Monitor the default connection and queue. Add dedicated checks for other queues your application depends on.
ExploreTask scheduler health
Check scheduler health and investigate scheduled work that is delayed or failing.
ExploreFile storage
Check the configured storage used by your application. Investigate failures before relying on it for uploads or generated files.
ExploreSession storage
Check the session storage your app relies on. Use request and session activity to investigate affected user workflows.
ExploreRecorded runs and their results
See what failed.
Read what the check reported.
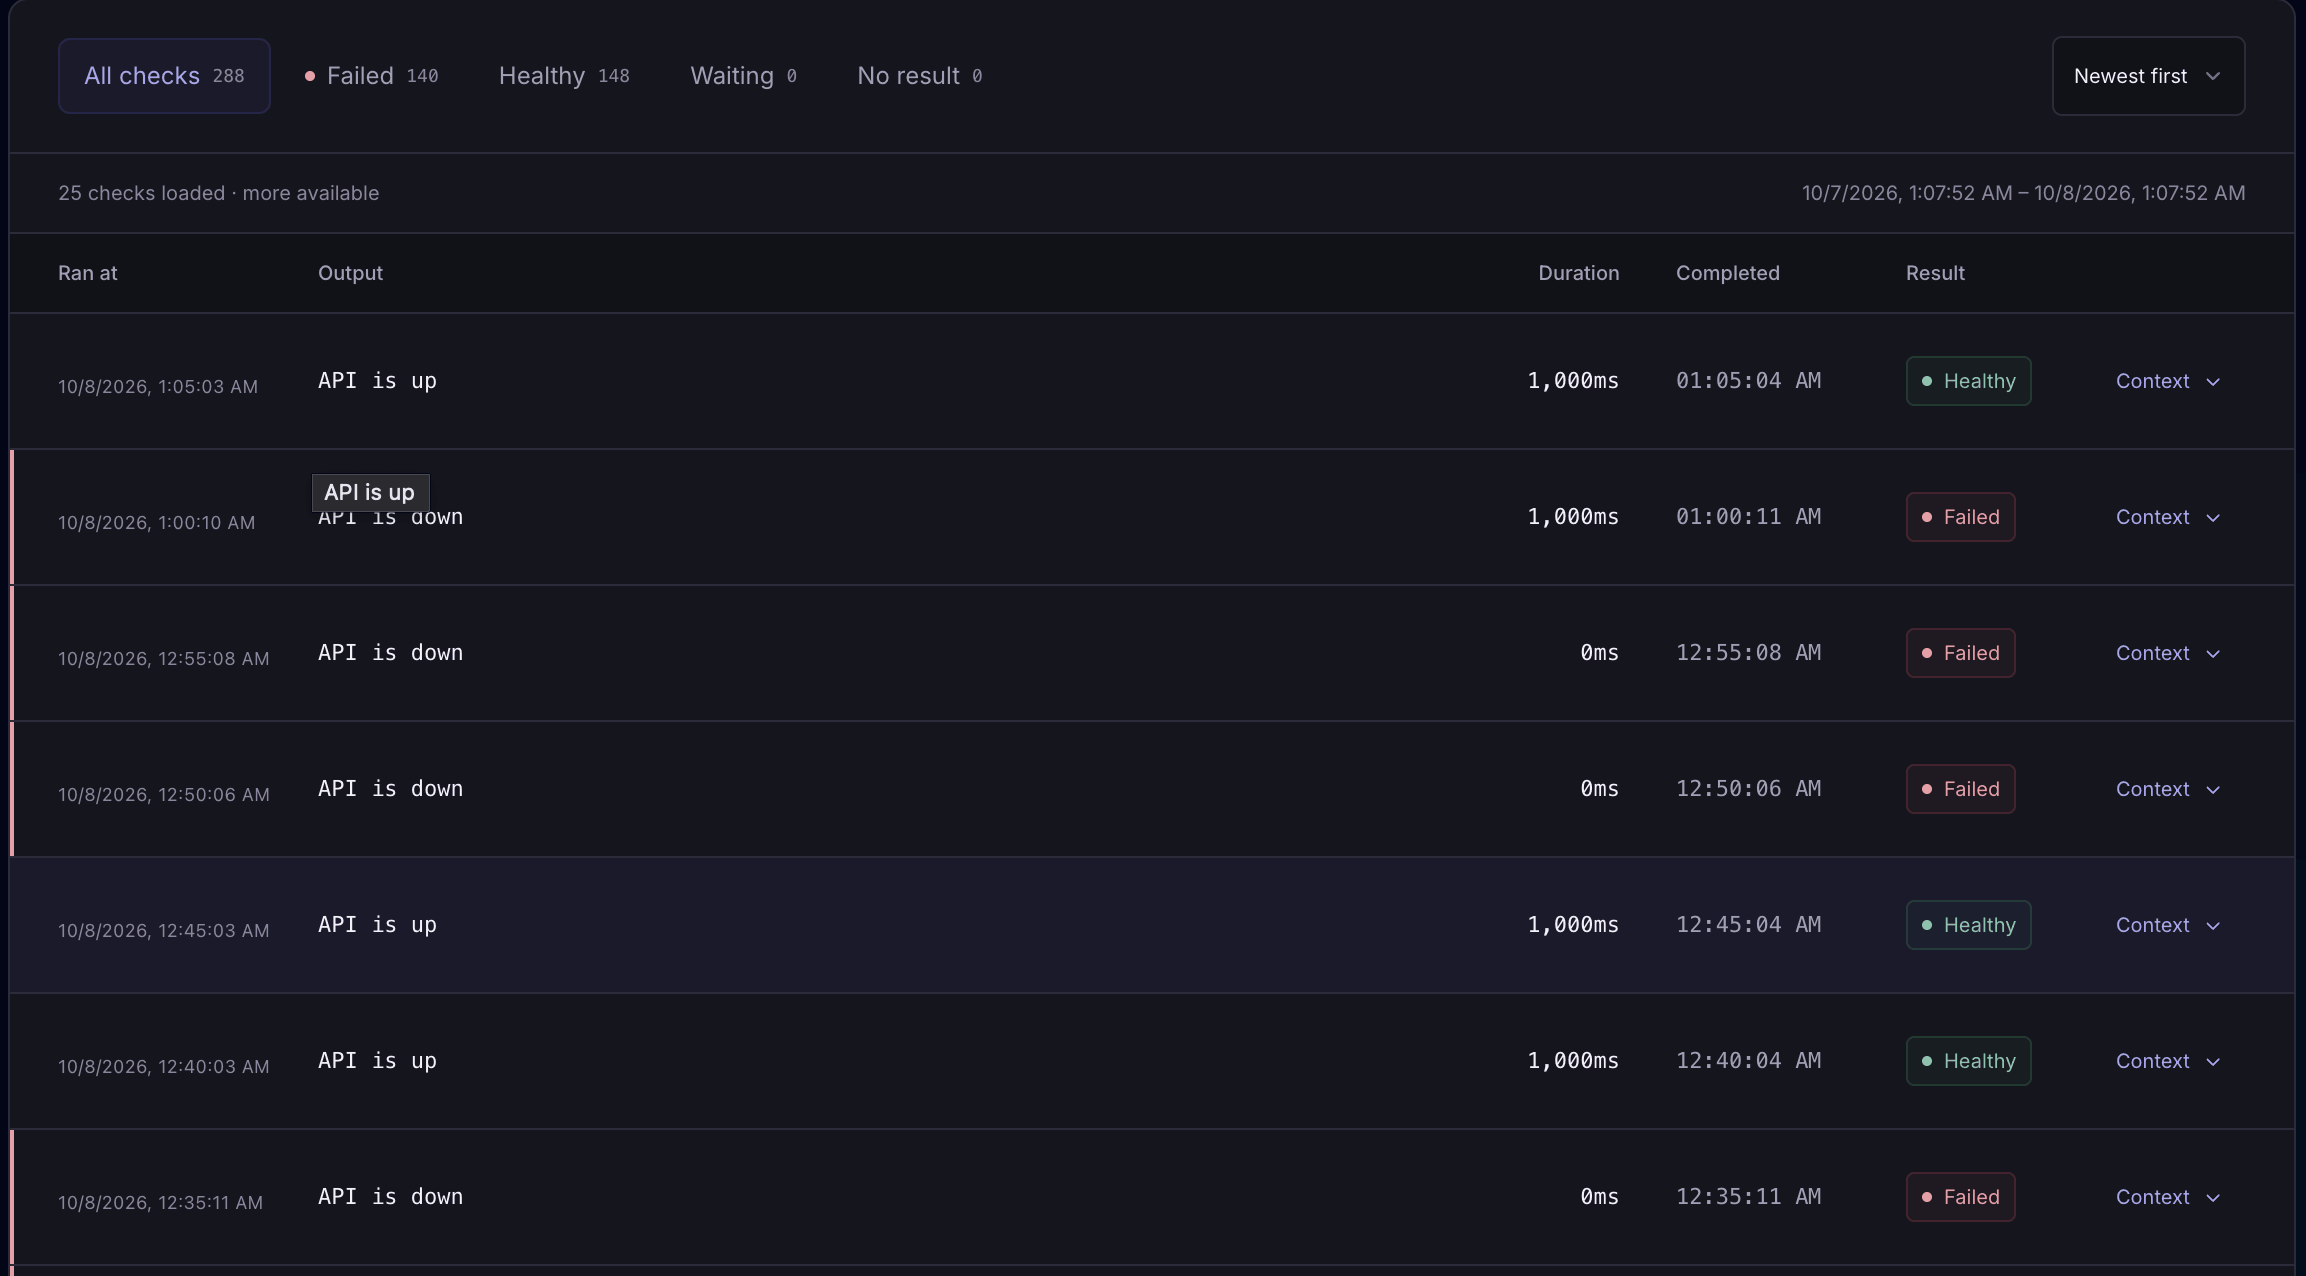
Select a period to review recorded runs for a check. Compare the result counts, then filter history to Healthy, Failed, Waiting, or No result.
Read each run’s output, duration, and completion time. A healthy latest status can follow earlier failures, so use history to understand the period you are investigating.

The completed run reported a failed check result. Inspect its output and context.
No completion has been recorded for that run yet.
The run has a completion recorded, but no healthy or failed result.
Output and result
Read the message recorded by the check, then compare healthy and failed runs to see how the dependency behaved.
Duration and completion
Check how long a run took and when it completed. Use the timestamps to focus an investigation on the relevant period.
Context from that run
Expand available recorded context to inspect useful application details captured with that occurrence.
The summary counts recorded runs in the selected period. It does not measure exact application uptime or guarantee every feature was available between checks.
Context from the check occurrence
Inspect the details
behind that result.
Expand a run’s recorded context to inspect the application details available with that check. For example, a mode, enabled modules, or a limit flag can help explain which conditions the check ran under.
Copy the available context to use in your investigation or share with a teammate. These are the values captured with that run, rather than a live view of your application.
Explore check details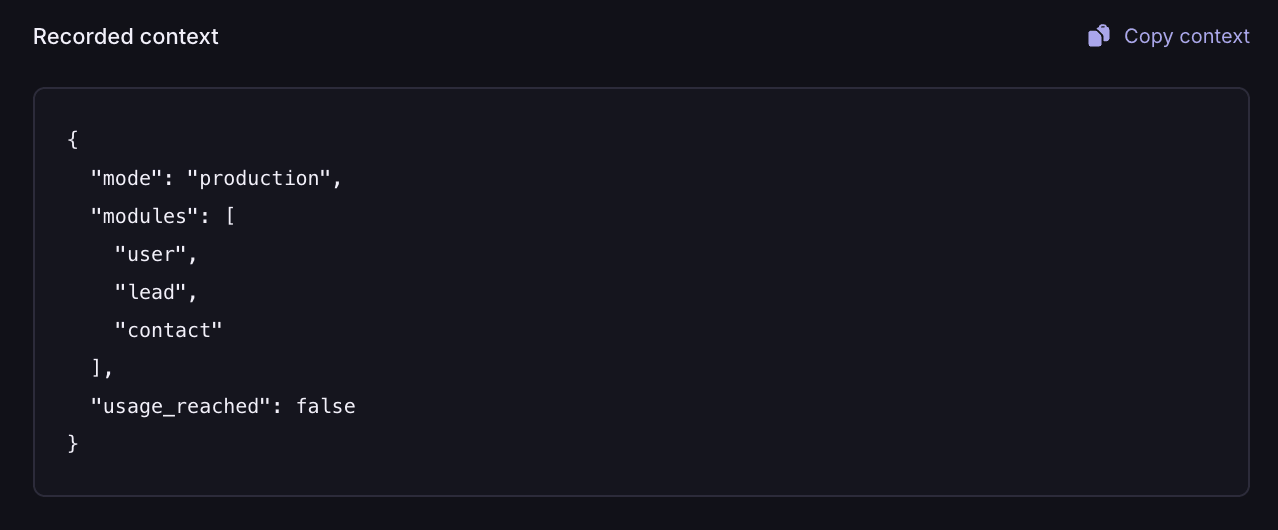
Custom API and queue checks
Check the dependencies
specific to your application.
Define a check for a third-party API or a condition your app needs to satisfy. Choose what counts as success and give failed results a useful message.
You can also monitor additional queue connections and queues. Generate a check, update its logic or settings, and sync after deployment.
Read the custom check guideCheck a service your app depends on.
Generate a custom check, then return true when the service meets your condition and false when it does not. This example checks a configured health endpoint and reports a simple result.
Generate the check
php artisan make:laritor-custom-hc PaymentProviderHealthCheckSet services.payment.health_url to a suitable health endpoint in your configuration. This example accepts a successful HTTP response; adapt the condition if the endpoint returns a more specific health result.
Keep the generated namespace and PHP opening tag when editing the class. The example shows the class contents.
namespace App\Laritor\HealthChecks;

use BinaryBuilds\LaritorClient\Checks\BaseHealthCheck;
use Illuminate\Http\Request;
use Illuminate\Support\Facades\Http;

class PaymentProviderHealthCheck extends BaseHealthCheck
{
    public static $name = 'Payment provider API';

    public function check(Request $request)
    {
        $url = config('services.payment.health_url');

        if (! $url) {
            return false;
        }

        try {
            return Http::timeout(3)->get($url)->successful();
        } catch (\Throwable $exception) {
            return false;
        }
    }

    public function successMessage()
    {
        return 'Payment provider health endpoint responded successfully';
    }

    public function failureMessage()
    {
        return 'Payment provider health endpoint check failed';
    }
}
Check the queues beyond your default.
The built-in queue worker check uses your default connection and queue. Generate another check when you need to monitor a separate connection or a high-priority queue.
Generate the check
php artisan make:laritor-queue-hc HighPriorityQueueHealthCheckReplace redis and high-priority with your connection and queue names. A queue health check tests the worker path; inspect job activity as well to investigate individual slow or failed jobs.
Keep the generated namespace and PHP opening tag when editing the class. The example shows the class contents.
namespace App\Laritor\HealthChecks;

use BinaryBuilds\LaritorClient\Checks\QueueWorkerHealthCheck;

class HighPriorityQueueHealthCheck extends QueueWorkerHealthCheck
{
    public static $name = 'High priority queue';

    public $connection = 'redis';

    public $queue = 'high-priority';
}
Sync after deployment and choose the schedule.
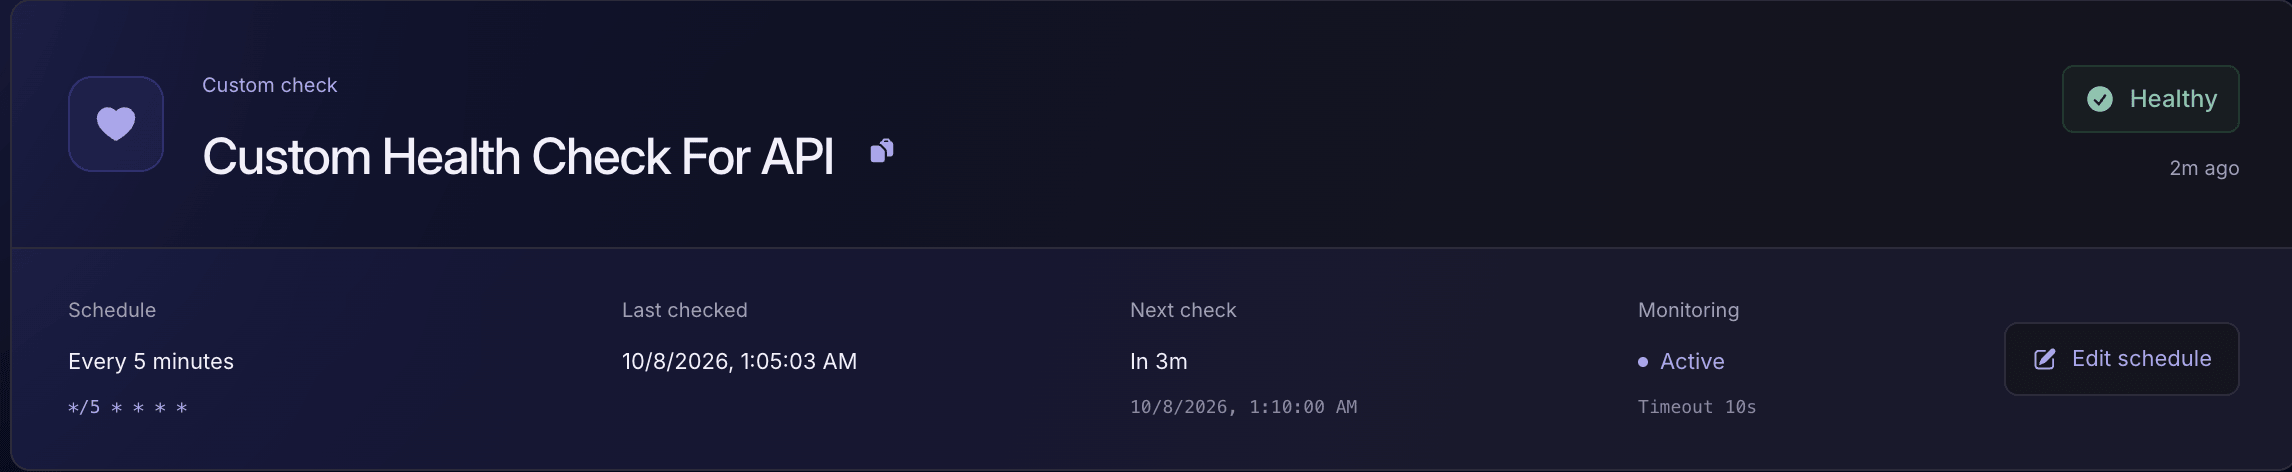
Run php artisan laritor:sync to synchronize custom checks. They default to every five minutes; change the schedule in Laritor and review the next check time, active status, and timeout.
Keep checks quick and focused on the condition you want to test. A successful health endpoint response only confirms the condition that endpoint checks.
php artisan laritor:syncFailed-check alerts and team integrations
Get notified
where your team works.
Enable the relevant failed-check alert rule and choose its destinations. Send alerts to your team’s channels, notify email lists, use a webhook, or create a tracked issue in GitHub or Linear.
SlackSetup guide DiscordSetup guide EmailSetup guide Microsoft TeamsSetup guide TelegramSetup guide GitHubSetup guide LinearSetup guide WebhooksSetup guide
Use default routing for your application and override destinations per environment. Send production failures to the people handling incidents, and choose separate channels for staging.
Configure problem alertsFrom a failed check to the affected workflow
Understand the failure.
Inspect its effect on your app.
A failed check gives you a place to start. Inspect its output and context, then review requests, jobs, and other activity around that time.
Use recorded execution timelines to understand which workflows were affected. Compare timestamps and evidence before deciding whether the cause is the dependency, your configuration, or application code.
- 01
Open the failed check
Select the time window and filter to Failed runs. Read the output, duration, completion time, and recorded context.
- 02
Inspect the affected app activity
Review requests, jobs, queries, or API calls around the same time. Use their timelines to understand how the dependency failure affected your app.
- 03
Fix and check the next results
Address the service, credentials, configuration, or code identified by your investigation. Review subsequent check results and affected workflows.
Use Laritor how you want
Choose the application context
you want to keep.
Health check schedules and alert rules are configured separately from application recording. Choose how much request, job, and other execution activity to keep alongside your check results.
A check can report failure by returning false without throwing an exception. Filtered recording modes can limit the application activity available around that failed check.
Exceptions only
Keep application occurrences that contain an exception, with their related events. Inspect those failures alongside health check results.
Focus application recording on exceptions.
Issues only
Keep occurrences with detected issues, such as slow requests or failed jobs. Investigate the activity affected by a failing dependency.
Keep the application work that needs attention.
Full observability
Record successful activity too. Compare the workload before, during, and after a dependency problem with a broader execution history.
See more of the application activity around an incident.
Paid plans start at $20/month with 20M events included. Usage depends on the events you send. Estimate your usage
Keep check output and context useful
Concerned about
sensitive information in checks?
Check output and recorded context can contain private information. Choose useful result messages and context fields without including credentials, tokens, raw responses, or personal details your team does not need.
Laritor redacts recorded context before it leaves your app. Customize redaction rules and review outgoing data, including the messages returned by your custom checks.
Explore privacy controlsWrite clear result messages.
Use successMessage and failureMessage to describe the condition tested. Keep secrets and raw payloads out of those messages.
Redact recorded context.
Customize redactArrayValue and redactString for sensitive structured values and strings in recorded context.
Choose useful alert destinations.
Review the channels receiving production alerts and the details included. Use environment routing to send failures to the appropriate team.
Laravel health check questions
Understand your checks,
their results, and their schedules.
Answers about built-in checks, custom APIs, queues, history, alert routing, and recording modes.
What are Laravel health checks?
Health checks test whether a service or condition your Laravel app depends on is working as expected. Laritor is a Laravel performance monitoring and issue tracking tool with built-in and custom health checks, schedules, recorded run history, output, duration, context, and configurable alerts.
Which built-in health checks does Laritor include?
Laritor includes checks for database connectivity, cache availability, queue worker health, task scheduler health, file storage, and session storage. Use them to review common dependencies, then add custom checks for services or conditions specific to your application.
How do I create a custom health check?
Run php artisan make:laritor-custom-hc PaymentProviderHealthCheck in an application with the Laritor client installed. Implement the generated check method to return true for success and false for failure. Customize the successMessage and failureMessage methods, then run php artisan laritor:sync after deployment to synchronize the check with Laritor.
How often do custom health checks run?
Custom checks default to every five minutes after synchronization. You can change the schedule in the Laritor dashboard. The check summary shows its schedule, active monitoring status, last checked time, next check time, and timeout. A scheduled next check is an expected time, rather than proof that a successful run has happened.
What do Healthy, Failed, Waiting, and No result mean?
Healthy and Failed describe the recorded outcome of a completed run. Waiting means no completion has been recorded for that run. No result means a completion exists without a healthy or failed result. Inspect the run output and timestamps to understand what is available; Waiting and No result are not successful checks.
Can I inspect previous failures after a check becomes healthy?
Yes. The latest status and the recorded run history answer different questions. Choose a time window and filter history to Failed to inspect earlier runs, their output, duration, completion times, and available context. A healthy latest result does not remove previous recorded failures.
Can I monitor a specific queue connection or queue?
Yes. The built-in queue worker check monitors the default connection and queue. Generate an additional check with php artisan make:laritor-queue-hc HighPriorityQueueHealthCheck, set its connection and queue properties, and synchronize after deployment. Use job monitoring to investigate individual slow or failed jobs as well.
Can Laritor alert my team when a health check fails?
Yes. Configure the relevant failed-check alert rule and destination channels in Laritor. Supported destinations include email lists, Slack, Microsoft Teams, Discord, Telegram, webhooks, GitHub, and Linear. You can set default routing and environment overrides. Delivery depends on the rules and integrations you configure.
Does a failed health check always produce an exception?
No. A custom check can return false without throwing an exception. Health check schedules and alert rules are configured separately from application recording modes. Exceptions-only recording should not be treated as a guarantee that every failed check has a captured application exception or full request timeline.
Do health check counts measure application uptime?
The summary counts recorded check runs in the selected period and separates their result states. These counts are not an exact measurement of how long every user-facing feature was available. Scheduled probes, gaps, the condition tested, and the check frequency affect what the results can tell you.
Install in under 1 minute
Check your app’s dependencies.
Understand when they fail.
Add Laritor’s Laravel client, review the built-in checks, and define custom checks for the services your application relies on.
Free trial: 300K events · Unlimited apps and environments