Requests
Every Laravel request, fully illuminated.
Laritor tracks every incoming request, visualizes latency, status outcomes, and bottlenecks, and gives you the context to debug quickly. You get percentile-level insights, request timelines, and AI-driven optimization signals without installing or managing agents.
Request events captured
All traffic, zero agents
Latency insight
Avg, P50, P90, P95, P99
Status breakdowns
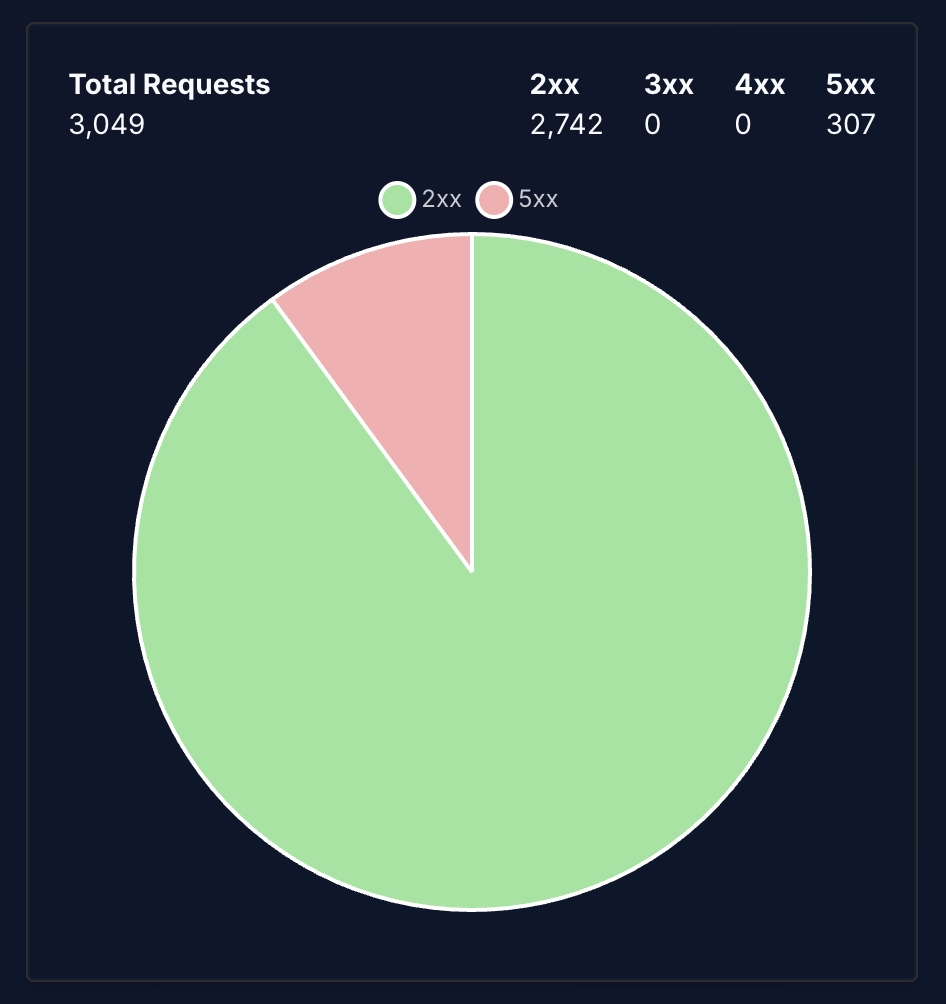
2xx · 3xx · 4xx · 5xx
Context depth
User, headers, payloads
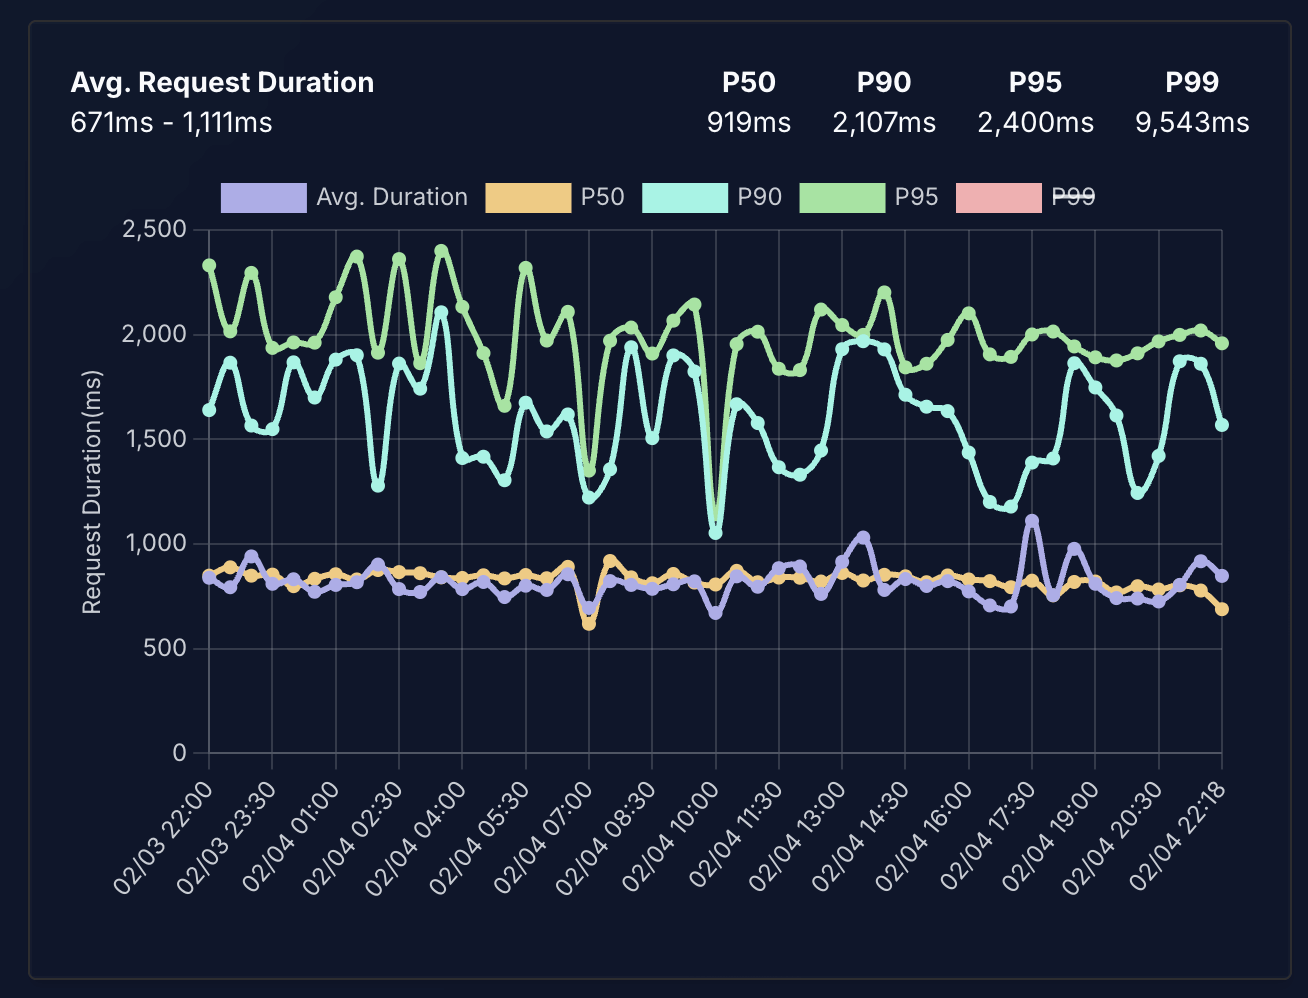
Percentiles that teams actually use
Avg + P50, P90, P95, P99 trendlines to quantify tail latency.
Traffic you can trust
Automatic bot detection keeps dashboards honest.
Request intelligence
Latency, outcomes, and outliers in one view.
Laritor visualizes request performance so you always know what typical traffic looks like, what the edge cases are, and whether a release or dependency introduced a spike.
Find the outliers dragging down your UX
Protect your highest-performing routes
Separate synthetic and automated traffic
Slice, dice, and isolate the exact traffic you care about.
Everything you need to reproduce, debug, and fix.
Automatic insights for faster optimization.
Status code distribution
HTTP health by status
See which percentage of requests resolve as 2xx, 3xx, 4xx, or 5xx. Quickly validate releases, middleware changes, and API contract drift.
Extremes & anomalies
Slowest, fastest, and bot traffic
Highlight the slowest requests that need investigation, the fastest requests worth protecting, and bot traffic that should be filtered or throttled.
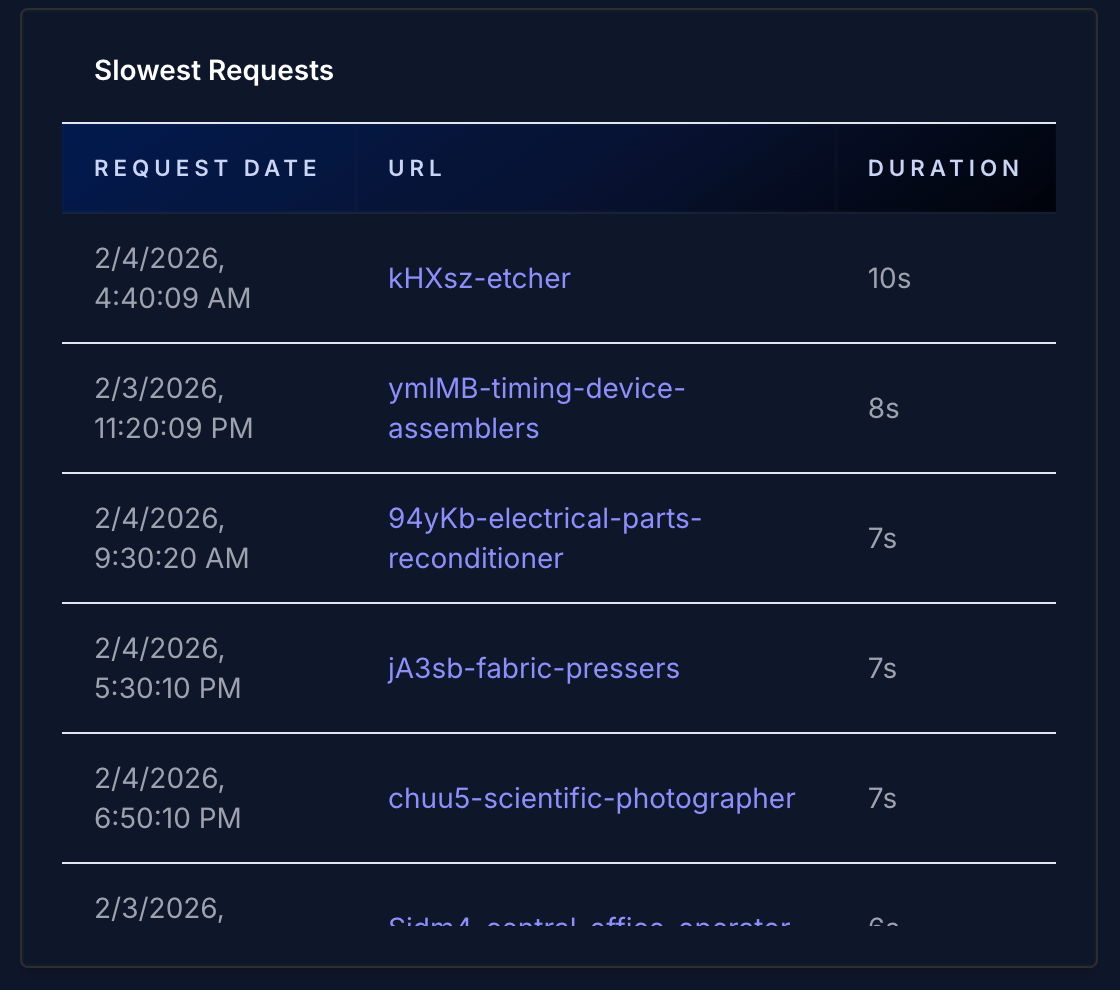
Slowest requests
Find the outliers dragging down your UX
Rank requests by duration and see the exact routes, payload sizes, and user context driving spikes. Drill into the worst offenders without noise.
Trace each request into the details panel for root-cause analysis: queries, cache, outbound calls, notifications, jobs, and logs are all correlated to the same trace.
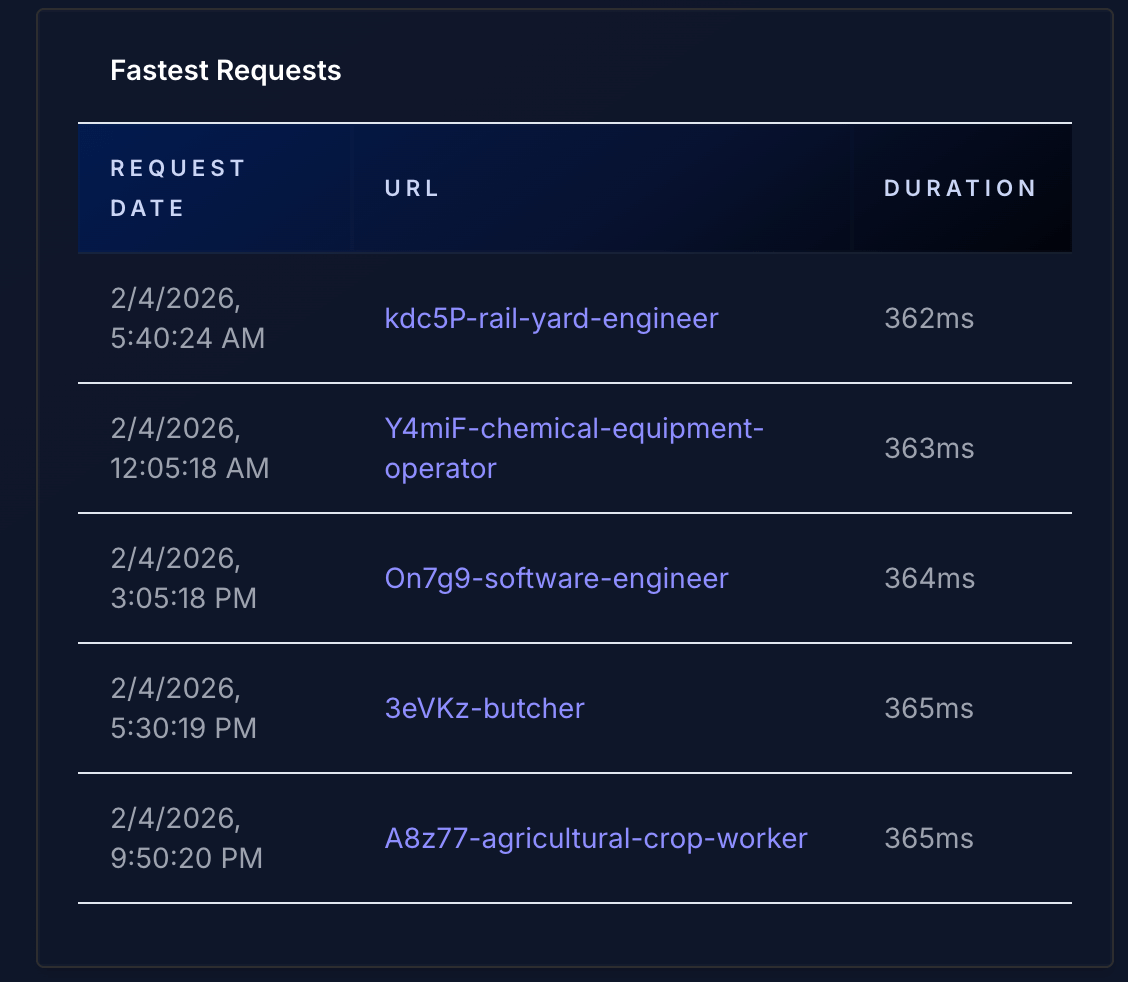
Fastest requests
Protect your highest-performing routes
Identify the fastest endpoints, keep them healthy, and baseline latency budgets for the rest of your app.
Trace each request into the details panel for root-cause analysis: queries, cache, outbound calls, notifications, jobs, and logs are all correlated to the same trace.
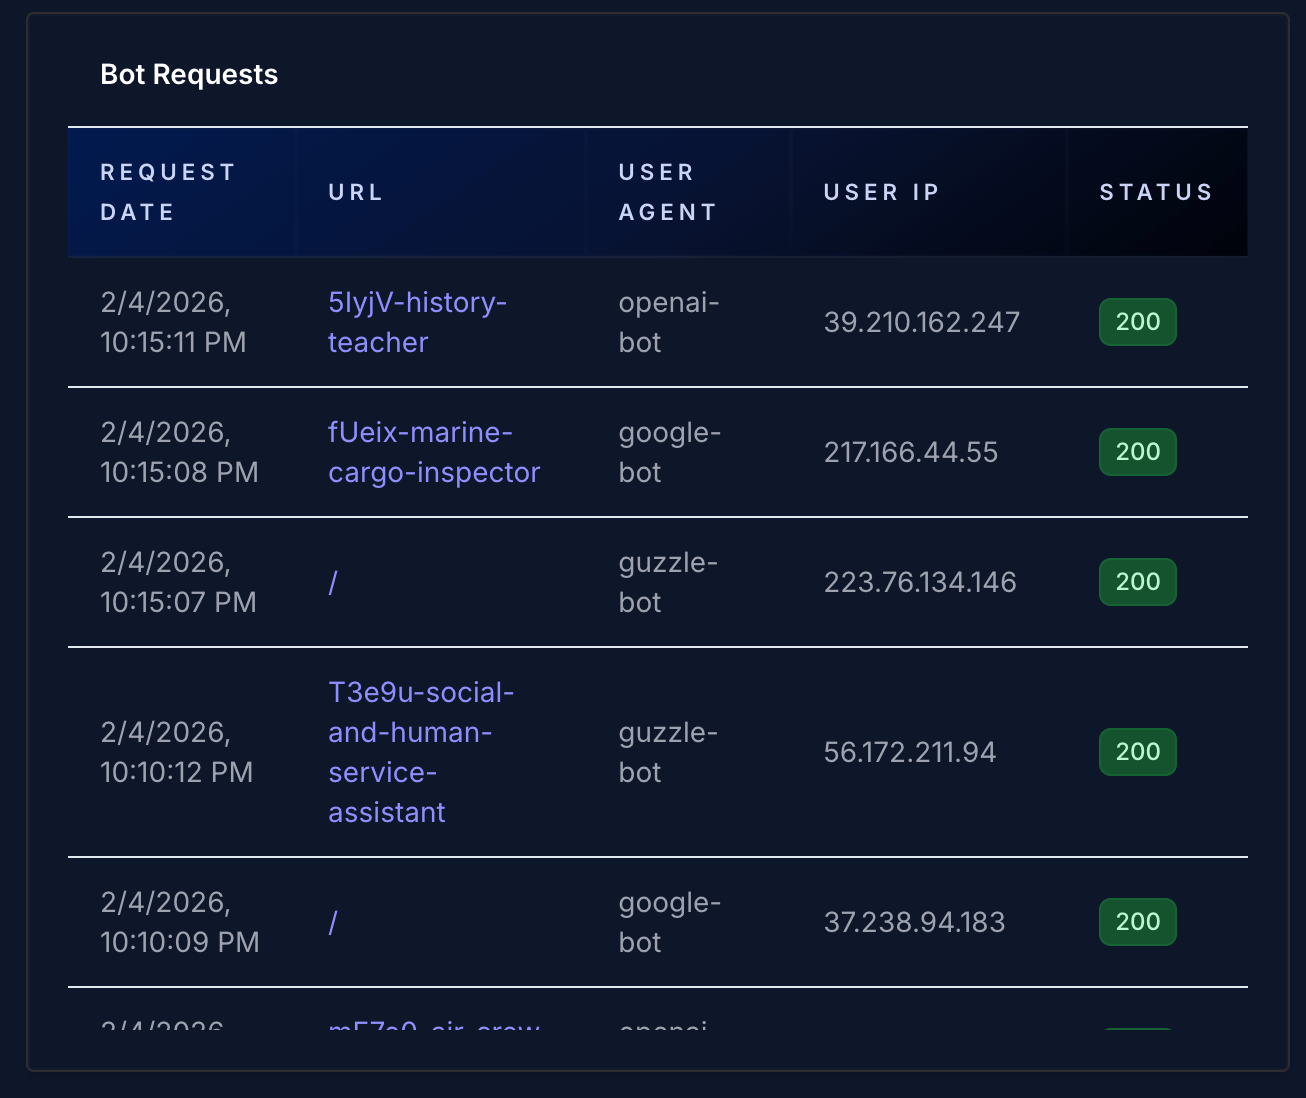
Bot requests
Separate synthetic and automated traffic
Recognize crawlers, scanners, and integration pings so they do not distort your performance or error charts.
Trace each request into the details panel for root-cause analysis: queries, cache, outbound calls, notifications, jobs, and logs are all correlated to the same trace.
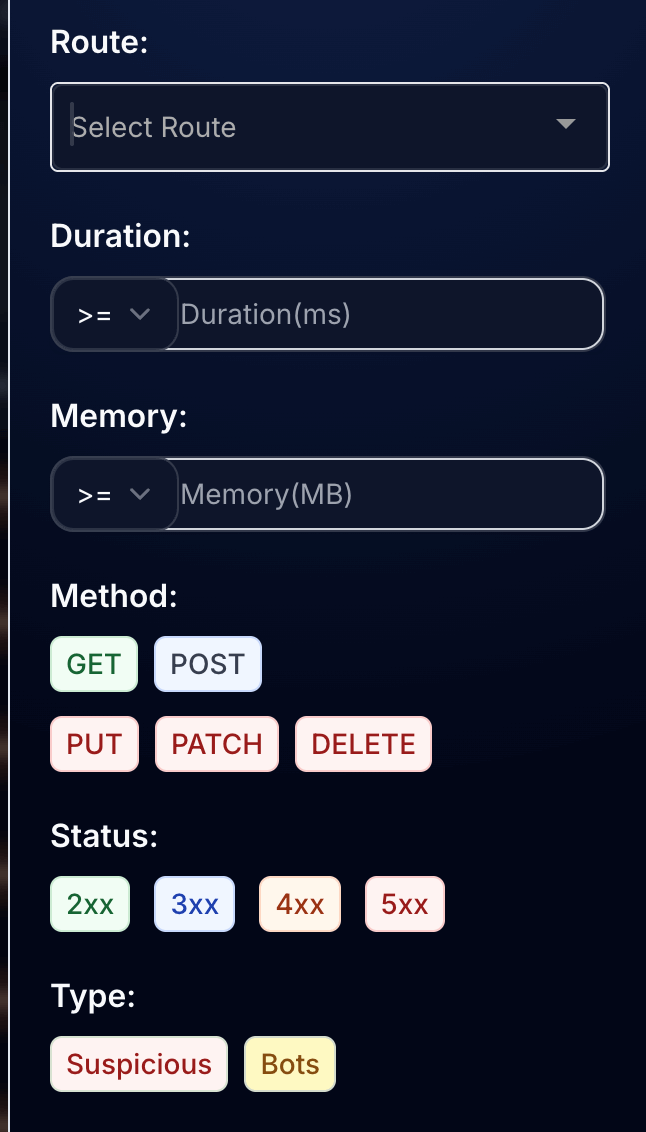
Advanced filters
Slice, dice, and isolate the exact traffic you care about.
Filter by route, method, duration, memory usage, status code, user, bot traffic, or any combination of attributes. This lets you zoom into critical routes, ignore noise, and analyze only the requests that matter.
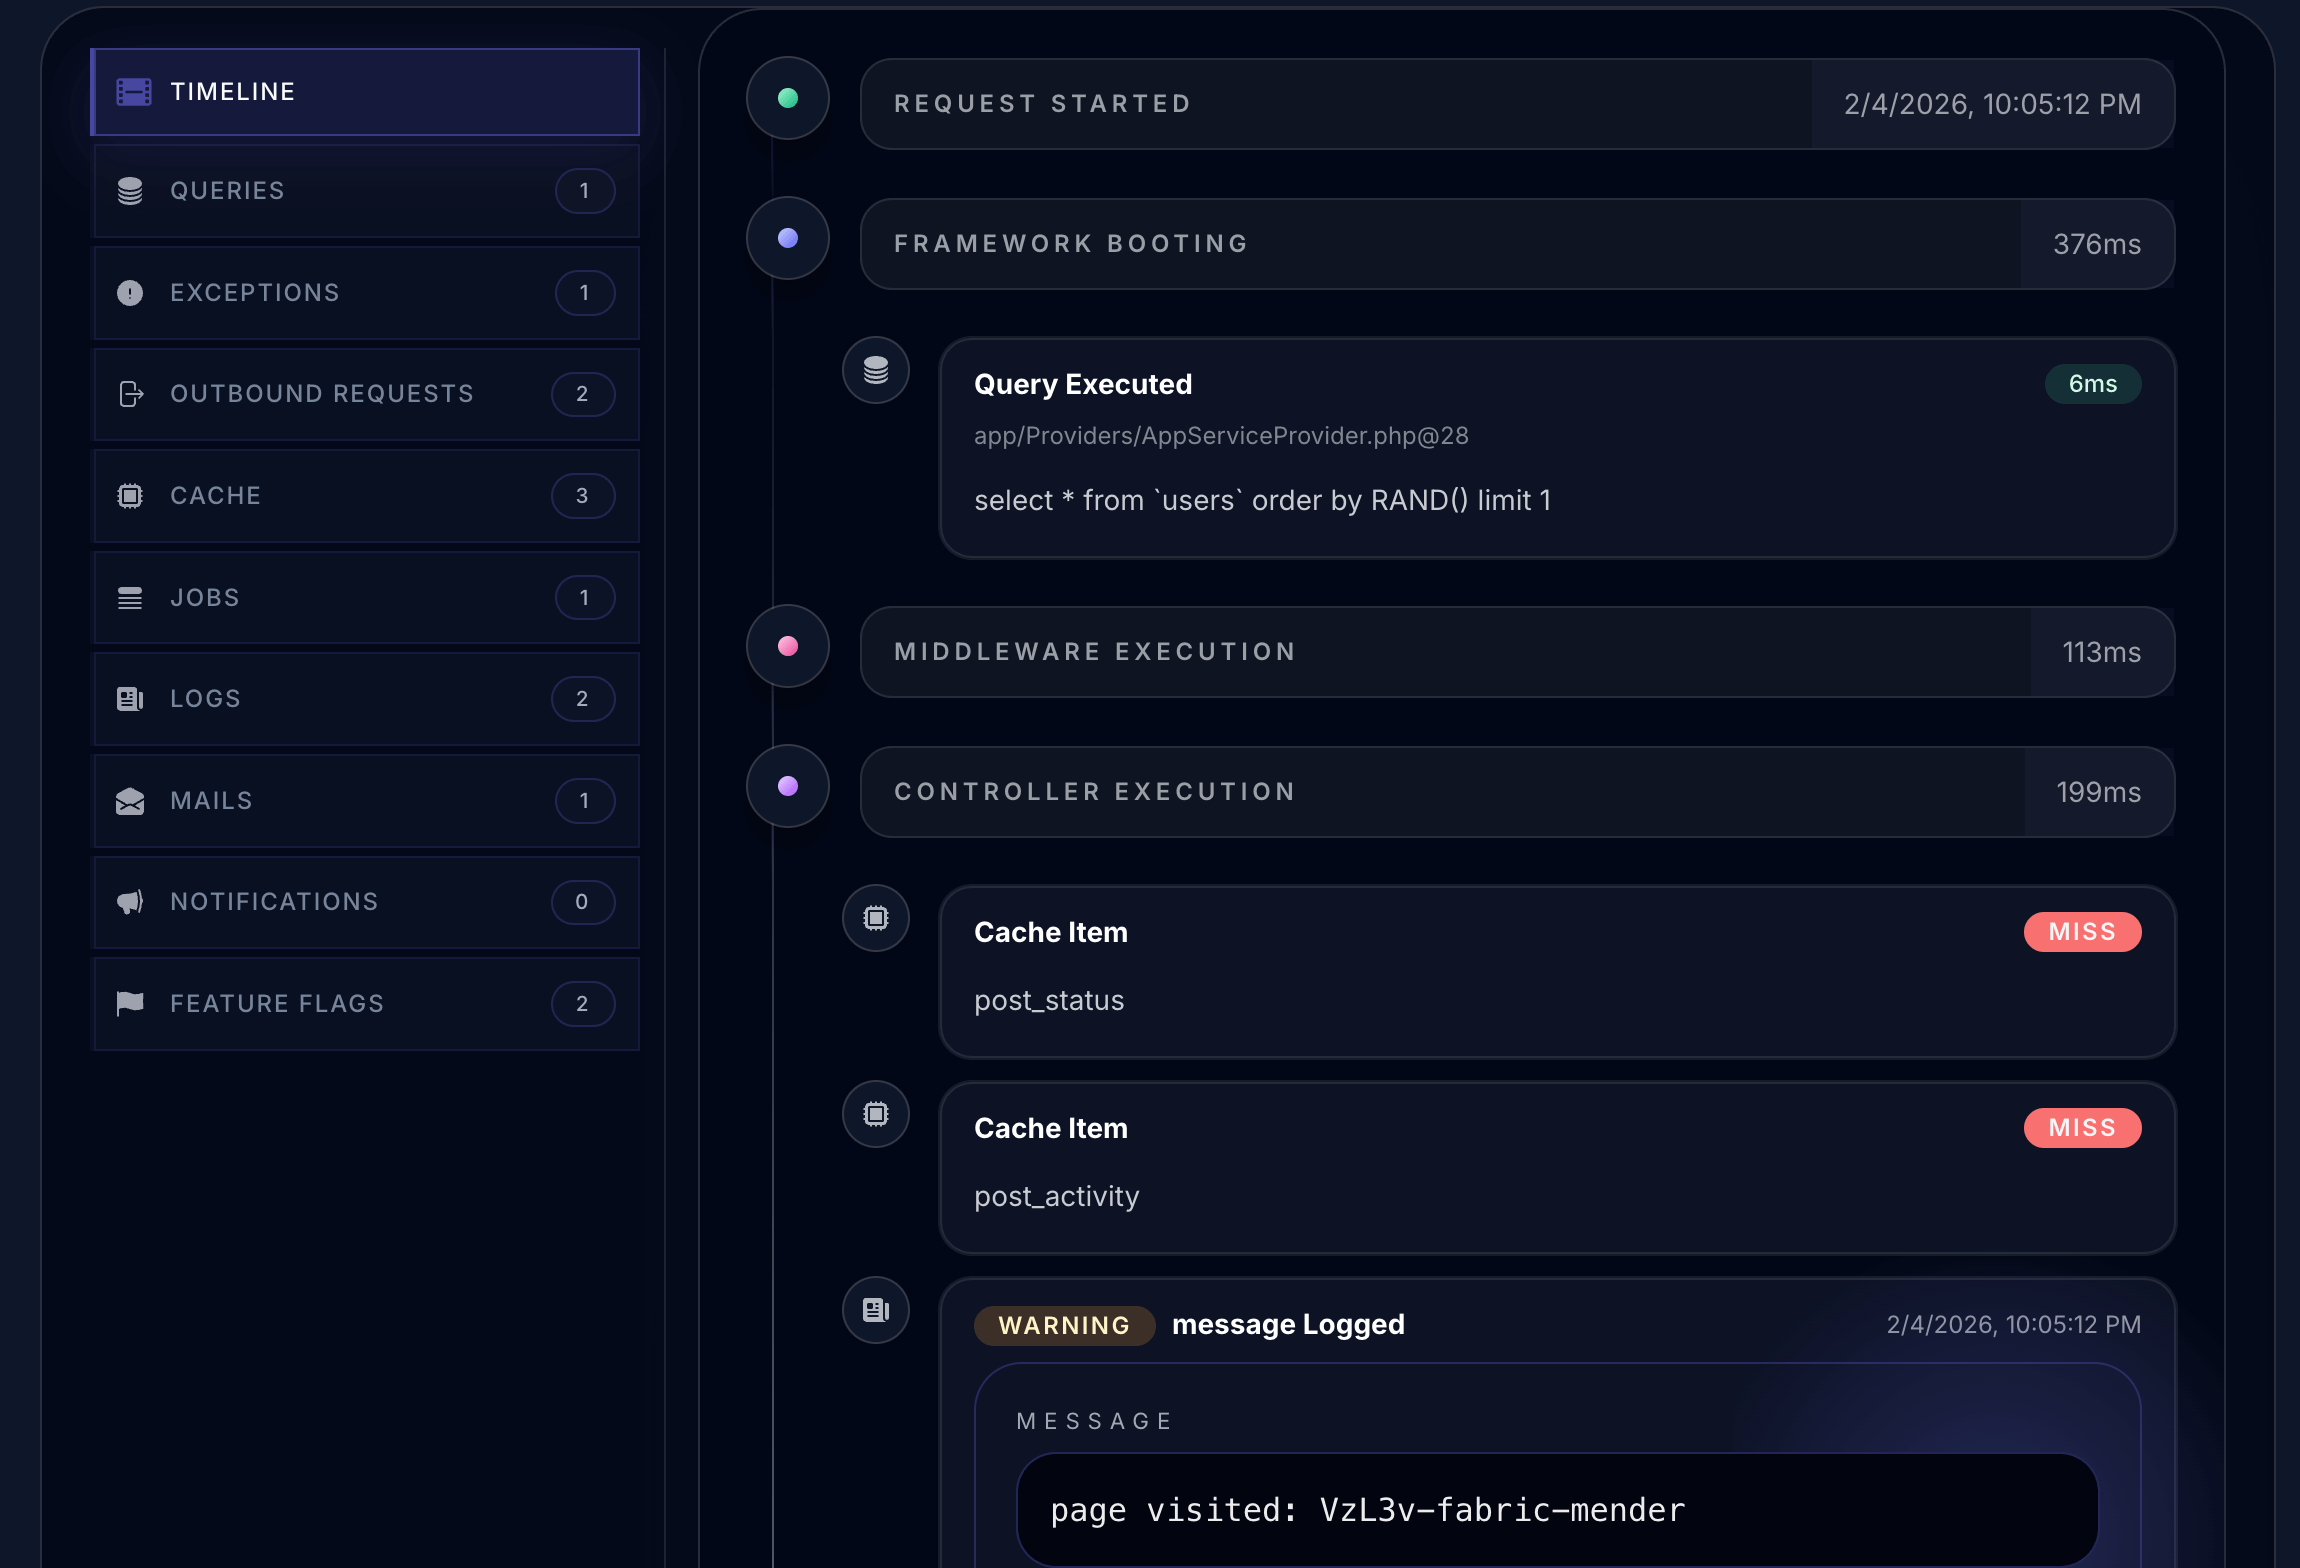
Interactive timeline
Follow a request across every subsystem.
The request timeline pins every event on a single visual lane. You can identify the exact moment a query, cache miss, outbound call, or queued job added latency and immediately jump to the related detail.
Database queries
Every query and its duration, including duplicates and N+1 patterns.
Cache hits & misses
Understand cache effectiveness and invalidation timing.
Outbound requests
See all external API calls, response times, and failures.
Mails, notifications, and jobs
Track queued work spawned by a single request.
Logs & feature flags
Correlate app logs and flag checks in the exact request flow.
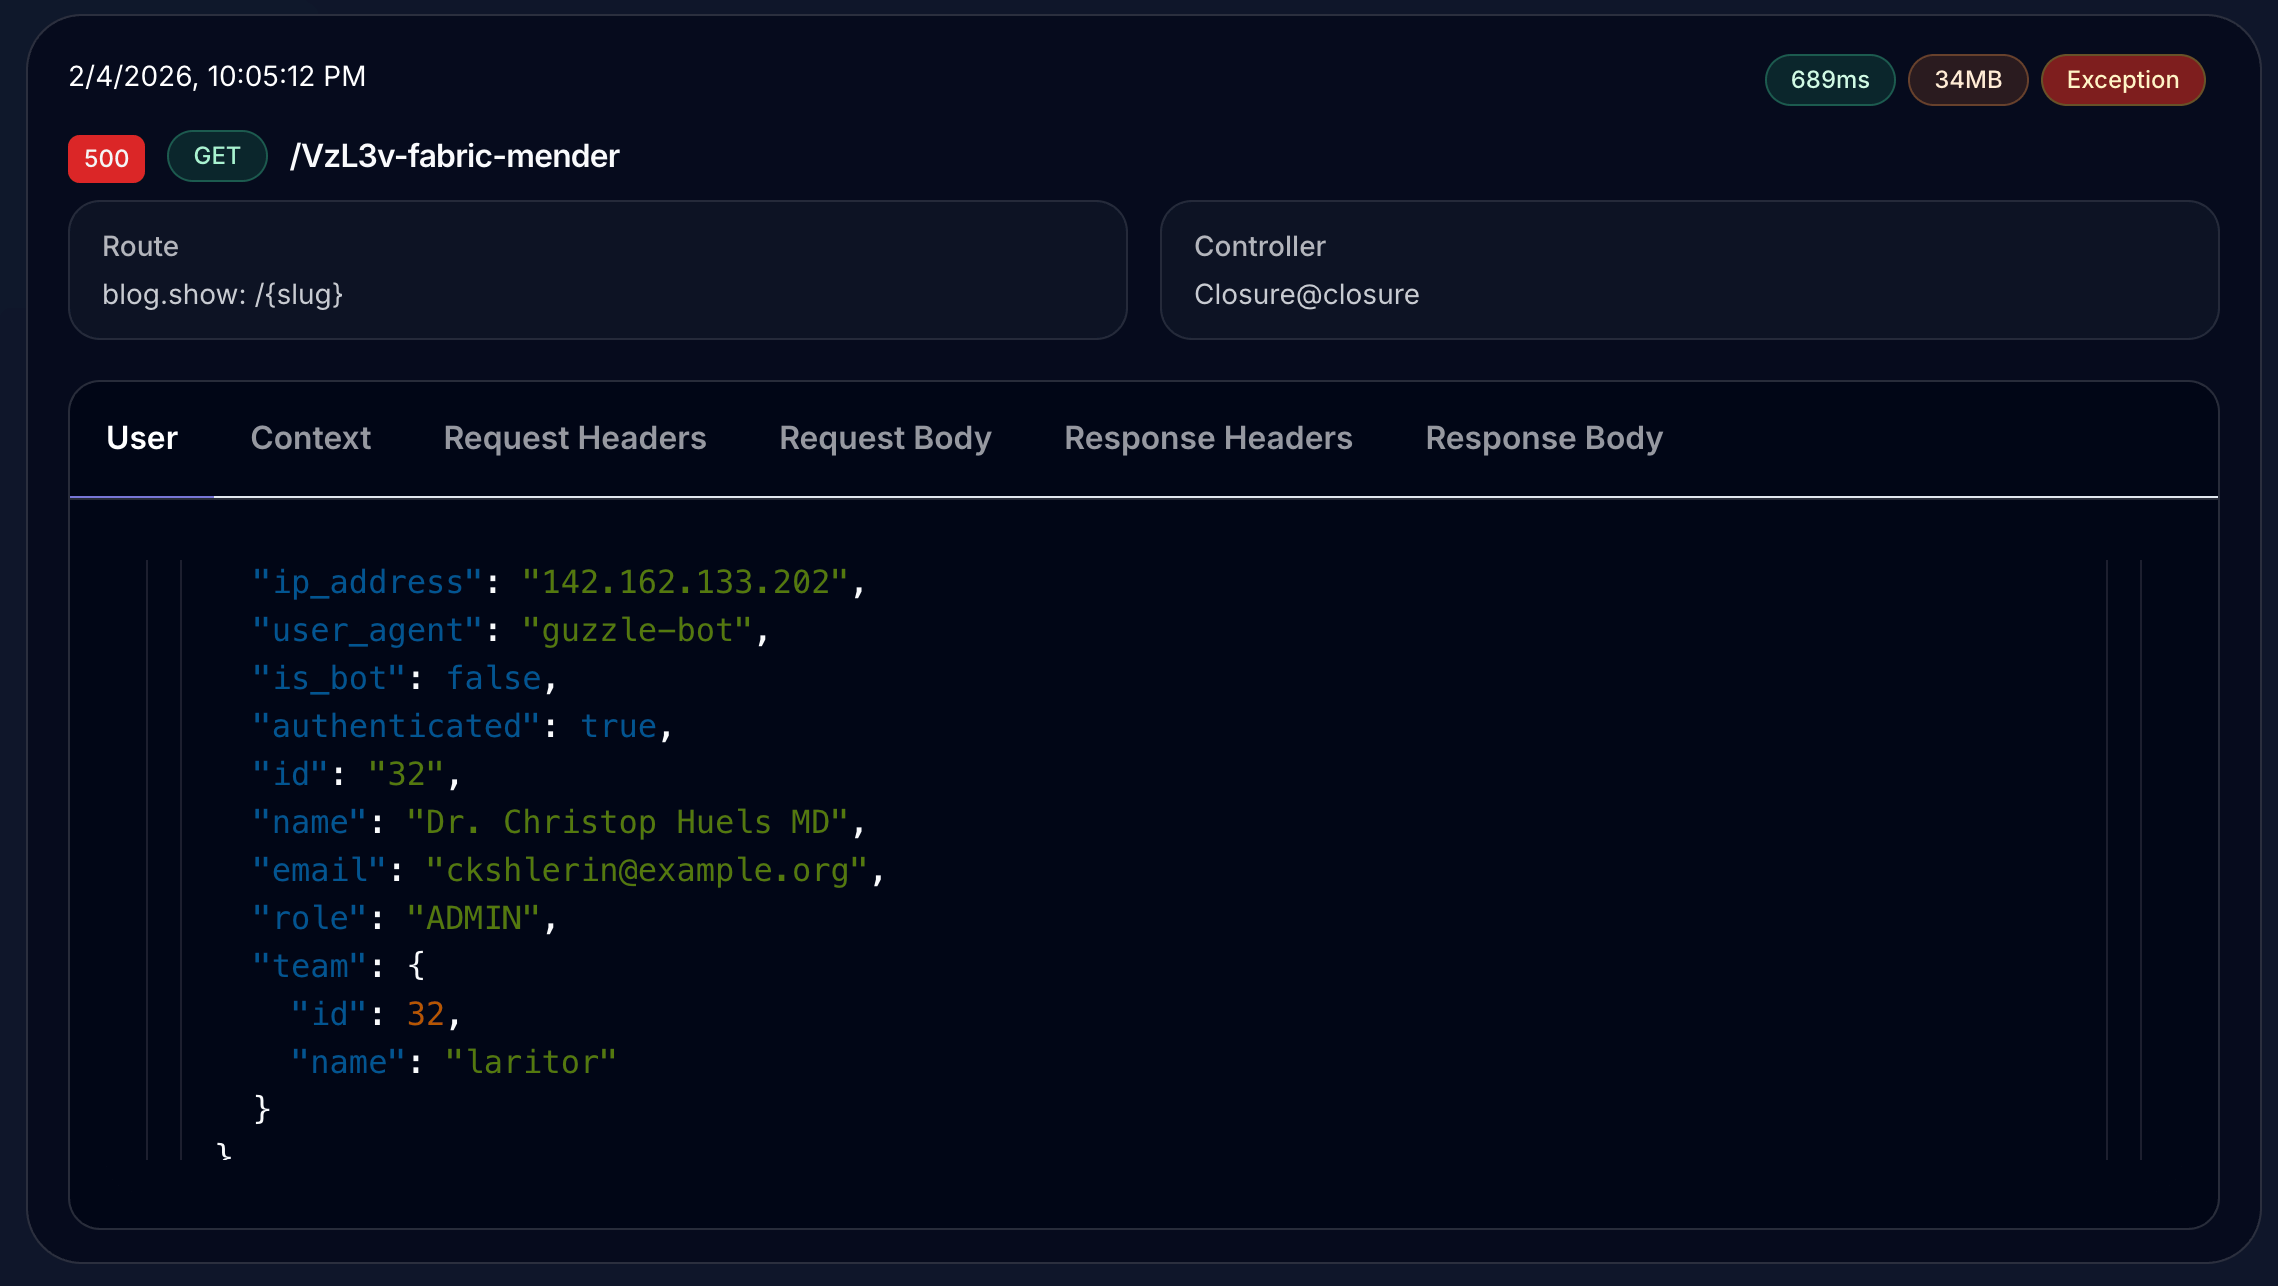
Request context
Everything you need to reproduce, debug, and fix.
Laritor captures the full request story: who made it, what they sent, and how your app responded. You can configure redaction rules to protect sensitive fields while keeping the debugging signal intact.
- Authenticated user details (ID, email, role, team)
- Custom context metadata captured at the point of request
- Full request headers and body (with redaction controls)
- Full response headers and response body (optional)
- Server and environment metadata for reproducibility
- Route parameters and middleware context
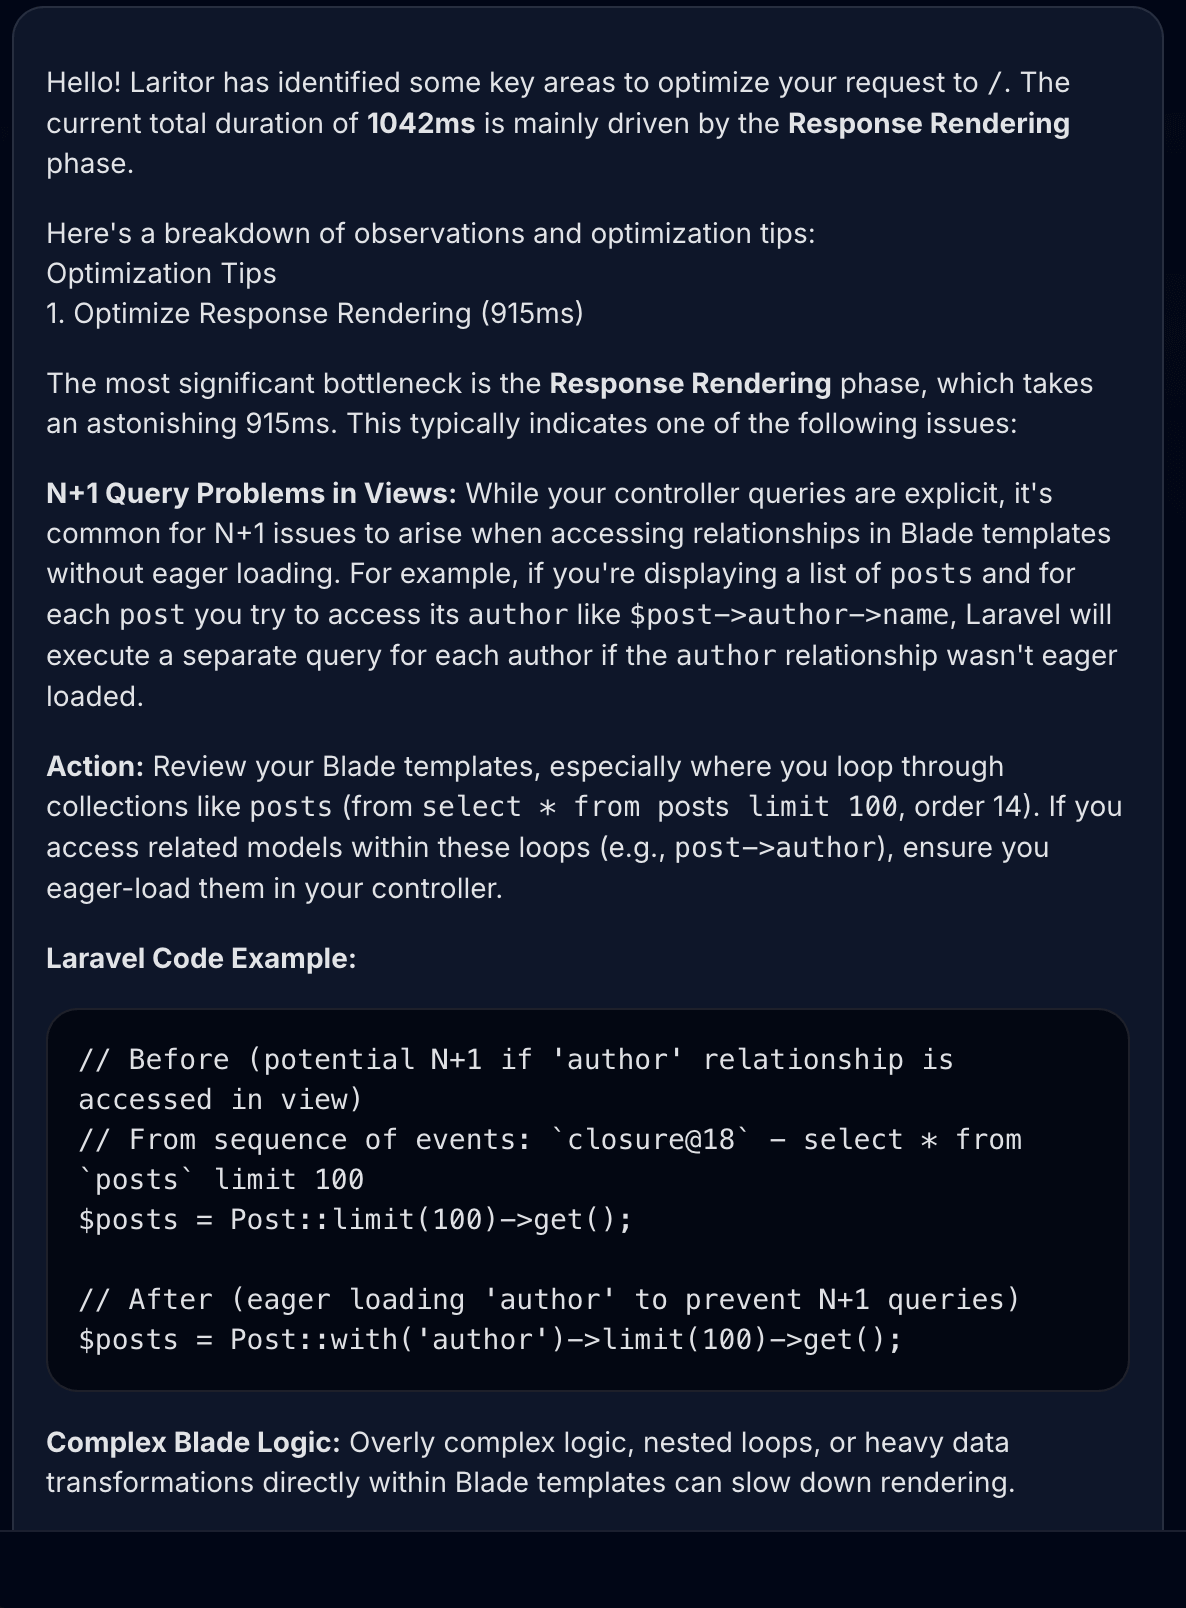
Laritor AI
Automatic insights for faster optimization.
Laritor AI reviews request traces in the context of your Laravel app, database schema, and performance history. It highlights the most impactful fixes without requiring manual combing through logs.
One request. One glance. Clear next steps.
Request observability that scales with your Laravel app.
From low-traffic admin tools to high-volume APIs, Laritor keeps every request measurable, explorable, and actionable. Never ship a release without knowing exactly how it behaves in production.