Error tracking & performance monitoring built for Laravel teams.
Laritor helps you track and improve your Laravel app’s performance with continuous insights, automated alerts, and deep analytics, so you can focus on building, not debugging.
30s
to start monitoring
Zero
Infrastructure changes required
No
Noticeable performance impact
Trusted by Laravel teams worldwide
Trusted by teams that care about performance, reliability, and debugging speed
Uptime Monitoring - But For Data Quality
Digital Marketing Company in UK
Advertising Agency in India
Live product tour ● 4 minutes
Watch the observability walkthrough
Explore how Laritor surfaces slow endpoints, broken queues, and failing health checks in one interface. Learn how alerts route to Slack or email, how AI insights highlight the true bottleneck, and how dashboards keep leadership informed.
Watch the demo30 seconds
Avg rollout
14+
Signals traced
24/7
Alert coverage
Optimized for Laravel
End-to-End Visibility Into Your Application Lifecycle
Laritor captures all Laravel framework events, correlates them automatically, and renders a unified timeline that accelerates root-cause analysis.
HTTP requests
Track request latency, errors, and execution details for every incoming HTTP request.
Artisan commands
Monitor execution time, failures, and performance of long-running or scheduled Artisan commands.
Scheduled tasks
Track execution time, failures, and get visibility when scheduled tasks are delayed or miss their expected run time.
Queued jobs
Analyze job execution time, retries, and failures to prevent slow or stuck queues.
Exceptions & stack traces
Capture full exception stack traces to quickly identify and debug production errors.
Database queries
Measure query execution time, frequency, and bottlenecks to uncover slow or inefficient queries.
Outbound HTTP calls
Track latency, failures, and response details for external API and service calls.
Cache hits & misses
Understand cache effectiveness by tracking hits, misses, and overall cache performance.
Application logs
Automatically collect and correlate application logs with requests and background processes.
Custom logs
Send custom logs such as audit logs, access logs, or business events to gain visibility into critical workflows.
Mails & notifications
Track delivery timing and failures for emails and notifications sent by your application.
Health checks
Create custom health checks to monitor critical parts of your application, such as payment service uptime, queue worker health, and external dependencies.
Server metrics
Monitor CPU, memory, and resource usage to correlate infrastructure health with app performance.
Feature flags
Track feature flag usage and measure their impact on performance and errors in production.
Start monitoring in under 30 seconds
Install the Laritor ingest package and you’re live
A single Composer install streams detailed traces, exceptions, and performance metrics to Laritor with zero DevOps work. No agents to deploy, no sidecars to maintain.
composer require binarybuilds/laritor-client
LARITOR_ENABLED=true
LARITOR_INGEST_ENDPOINT=ingest-url
LARITOR_BACKEND_KEY=your-unique-key
No more bottlenecks
A complete toolkit for analyzing Laravel performance.
Laritor brings together traces, metrics, dashboards, and reports into a single view, giving developers and incident responders the context required to diagnose performance problems quickly.
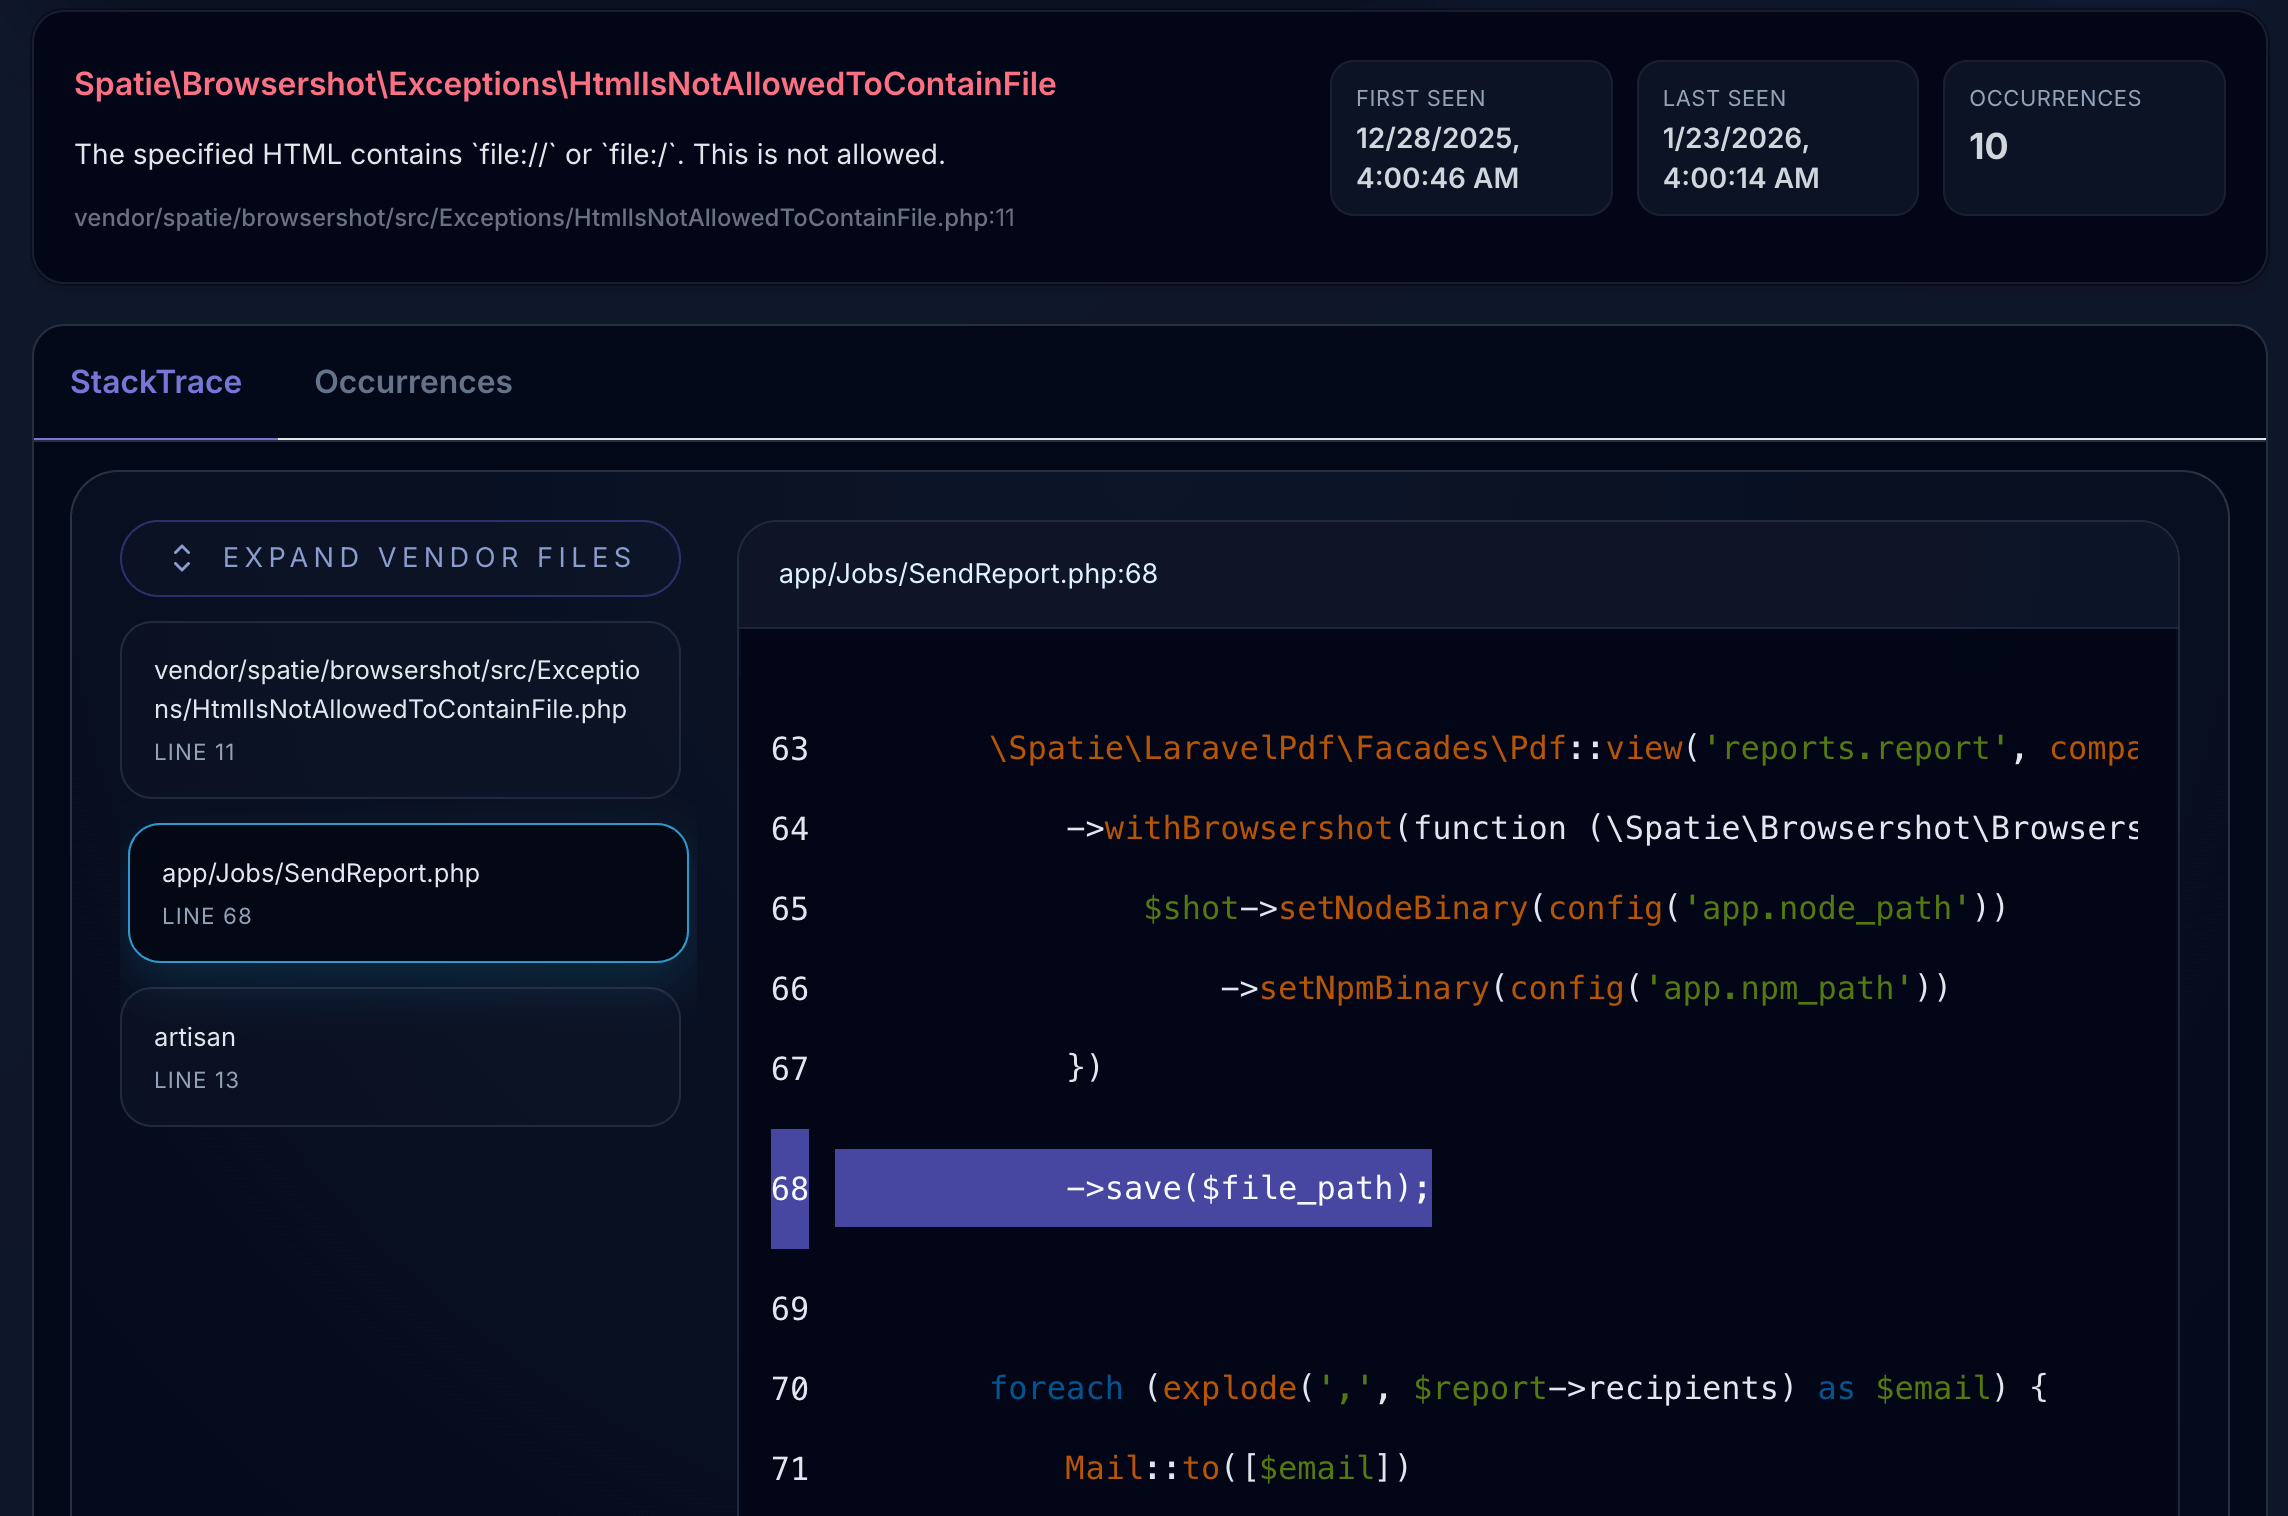
Deep error tracking
Trace every exception down to the exact line of code, complete with user context, stack details, and AI suggestions to help you ship fast fixes.
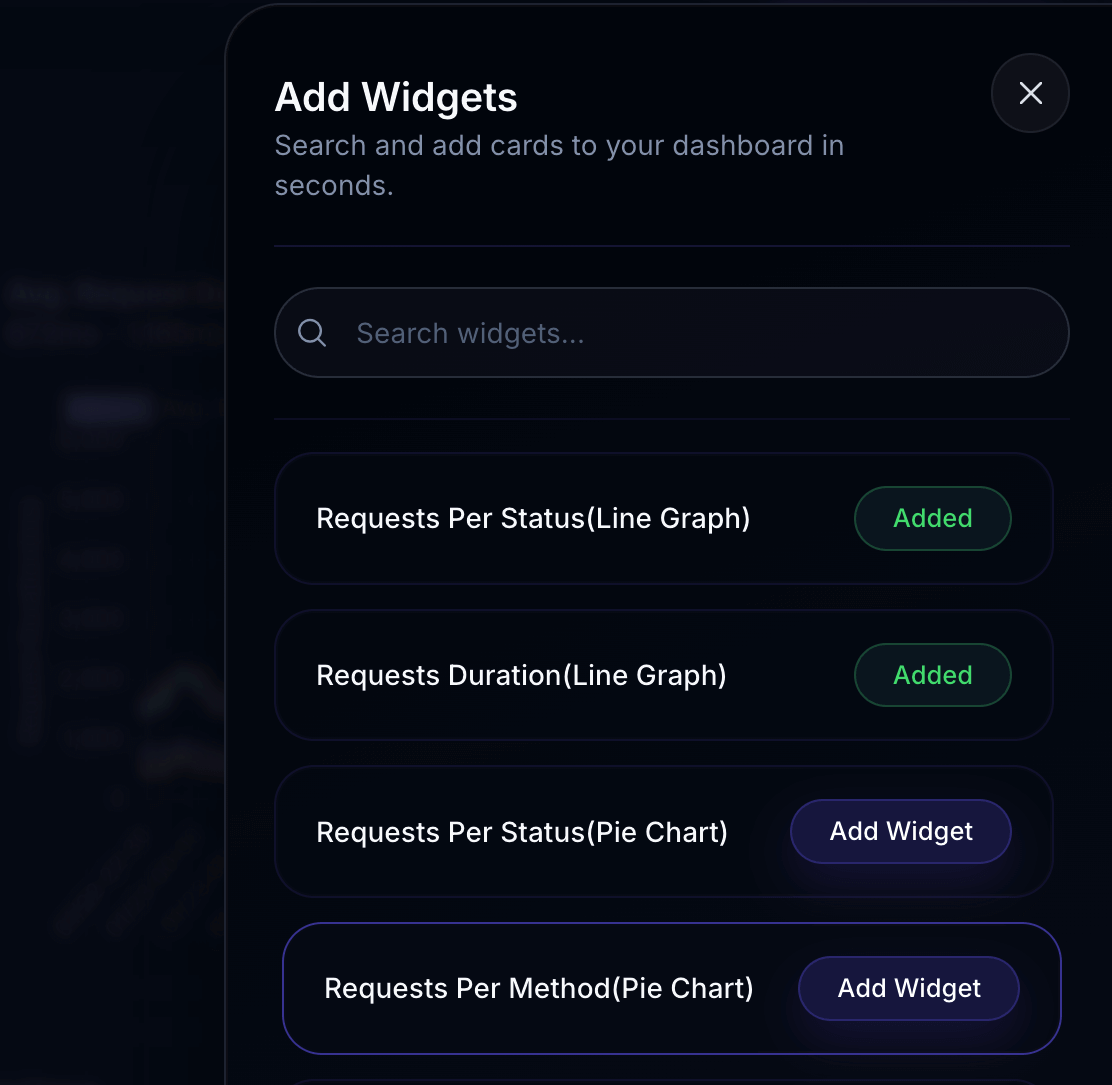
Customizable Dashboards
Drag, drop, and organize charts to build dashboards tailored to your debugging workflow. Get real-time insight into your Laravel app without scripting or configuration.
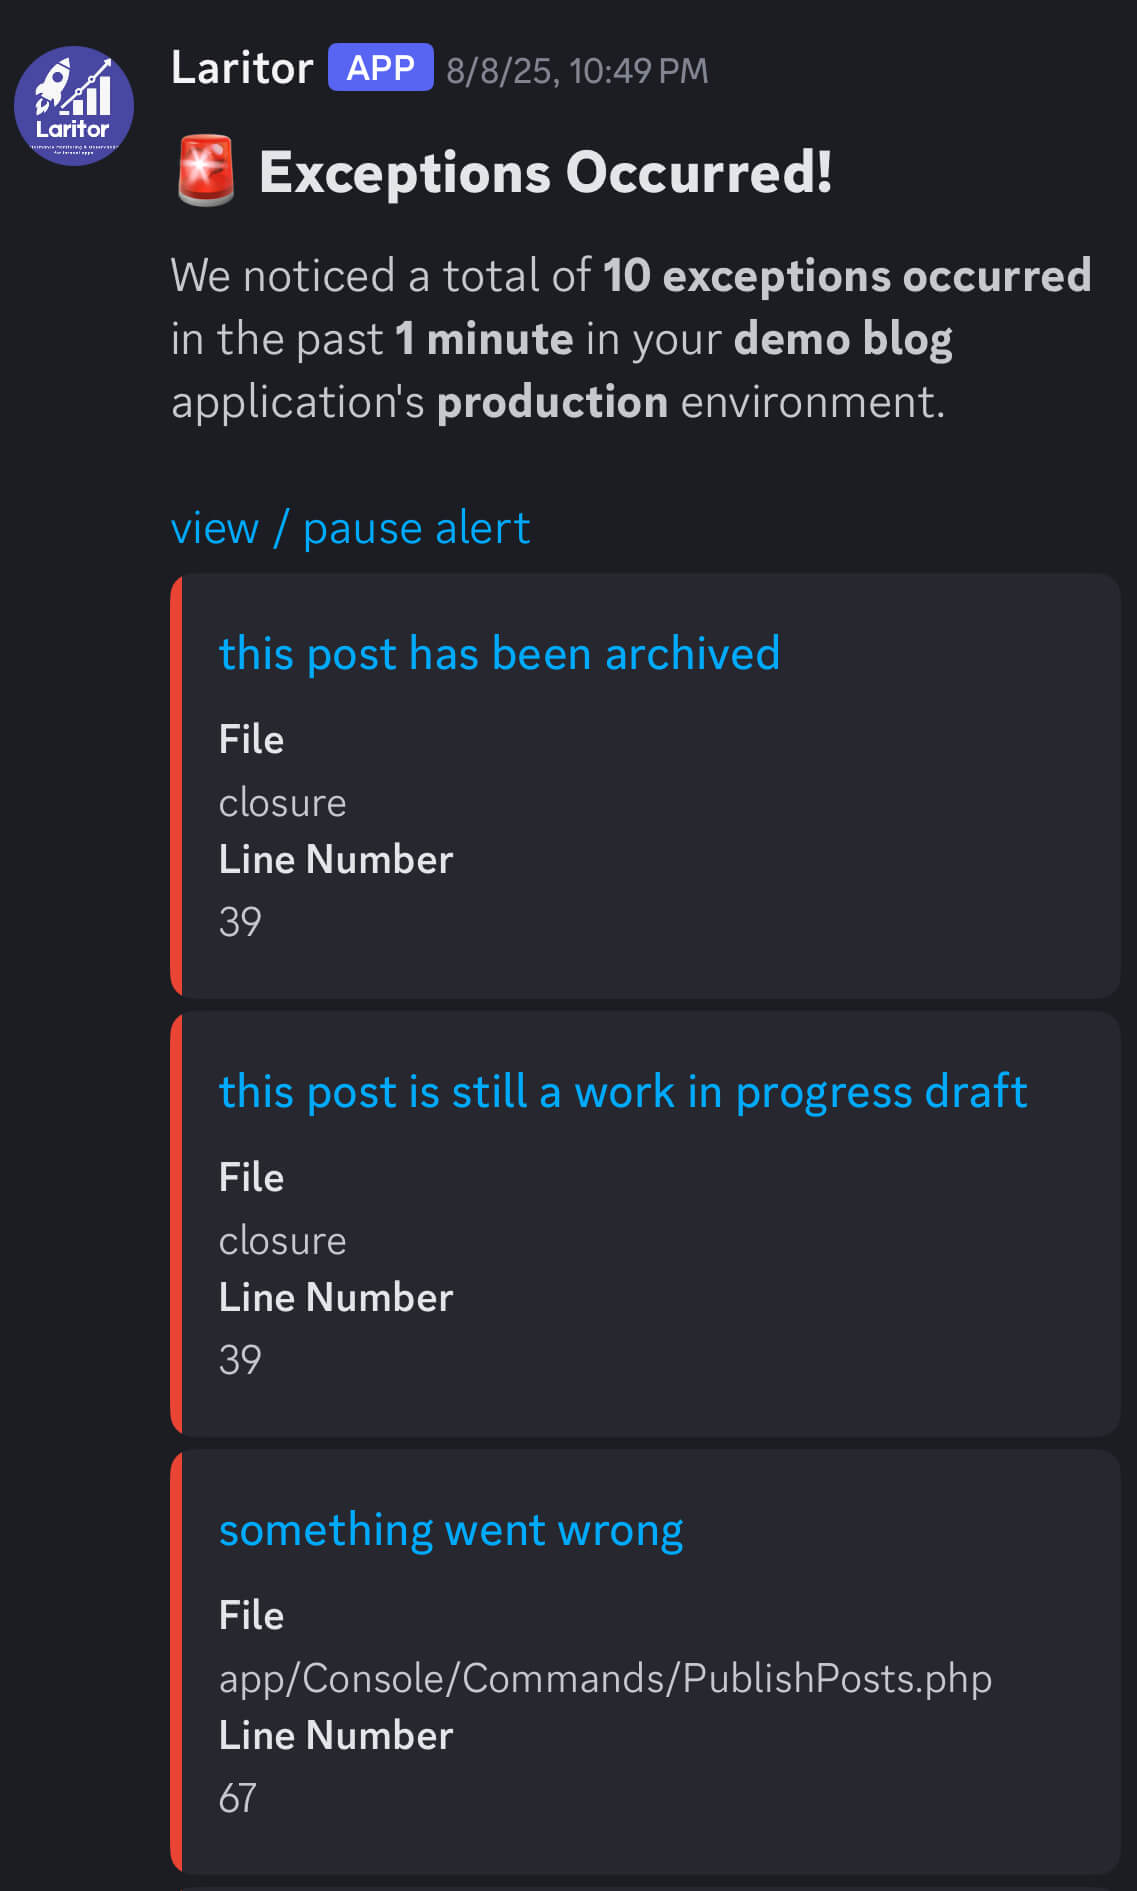
Instant Team Alerts
Set triggers for slow requests, 4xx/5xx spikes, slow queries, exceptions, failed health checks, or resource issues. Laritor delivers alerts instantly to Email, Slack, Discord, Microsoft Teams, or any webhook.
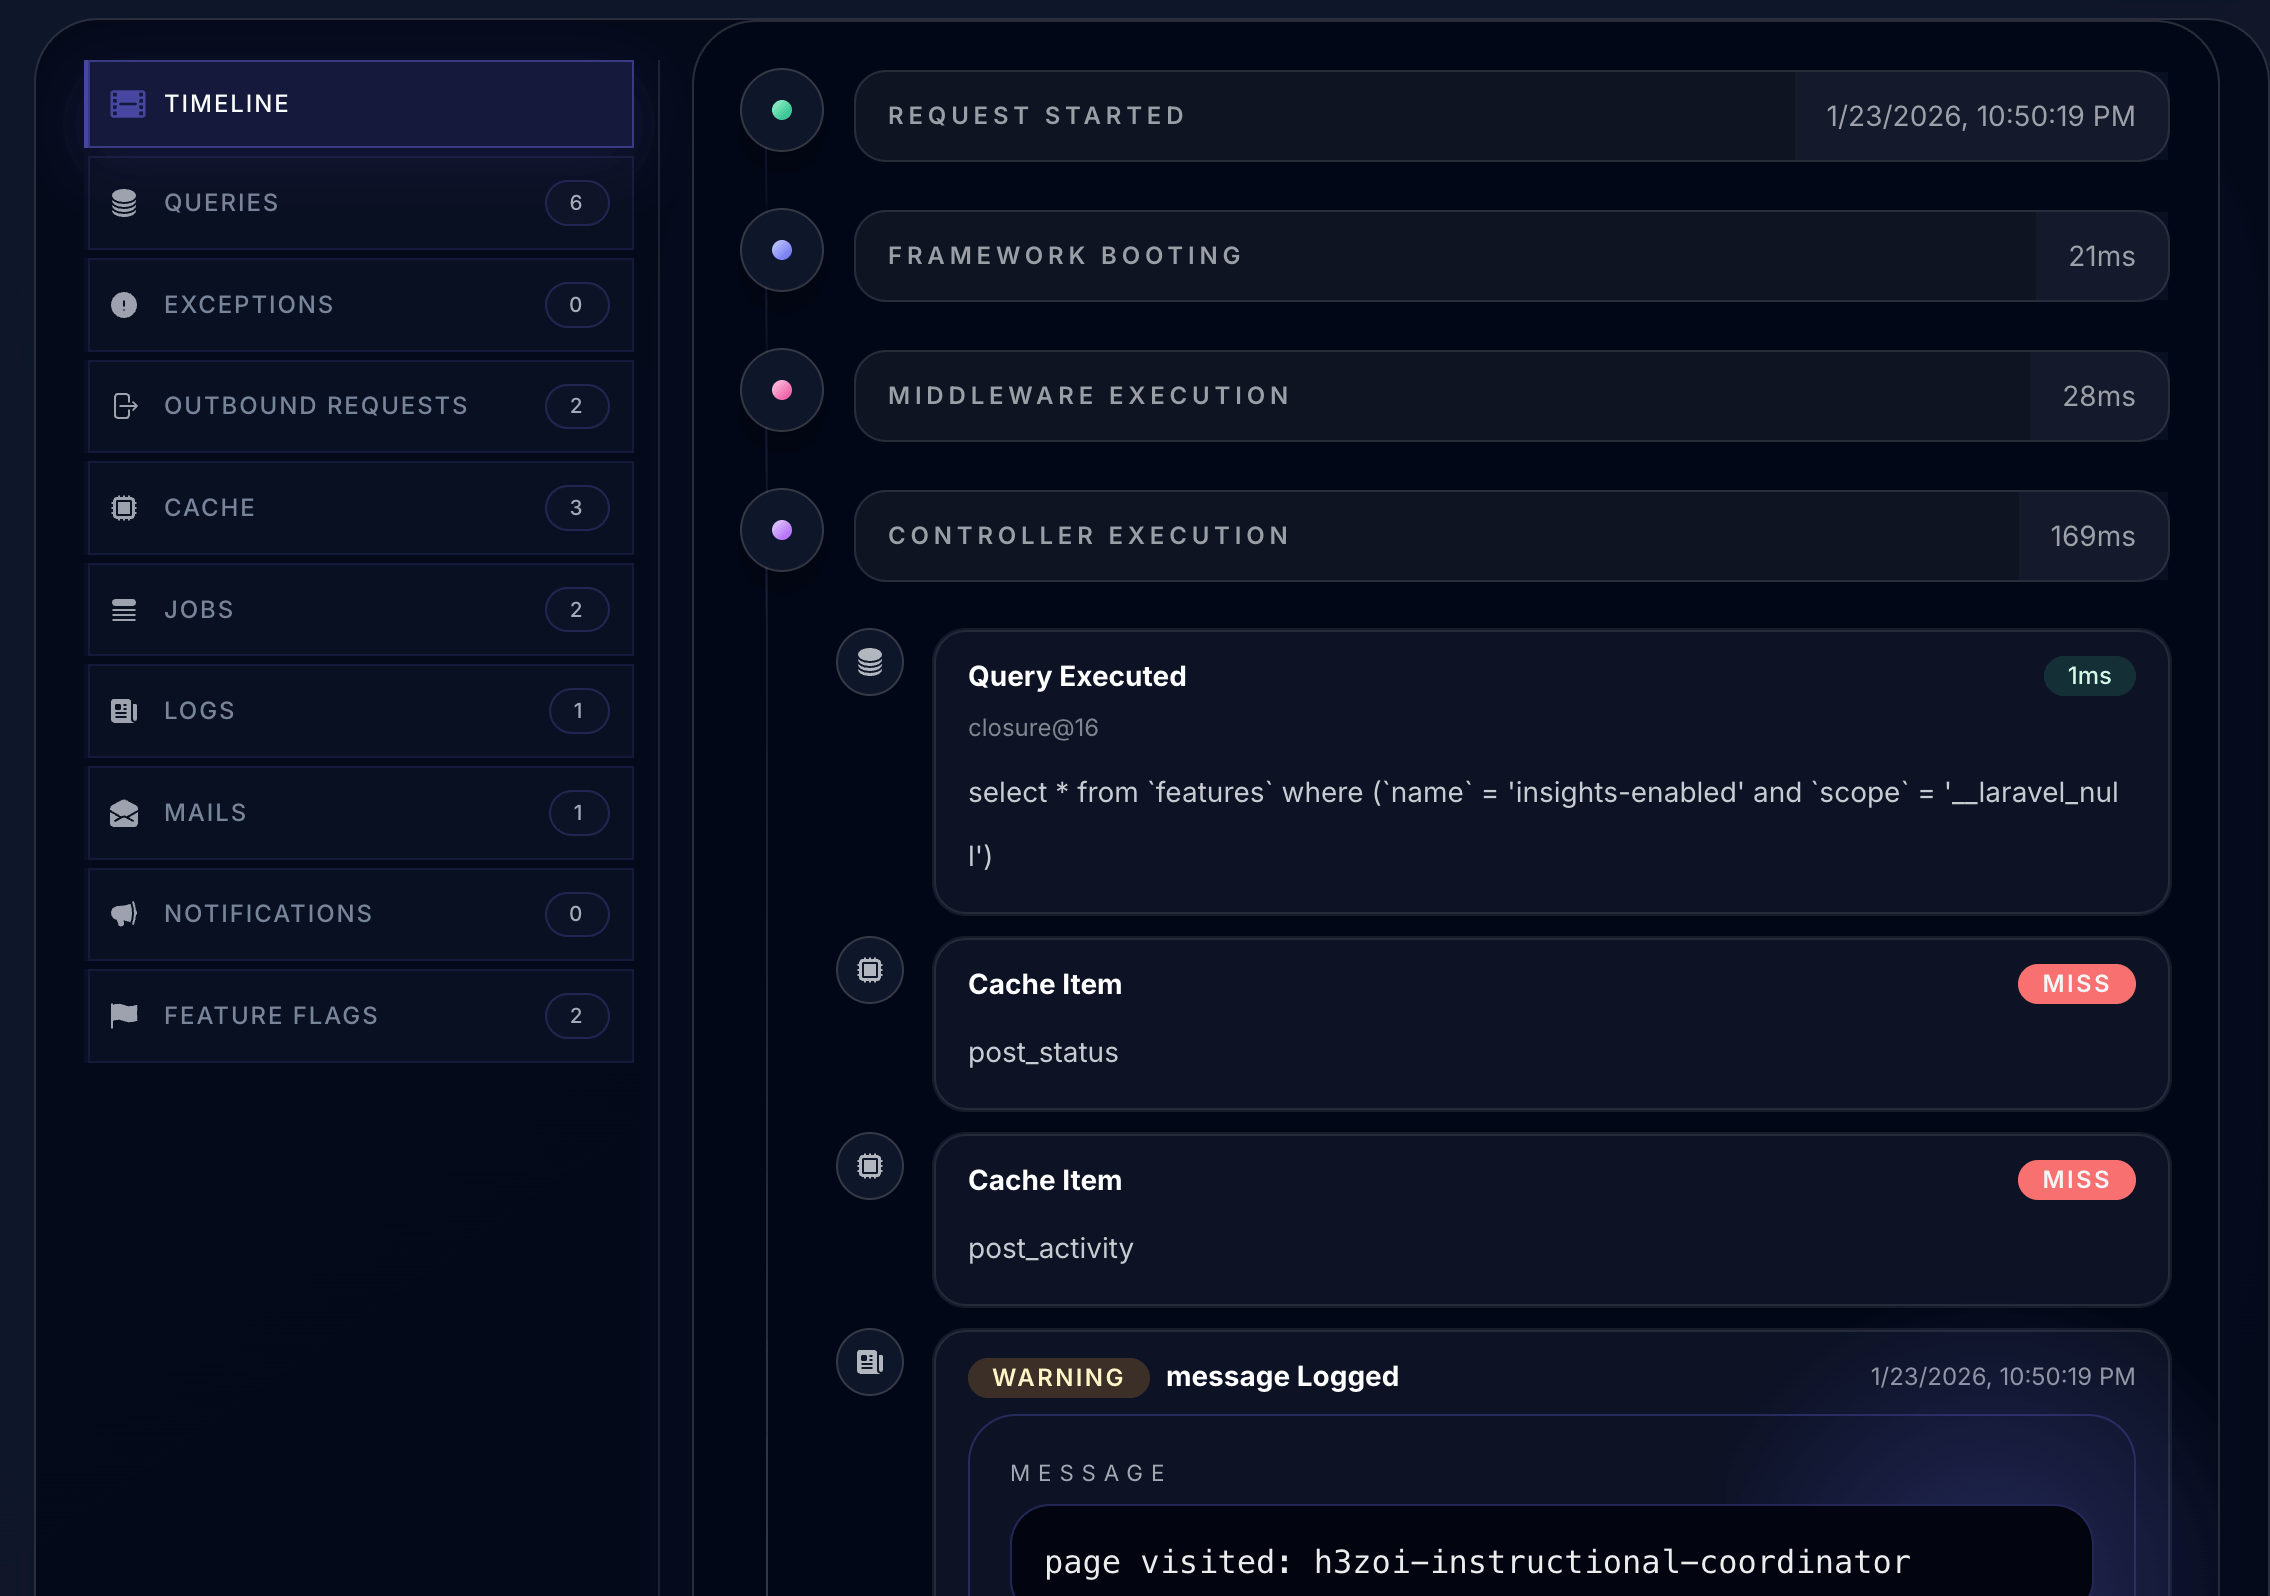
Interactive Timeline
See the full lifecycle of any request, command or job: database queries, emails, notifications, jobs, logs, and exceptions, all captured with precise ordering. The timeline view makes it easy to pinpoint slowdowns and understand what actually happened.
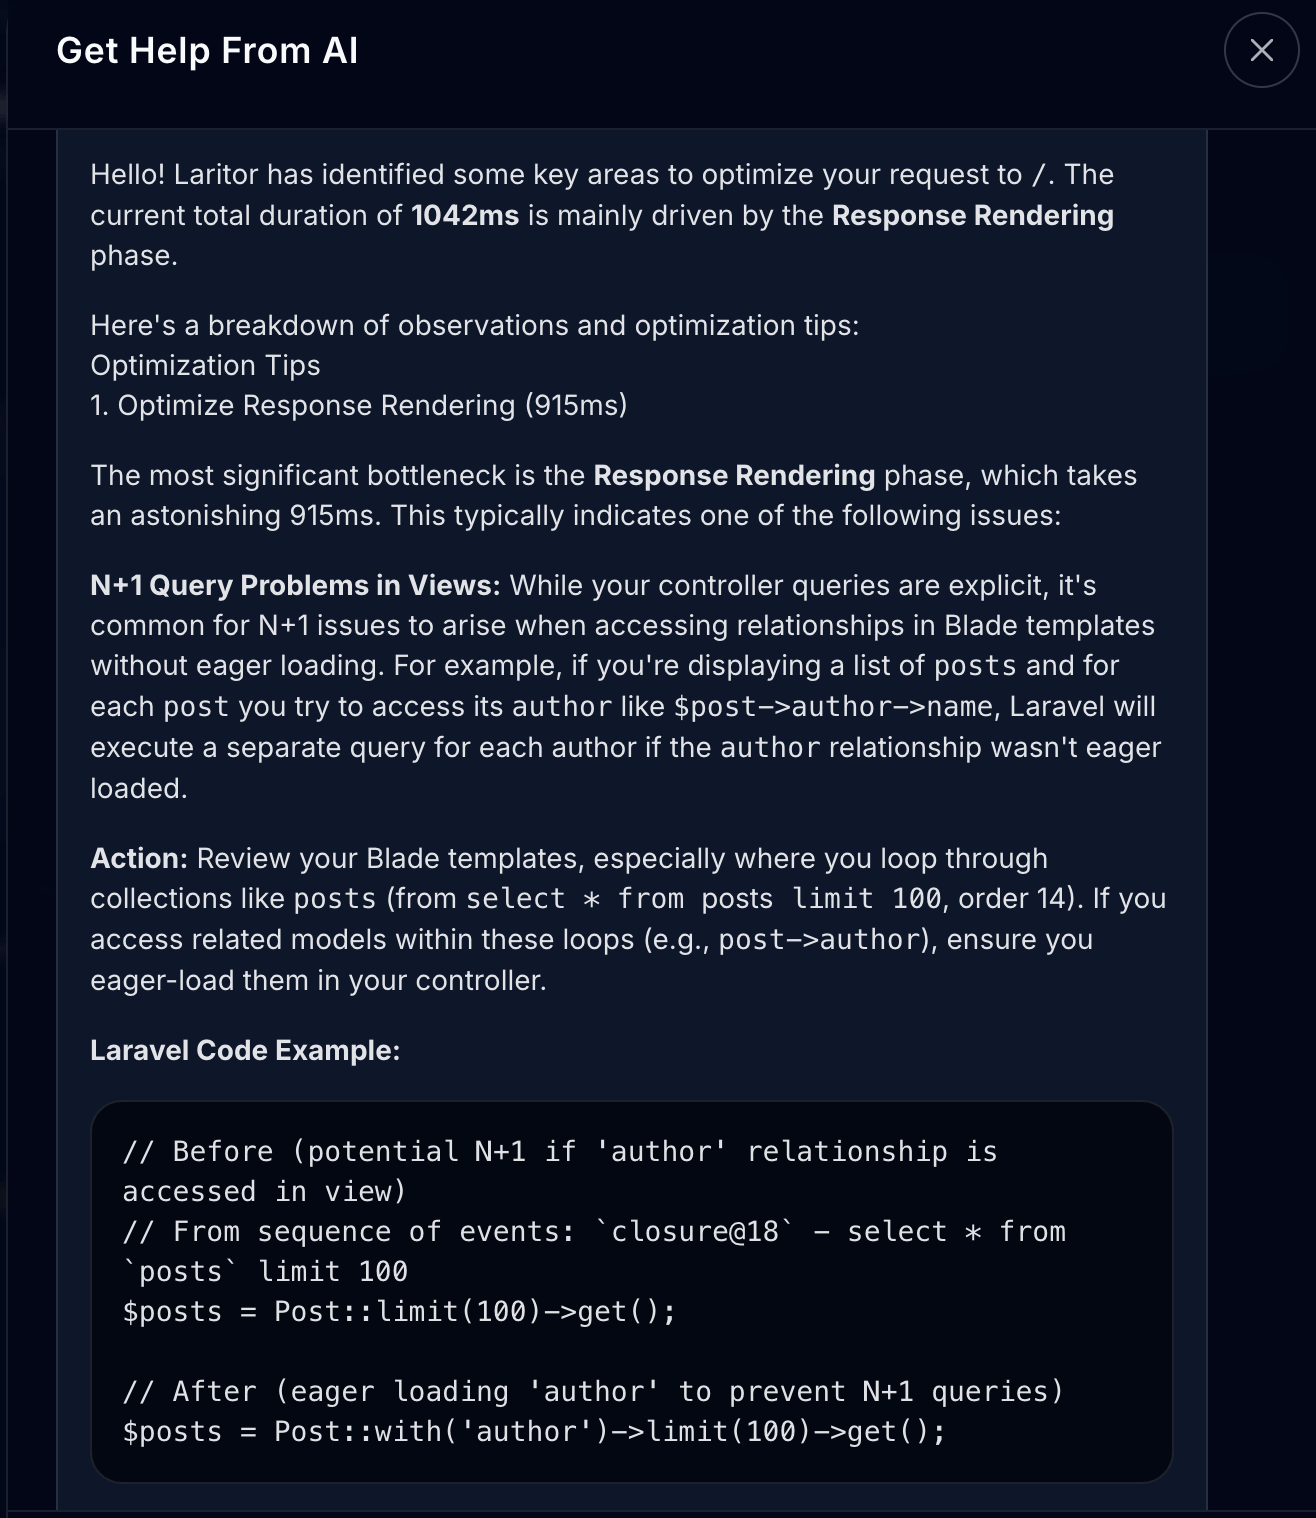
AI-Powered Optimization
By analyzing queries, jobs, emails, logs and other request events in context, Laritor’s AI identifies bottlenecks across your entire execution path. Recommendations are schema-aware and holistic, not surface-level fixes.
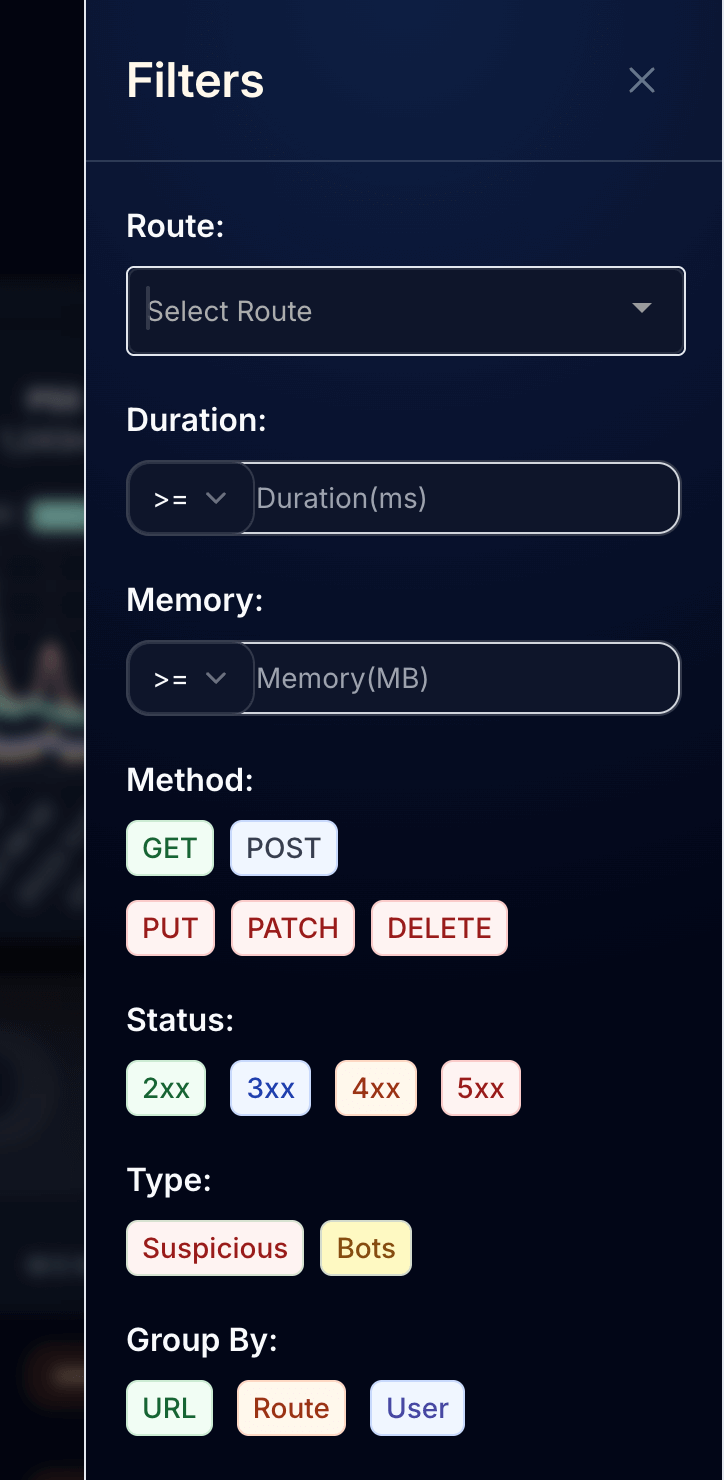
Advanced Filtering
Chain filters like timestamps, keywords, status codes, methods, routes, duration, memory and bot or suspicious patterns. Zero in on the requests that matter without digging through noise.
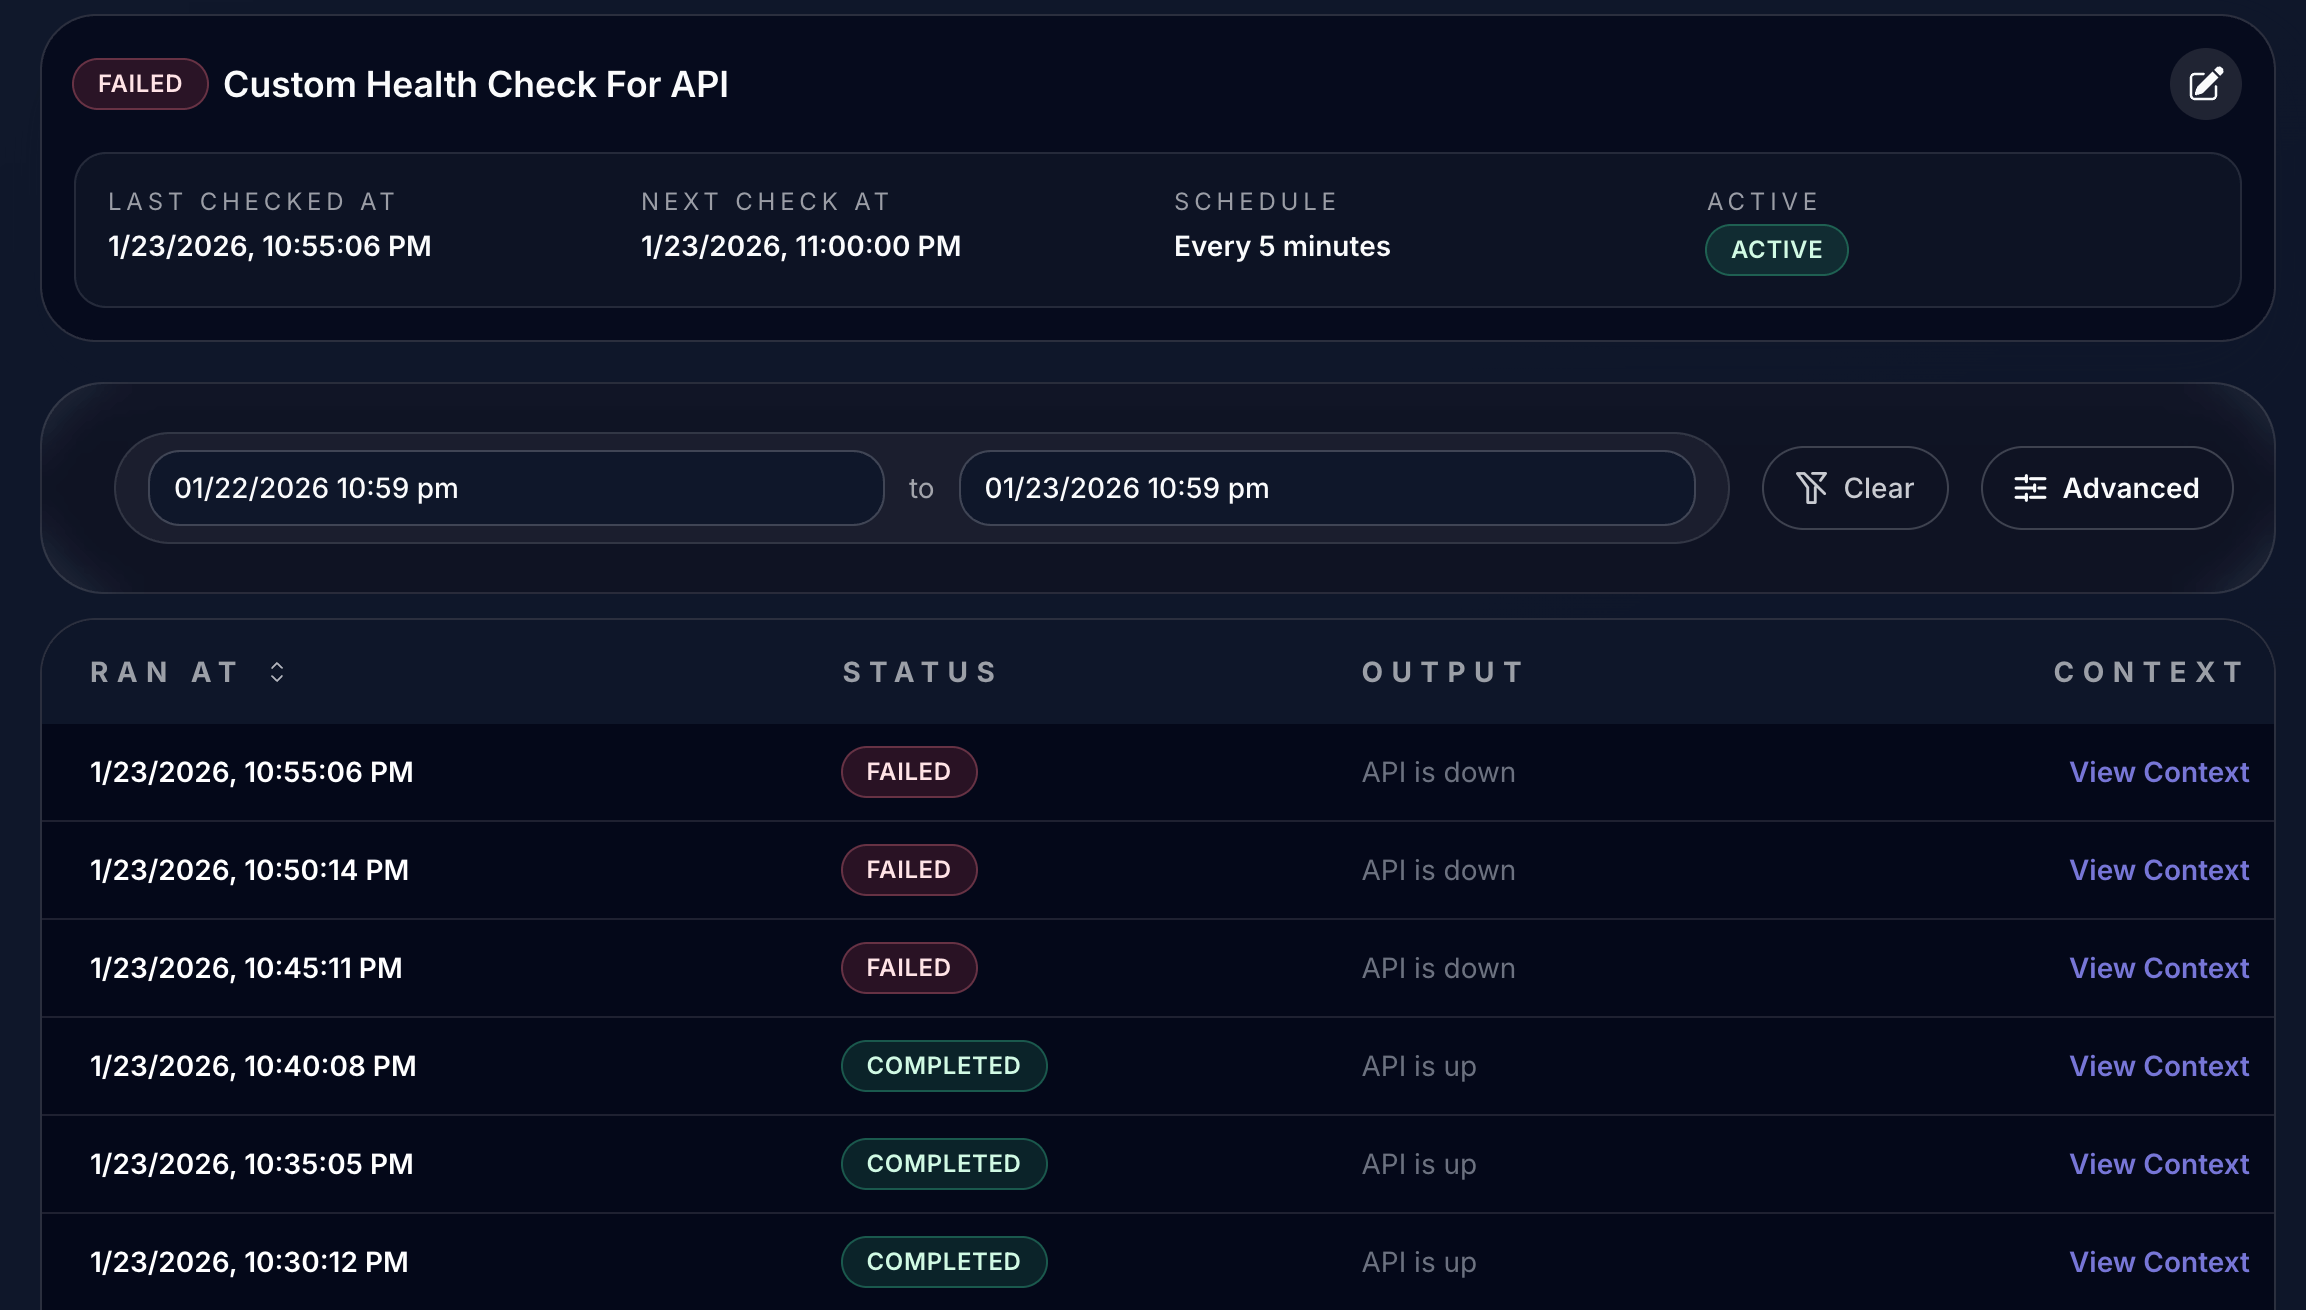
Custom Health Checks for Critical Systems
Monitor APIs, payment providers and integrations with checks you define. Get alerts the moment something goes down.
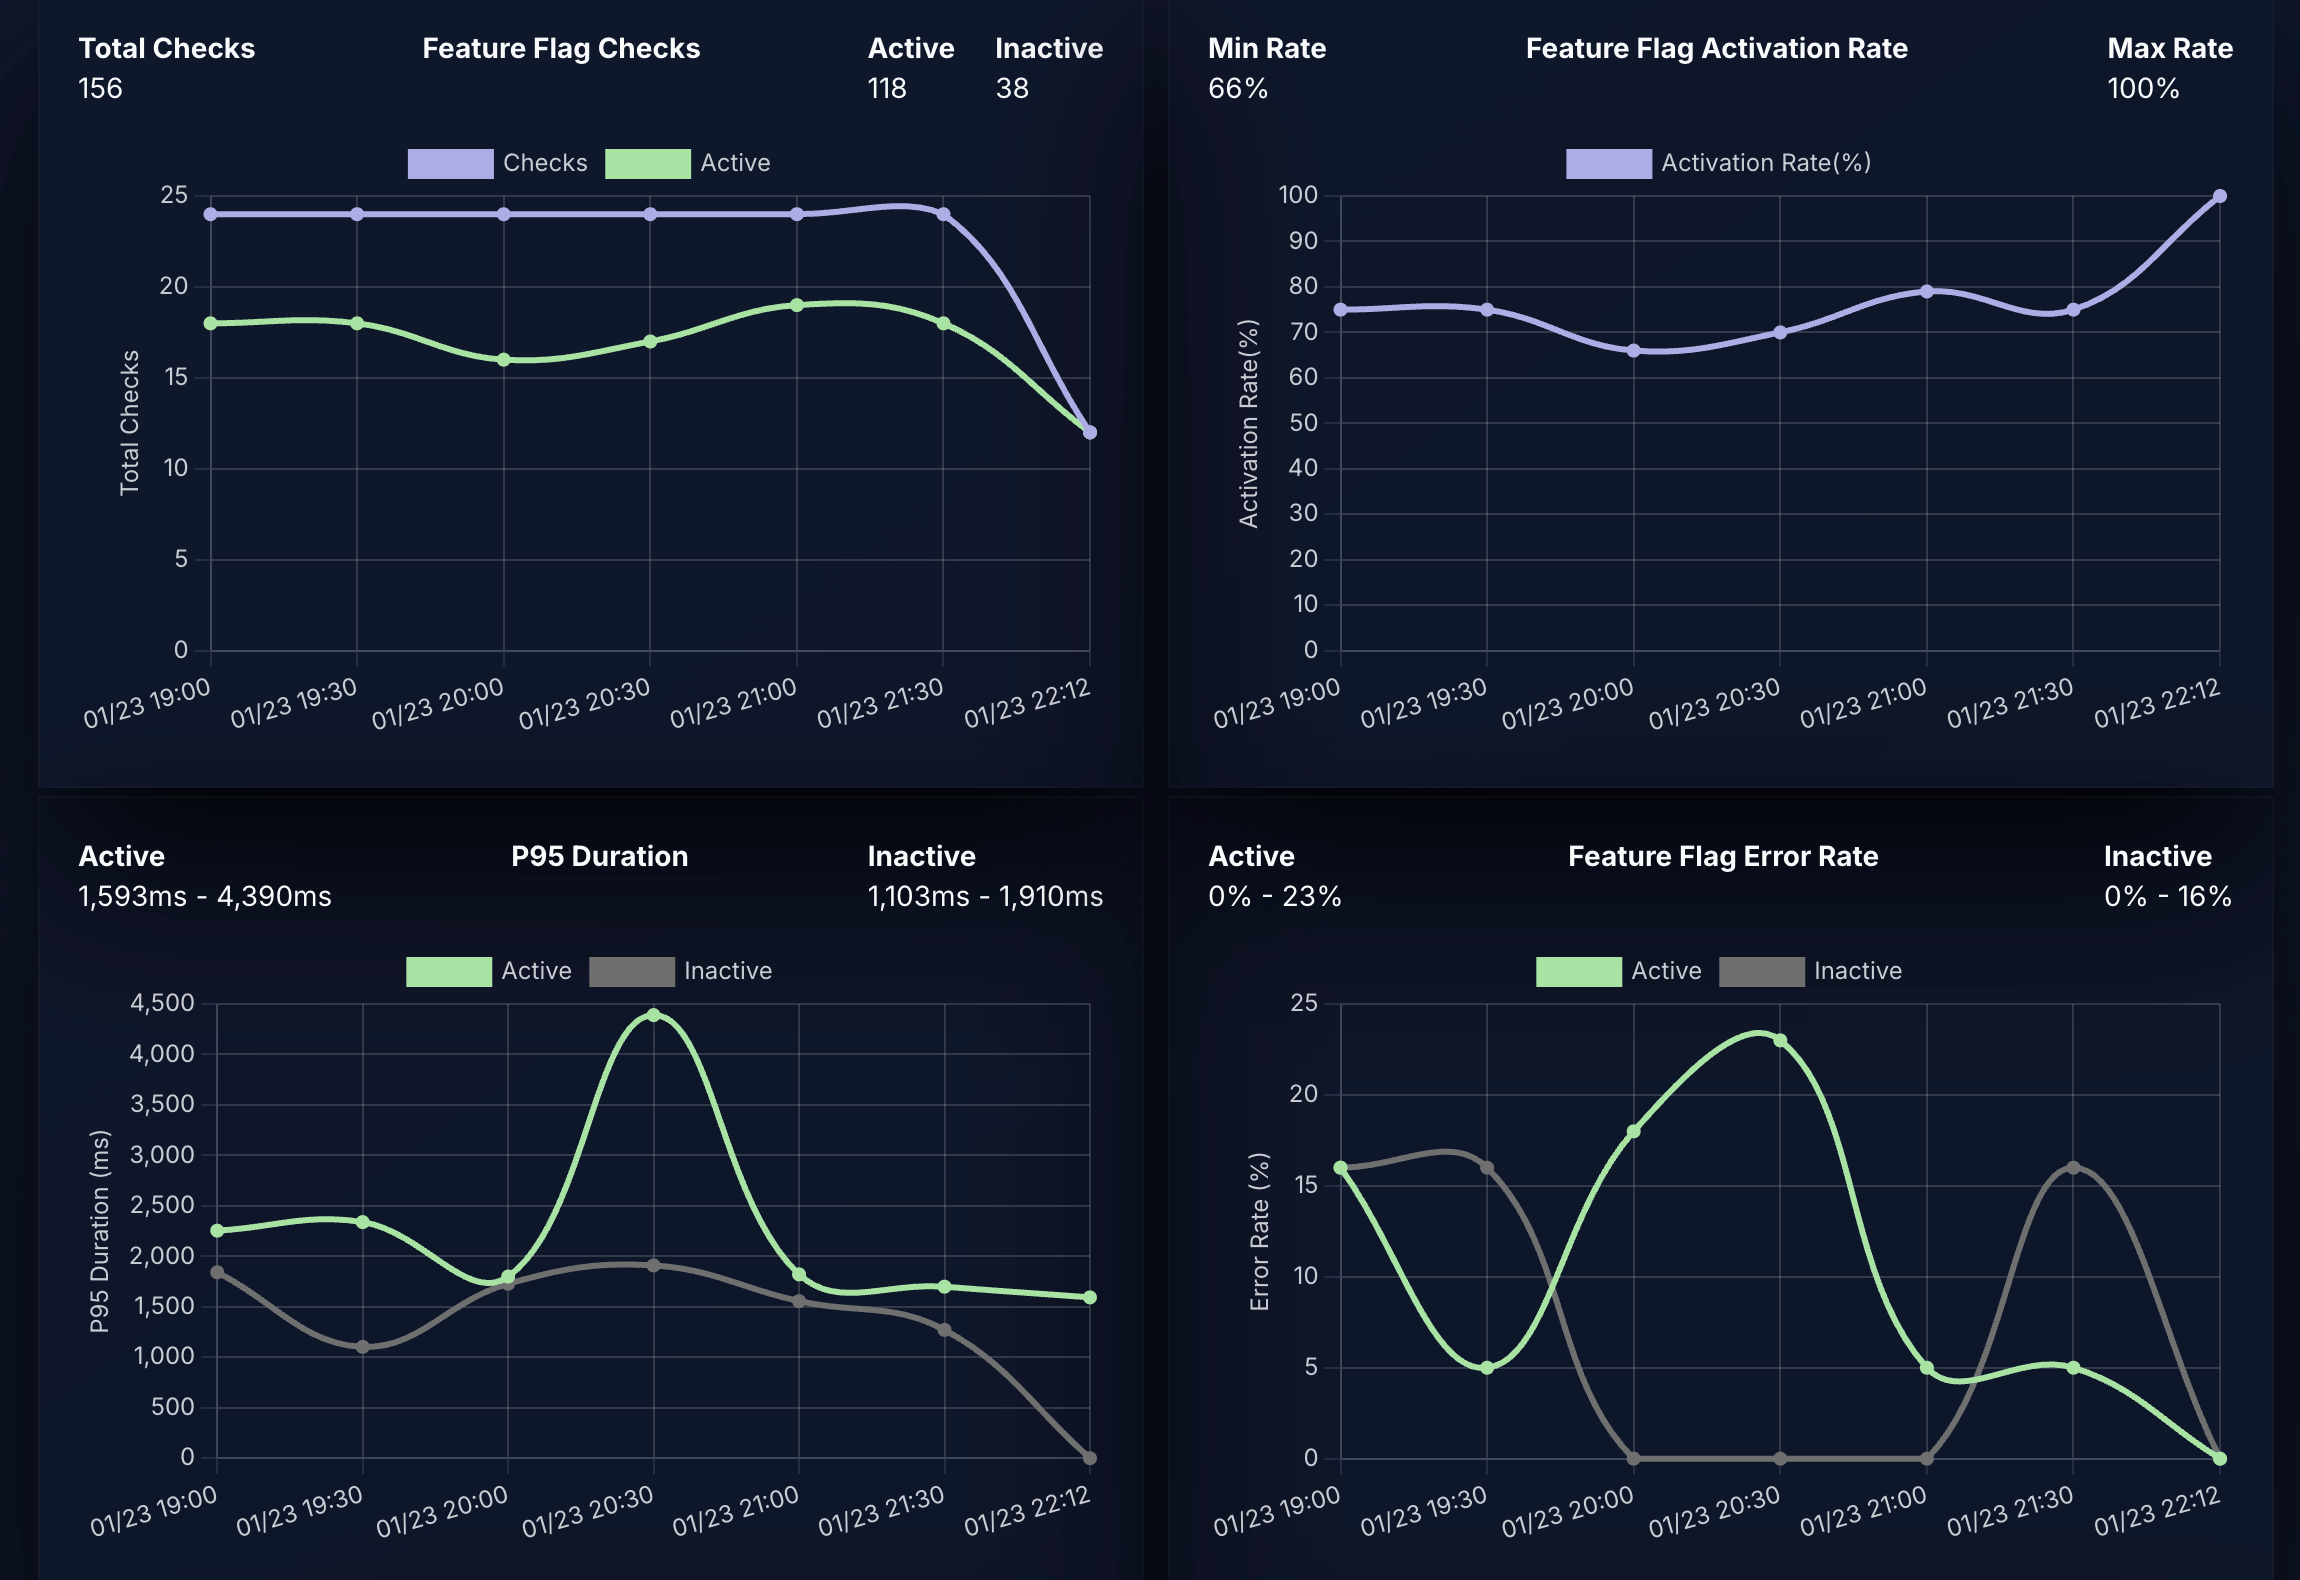
Feature Flag Insights, Not Just Toggles
Feature flags can quietly slow down your app or introduce failures. Laritor tracks every feature flag check and shows how it affects performance and reliability in production, making it easy to debug regressions and validate rollouts.
Trusted in production environments
What Developers Think About Laritor
Straight from the teams using Laritor every day to debug, optimize and monitor their Laravel applications.
“Our queue workers were backing up and alerts were firing late, but we could never pinpoint why. Laritor made the root cause obvious within minutes. We had slow database queries inside certain check evaluators, high queue throughput during peak hours, and scheduled tasks overlapping in ways we didn’t expect. Laritor’s timeline and job insights surfaced all of it at once. We finally had a clear picture of what was slowing down our alerting pipeline.”
Mahesh Chandra
PingMyDB
“ I’m genuinely impressed with the overall experience. The service has been smooth, reliable, and incredibly helpful for our workflow. I also want to especially highlight the support team - they’ve been outstanding. Their responses were quick, clear, and genuinely helpful. They guided me properly through every issue, and I’m honestly super impressed by how supportive and proactive they’ve been throughout the process.”
Awais Khalid
TTW Digital
“Laritor gives me clear visibility into what is happening in production, including exceptions, suspicious requests, and bot scanner activity. With those insights, I can create better WAF rules and keep unwanted traffic properly filtered.”
Adinata
MID Teknologi Digital
Pay as you grow
Predictable pricing with generous limits
Every plan ships with the full feature set. Start for free, then graduate to Pro when you exceed 300K events per month or need more ingestion headroom.
Free
$0
For hobby projects
- 300K events / month
- Unlimited apps, environments, servers, seats
- Unlimited alerts, dashboards, reports
- 14 days of data retention
Pro
From $10
For production workloads
- Everything in Free
- 10 million events / month
- $0.20 per extra 100K events
- 30 days of data retention
- Usage-based cost estimator
- Billing alerts & usage thresholds to avoid surprise charges
Custom
Contact us
High volume · 300M+ events
- Everything in Pro
- Flat monthly rate matched to your usage
- Invoice-based billing and procurement approvals
- Dedicated account manager
- Custom Laritor subdomain
What is an event?
An event is any span that occurs inside your Laravel application. This includes things like requests, database queries, logs, cache operations, outbound HTTP calls, queued jobs, mails and notifications.
For example, if a single request runs 3 database queries, writes 3 log entries and dispatches 1 queued job, that request would consume a total of 8 events.
Your data is protected
Security practices built for sensitive telemetry
Flexible filtering
Strip or hash sensitive attributes before they ever leave your servers.
Redacted data
PII is automatically anonymized in-flight so dashboards stay safe.
Regional storage
Choose the geography that matches your compliance requirements.
Security audits
Regular third-party reviews keep Laritor hardened against new threats.
Encryption in transit
TLS everywhere and rotating credentials protect data as it streams in.
Secure infrastructure
DigitalOcean clusters with MFA, IP restrictions, and least-privilege access.
Still have questions?
We answer within 24 hours
Browse the FAQ or email [email protected] and someone from the team will help you plan the rollout.
How fast can I start monitoring?
+
How fast can I start monitoring?
Install the Laritor ingest package via Composer, drop in your endpoint and key, and you are streaming events in under 30 seconds.
What counts as an event?
+
What counts as an event?
Any span inside your Laravel app—requests, queries, cache hits, queued jobs, mails, notifications, logs, and more.
Can I send alerts to my existing tools?
+
Can I send alerts to my existing tools?
Yes. Email, Slack, Discord, Microsoft Teams, and webhook targets are all supported out of the box.
Is Laritor an APM or observability tool for Laravel?
+
Is Laritor an APM or observability tool for Laravel?
Laritor is a Laravel-focused observability and performance monitoring platform. It combines APM-style tracing with logs, metrics, alerts, and AI insights so teams can debug faster.
Can I run Laritor in parallel with other monitoring tools?
+
Can I run Laritor in parallel with other monitoring tools?
Yes. Laritor can run alongside other monitoring tools without conflicts.
How much performance impact does Laritor have on my application?
+
How much performance impact does Laritor have on my application?
Laritor’s client package is designed to use minimal performance footprint and is estimated to add less than 10ms of overhead.
Ready when you are
Get full-stack visibility across every Laravel app
Create your Laritor account, invite your team, and start streaming performance data today. Unlimited users, alerts, dashboards, and reports are included from day one.