
Focus on one integration
Search for an API host or endpoint to inspect calls to the service you are investigating. Compare durations across the recorded executions.
Laravel outbound HTTP monitoring
Laritor is a performance monitoring and issue tracking tool for Laravel. Monitor the HTTP calls your app makes to external services. See their URLs, status codes, and durations, inspect recorded responses, and open the request or job behind a slow or failed call.
Free trial: 300K events · Unlimited apps and users
Find slow dependenciesInspect external-call duration and volume.
Understand API responsesStatus codes and optional payload details.
Trace the affected workflowOpen the request, job, or command behind it.
External calls from your Laravel app
An incoming request arrives at your app from a browser or API client. An outbound request leaves your app to call another service, such as a payment provider, a data API, or another application.
Those external calls can delay a response, slow a background job, or return data your code cannot use. Laritor connects recorded calls to the application work that made them so you can investigate their impact.
Read the outbound request guideSlow outbound requests
A slow external service can hold up your app even when your database queries and Laravel code are fast. Use the slow requests view or a duration threshold to find calls worth investigating.
Search by URL, narrow the date range, and check the originating request or job. A successful status code does not mean the call was quick.
Explore outbound request filters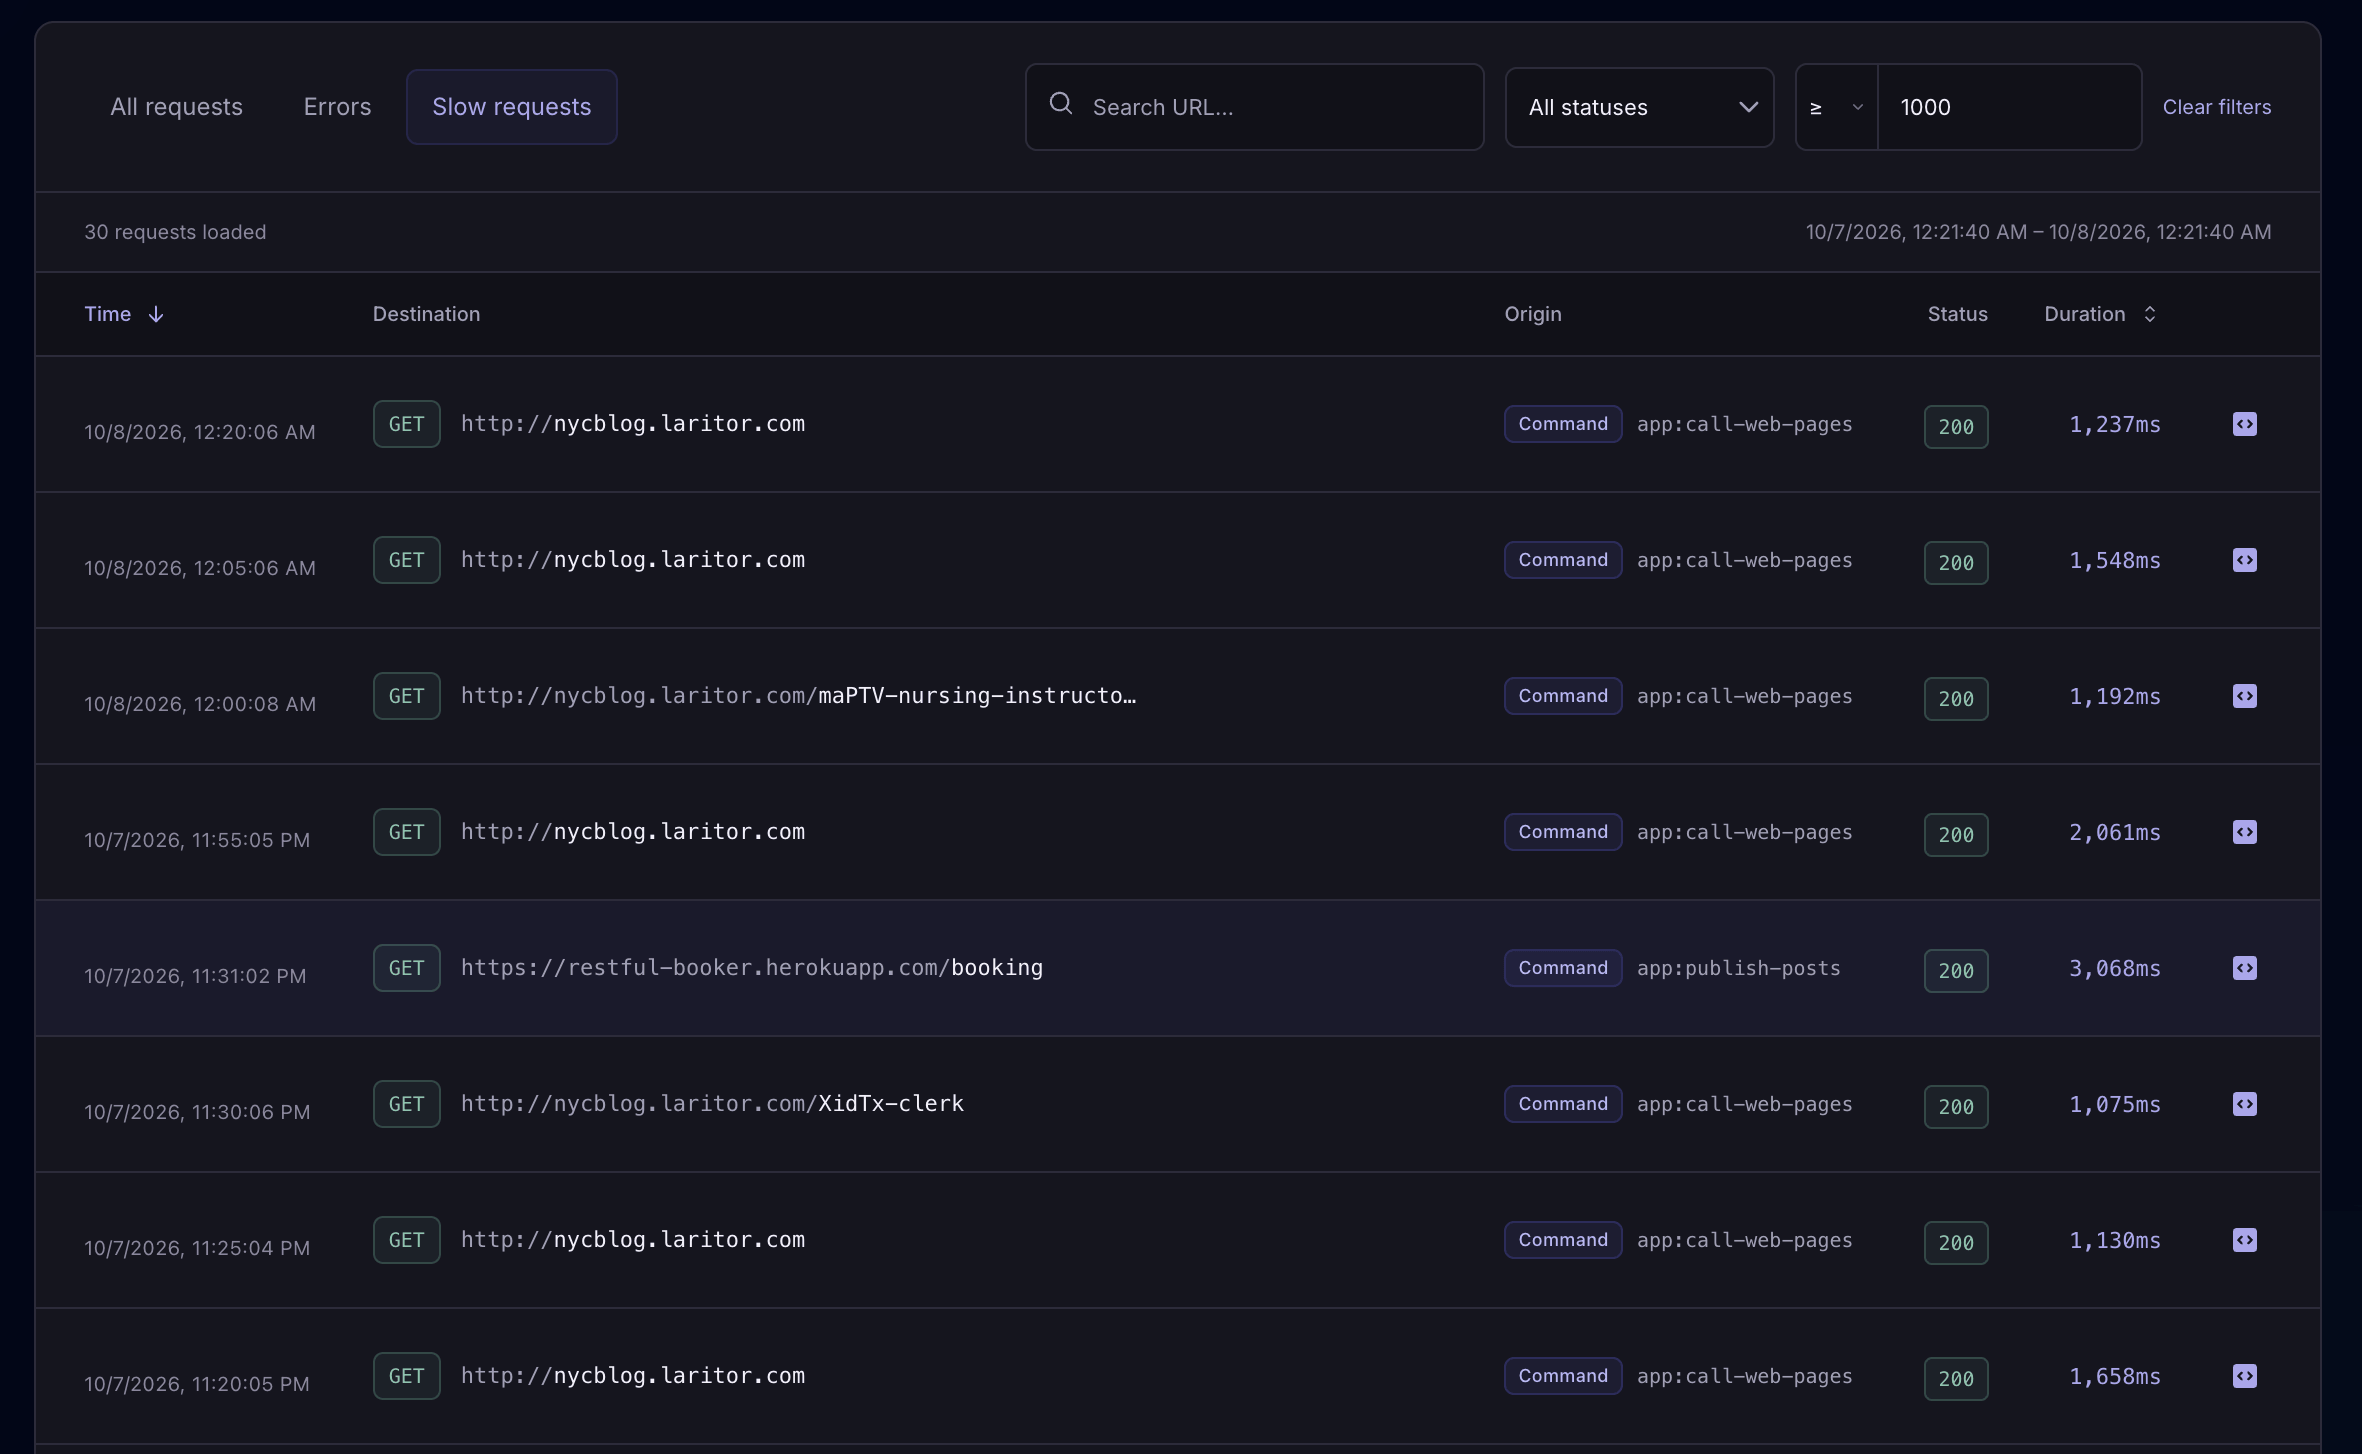
Search for an API host or endpoint to inspect calls to the service you are investigating. Compare durations across the recorded executions.
Open the originating run to see whether it makes the same external call repeatedly. Decide whether batching or reusing a result would reduce waiting.
Use the evidence to assess caching, a timeout, fallback behavior, or moving work into a job. Test the effect on the workflow your app needs to complete.
Error and unexpected responses
Filter outbound requests to errors or a status code, then inspect the destination, time, duration, and available response details. Follow the originating execution to see how your app handled the result.
If a timeout or another call failure produces an exception, investigate its stack trace and recorded context too.
Explore exception trackingInspect the endpoint and available request details. Look for missing authentication, invalid input, an incorrect URL, or a rate limit such as a 429 response.
Find the affected endpoint and when calls failed. Inspect the available response details and originating run to understand how the service error affected your app.
A 200 response can still contain data your code cannot use. Check the content type and recorded body when enabled, then follow what your code did with the response.
An HTTP error response and an exception are different signals. Your recording mode determines which occurrences and related calls Laritor retains.
Request and response details
Open the captured payload view to inspect the request and response fields your client records. Check headers such as content type, or review a recorded body to understand an unexpected result.
Control headers and bodies separately. Body recording is disabled by default, and recorded data passes through your redaction settings before it leaves your app.
Configure payload recording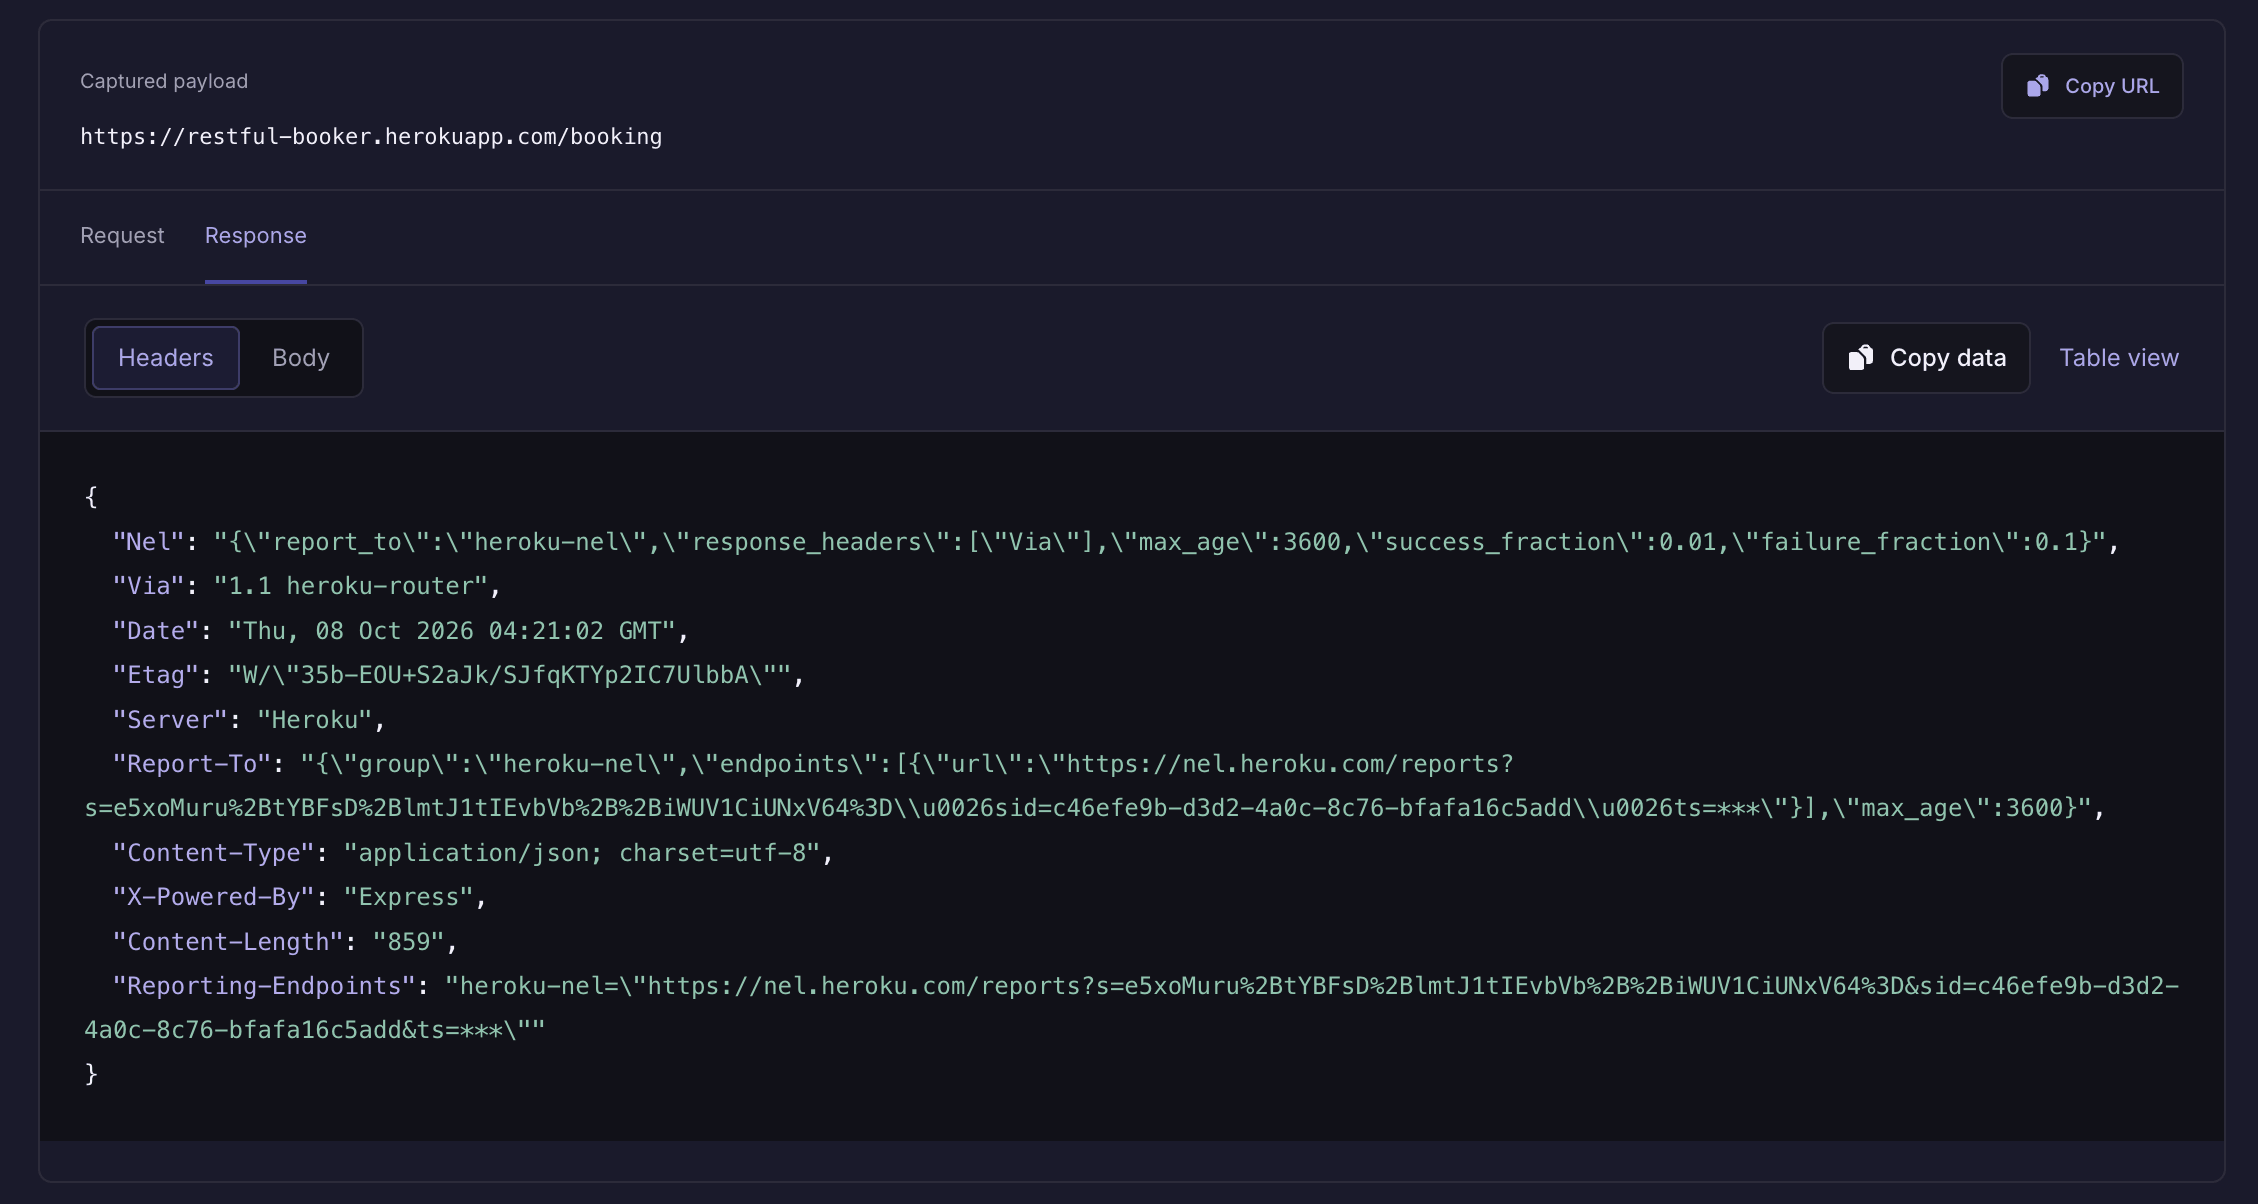
Inspect the method and URL to check whether your app called the intended endpoint. Use the recorded time and status to identify the execution you need.
Inspect the content type and available body when enabled. An HTML error page can explain why code expecting JSON could not read the result.
Choose which payload fields to send. Redact credentials and personal information while preserving the context that helps explain the failure.
The execution behind an API call
An outbound call is one step in a larger workflow. Open its originating request, job, command, or scheduled task to inspect the recorded queries, logs, exceptions, and other events around it.
See what happened before the call and how your app used the response. That helps you distinguish a service problem from code that handled the result incorrectly.
Example: an external call inside a web request
Debug with Laritor MCP
When an external call leads to an exception, connect your coding agent through Laritor MCP. It can retrieve the exception details and recorded execution timeline, then use the API calls, queries, logs, and other events with your repository to investigate the cause and work on a fix.
Connect Laritor MCP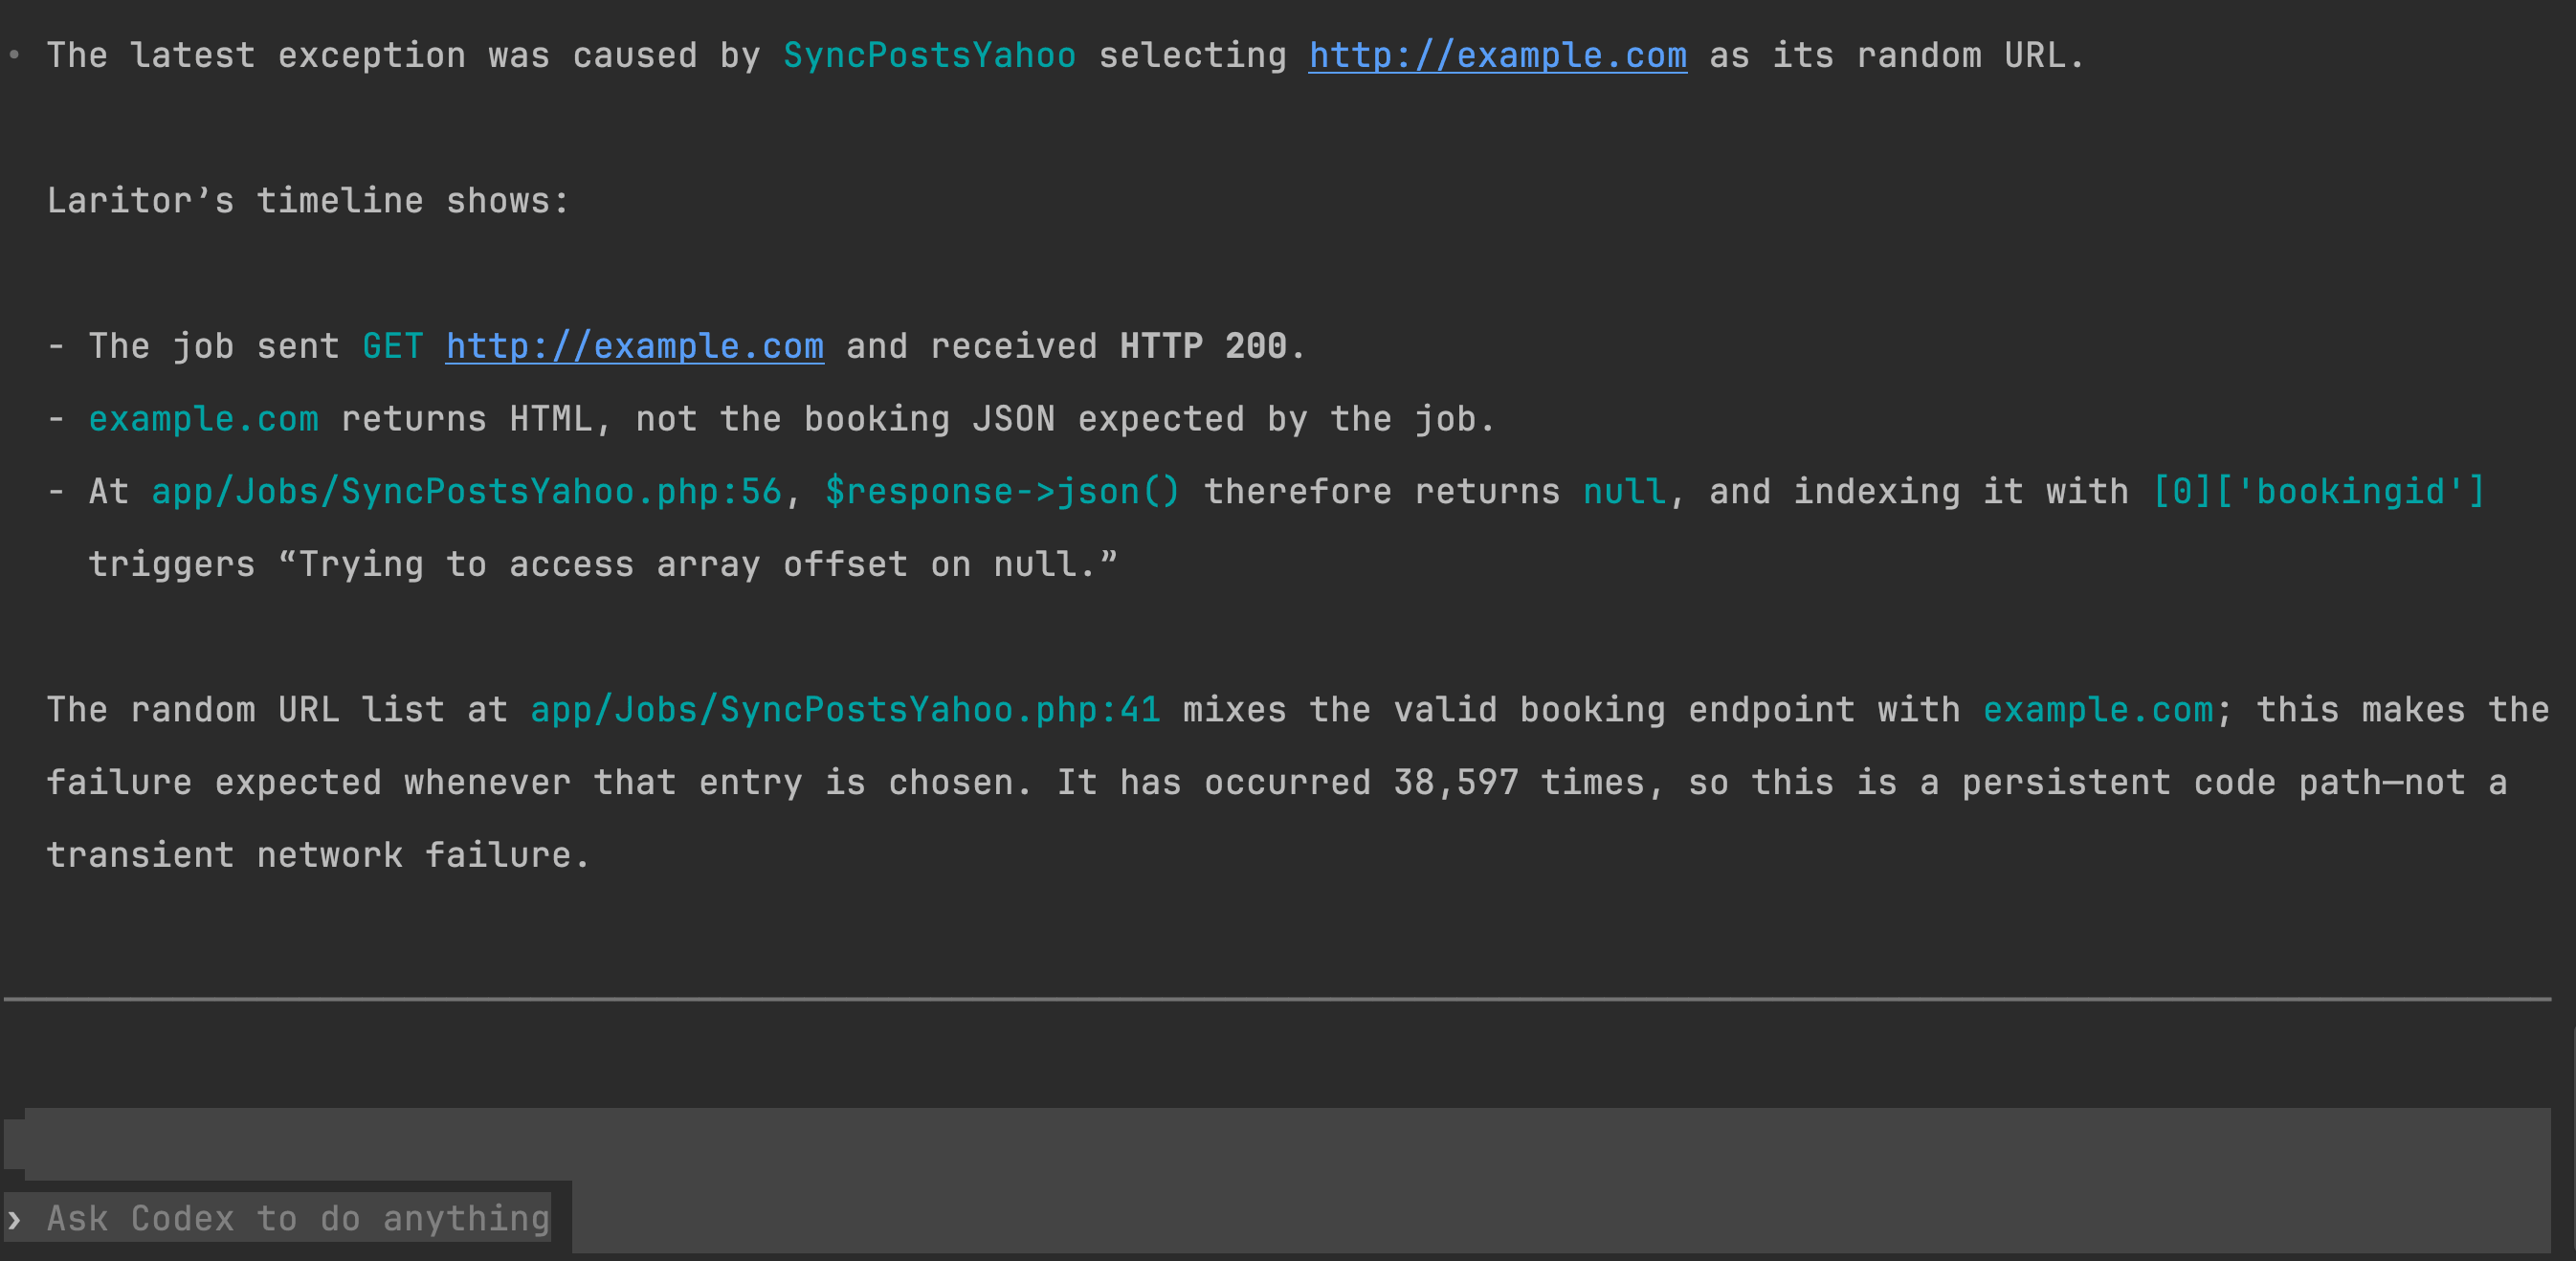
Use the recorded exception and related events to investigate the conditions behind the failure, alongside the code in your project.
In this example, the agent connects an unexpected response to a missing value used by a job. It follows what happened instead of relying on the exception message alone.
External API performance over time
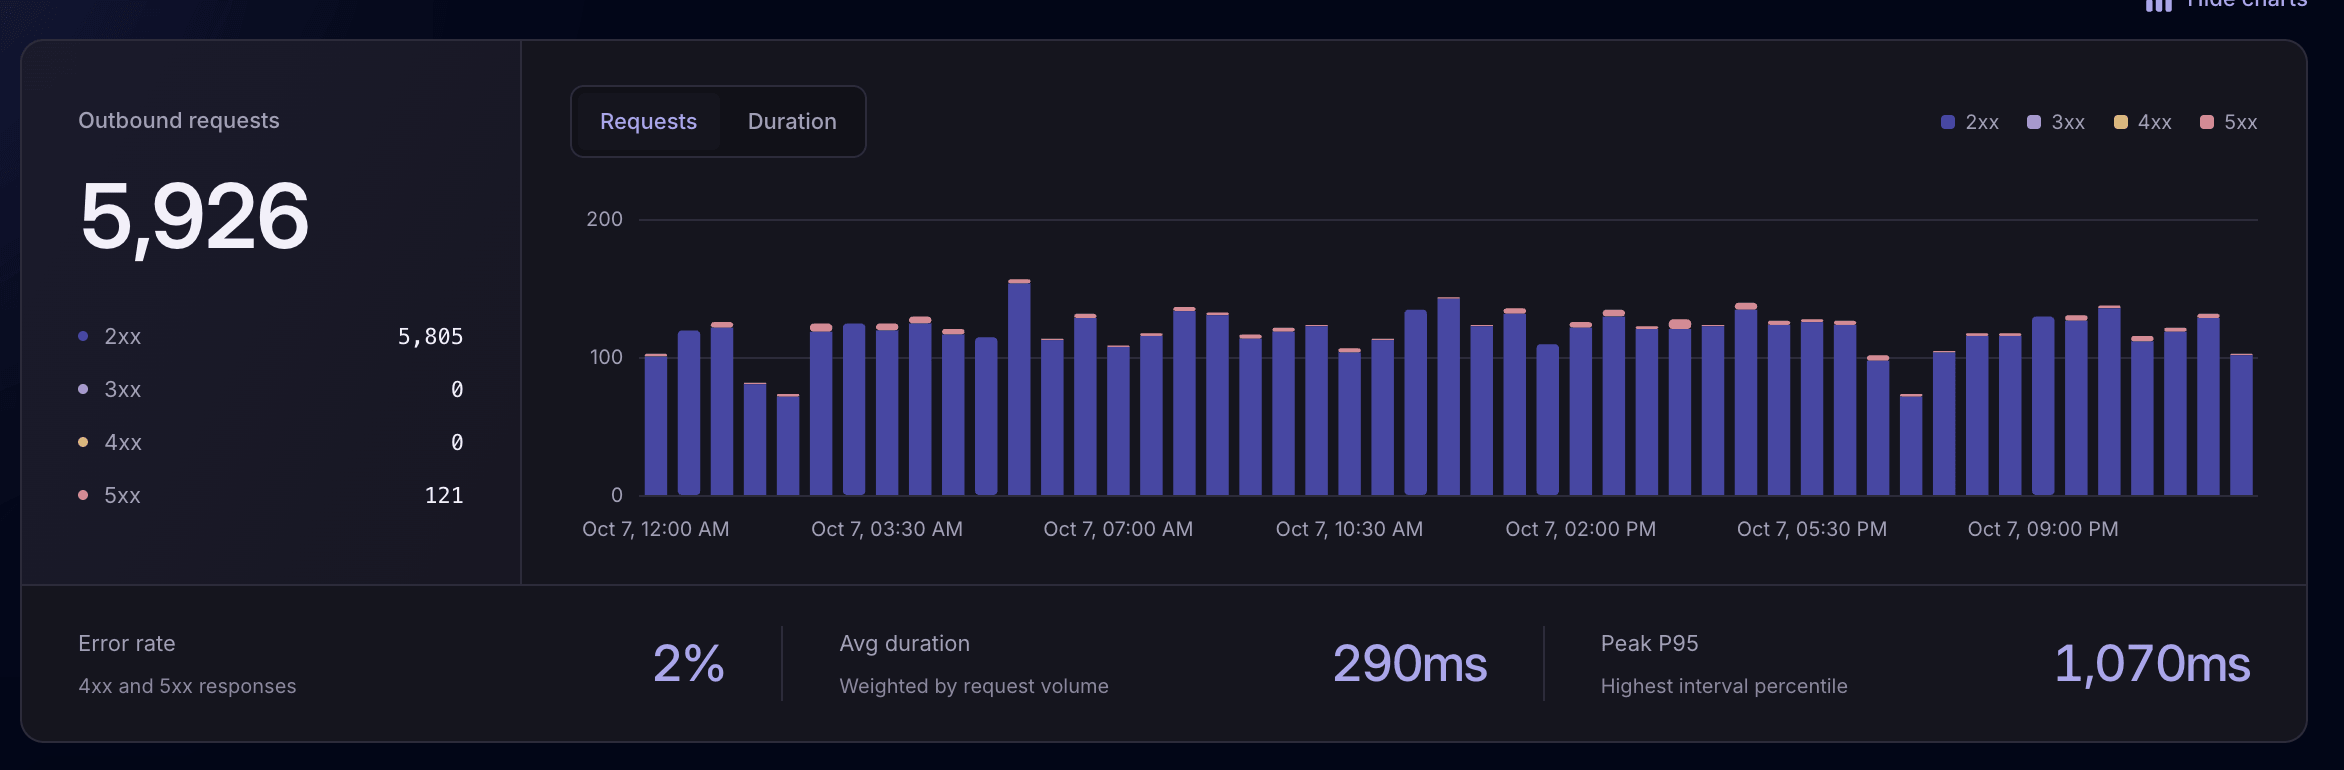
Use Laritor’s outbound request metrics to spot changes in external traffic, HTTP errors, and timing. Narrow the period around a change, then inspect the calls and application workflows behind it.
After an improvement, compare the affected workflow’s call count and durations. Take changes in traffic and workload into account when assessing the result.
See outbound request volume over time and the mix of 2xx, 3xx, 4xx, and 5xx responses. Investigate changes in call volume or error responses.
The metrics card shows the share of recorded calls with 4xx or 5xx responses. Inspect individual calls to understand the errors behind a change.
Check the request-volume-weighted average and the slower end of timings. Peak P95 is the highest interval percentile in the selected period, rather than one overall percentile.
Metrics reflect the calls you send to Laritor. Filtered modes show retained occurrences; full observability also includes successful activity for a broader picture.
Use Laritor how you want
Start with exceptions, include other detected issues, or record successful activity too. Each retained occurrence includes its related outbound requests and other events, subject to your filters.
Compare modes and estimate your costKeep outbound calls and related events when their request, job, command, or task contains an exception. Investigate the external activity that led to the failure.
An HTTP error response alone is not necessarily an exception.
Record occurrences with detected problems, such as a failed job or slow request. Inspect the outbound calls and other events from each retained occurrence.
Focus on the application activity with detected issues.
Record successful activity as well as problems. Monitor external-call volume and timings, and compare healthy executions with slow or unsuccessful ones.
Use this for broader API performance monitoring.
Outbound calls and other related events count toward usage. Paid plans start at $20/month with 20 million events included. Sending fewer events can reduce additional charges.
Payload and privacy controls
Decide which outbound request and response fields leave your app. Customize redaction for tokens, sensitive strings, and private fields, and filter destinations or calls you do not need to record.
Explore redaction settingsControl outbound request and response headers and bodies separately. Body recording is optional and disabled by default.
Use recordOutboundRequest to decide whether a call should be sent based on its URL, status code, and duration.
Mask or remove sensitive values in the client before data leaves your servers. Keep useful context without sending unnecessary private information.
Common questions
External API monitoring, slow calls, recorded payloads, AI debugging, and privacy.
An outbound request is an HTTP call your Laravel application makes to another service, such as a payment API, a data provider, or another application. It differs from an incoming request, which a browser or API client sends to your app. Laritor helps you inspect recorded outbound calls and connect them to the application work that made them.
Install Laritor’s Laravel client, connect your application, and choose what to record. The outbound requests view shows recorded calls with their method, destination URL, status, duration, time, and originating execution. Use URL, date, status, and duration filters to investigate specific endpoints or problems.
Use the slow requests view or filter by a duration threshold in milliseconds. Search for a destination URL and narrow the date range to focus on one integration. Open the originating request, job, command, or scheduled task to see how the external call fits into the full execution.
Laritor provides the recorded status code, endpoint, timing, originating execution, and available request or response details. These help you investigate invalid input, authentication problems, rate limits, and errors returned by another service. If a call leads to an exception, inspect the exception and its related events. The details available depend on your recording and privacy settings.
Yes, when those fields are included by your client settings. Laritor’s captured payload view lets you inspect recorded request and response headers and bodies. Body recording is disabled by default. Enable only the fields you need and configure redaction before sending sensitive information.
Exceptions-only mode retains occurrences that contain an exception and their related events. An HTTP error response does not necessarily mean an exception was captured. Use the recording mode and filters that match the activity you want to investigate; full observability also keeps successful activity for broader external API monitoring.
Yes. Recorded outbound calls link to the originating HTTP request, queued job, Artisan command, or scheduled task. This lets you investigate external integrations in background processing as well as user-facing requests.
Connect your agent through Laritor MCP. It can retrieve an exception’s details and recorded execution timeline, including outbound requests and other events, then use that context with your repository to investigate the cause and work on a fix. Available payload details depend on your recording settings.
Customize the Laravel client to redact sensitive strings and fields before data leaves your app. Control outbound request headers, request bodies, response headers, and response bodies separately. You can also filter unwanted destinations or calls with recordOutboundRequest. Keep the debugging context you need while excluding information your application should not send.
The error-rate card measures recorded calls with 4xx and 5xx responses. Peak P95 shows the highest interval P95 duration in the selected period, rather than a single percentile across all calls in the period. These metrics reflect the activity sent to Laritor, so recording modes and custom filters affect the picture you see.
Install in under 1 minute
Install Laritor’s Laravel package, connect your app, and choose what to record. Find slow calls, inspect responses, and follow the application work behind API failures.
Free trial: 300K events · Unlimited apps and users