
Check the exit code
An exit code of 0 means the command reported success. A non-zero code signals a failure. Open the run to see its details and investigate.
Laravel Artisan command monitoring
Laritor is a performance monitoring and issue tracking tool for Laravel. It records your Artisan commands, how long they take, and whether they succeed or fail. Inspect the queries, logs, and API calls behind each recorded run to find the cause of a slowdown or failure.
Free trial: 300K events · Unlimited apps and users
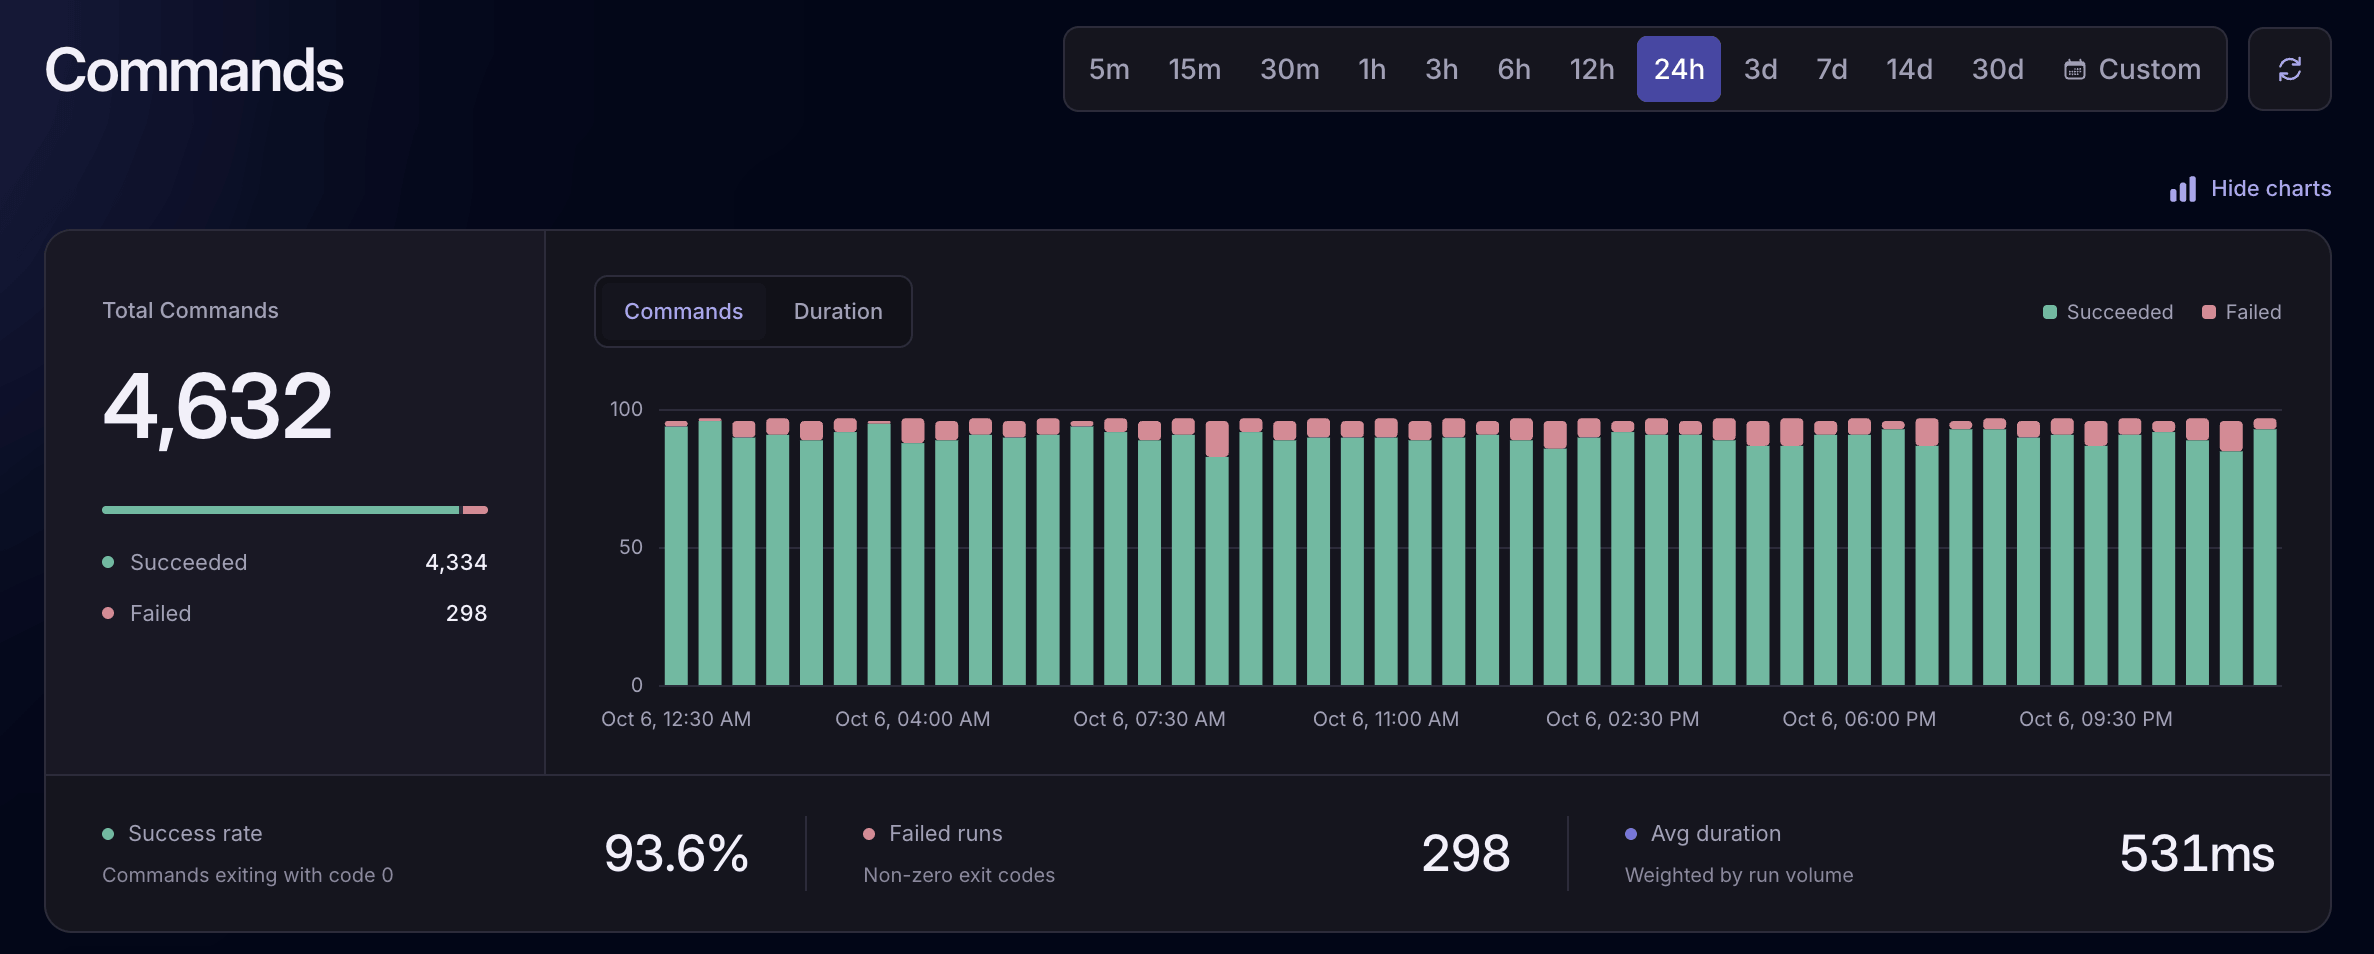
Check run outcomesSee successful and failed executions.
Find slow operationsSee where a command spends its time.
Debug with contextInspect related events and console output.
Run history and failures
Imports, backups, and reports can fail while your website still looks fine. Laritor helps you check the recorded runs of commands executed manually or through Laravel’s scheduler, then open a run to find out what happened.
Explore command monitoringAn exit code of 0 means the command reported success. A non-zero code signals a failure. Open the run to see its details and investigate.
Search by command name and filter by date or duration. Find a particular import, backup, or report run and check when it started and how long it took.
If a command throws an exception, see the error message, file, line, and stack trace. Follow its related events to understand what led to the failure.
Command execution timeline
For each recorded run, Laritor puts its queries, logs, API calls, and other events in order. See the time spent starting Laravel and executing the command, then inspect the operations behind the delay.
Explore command details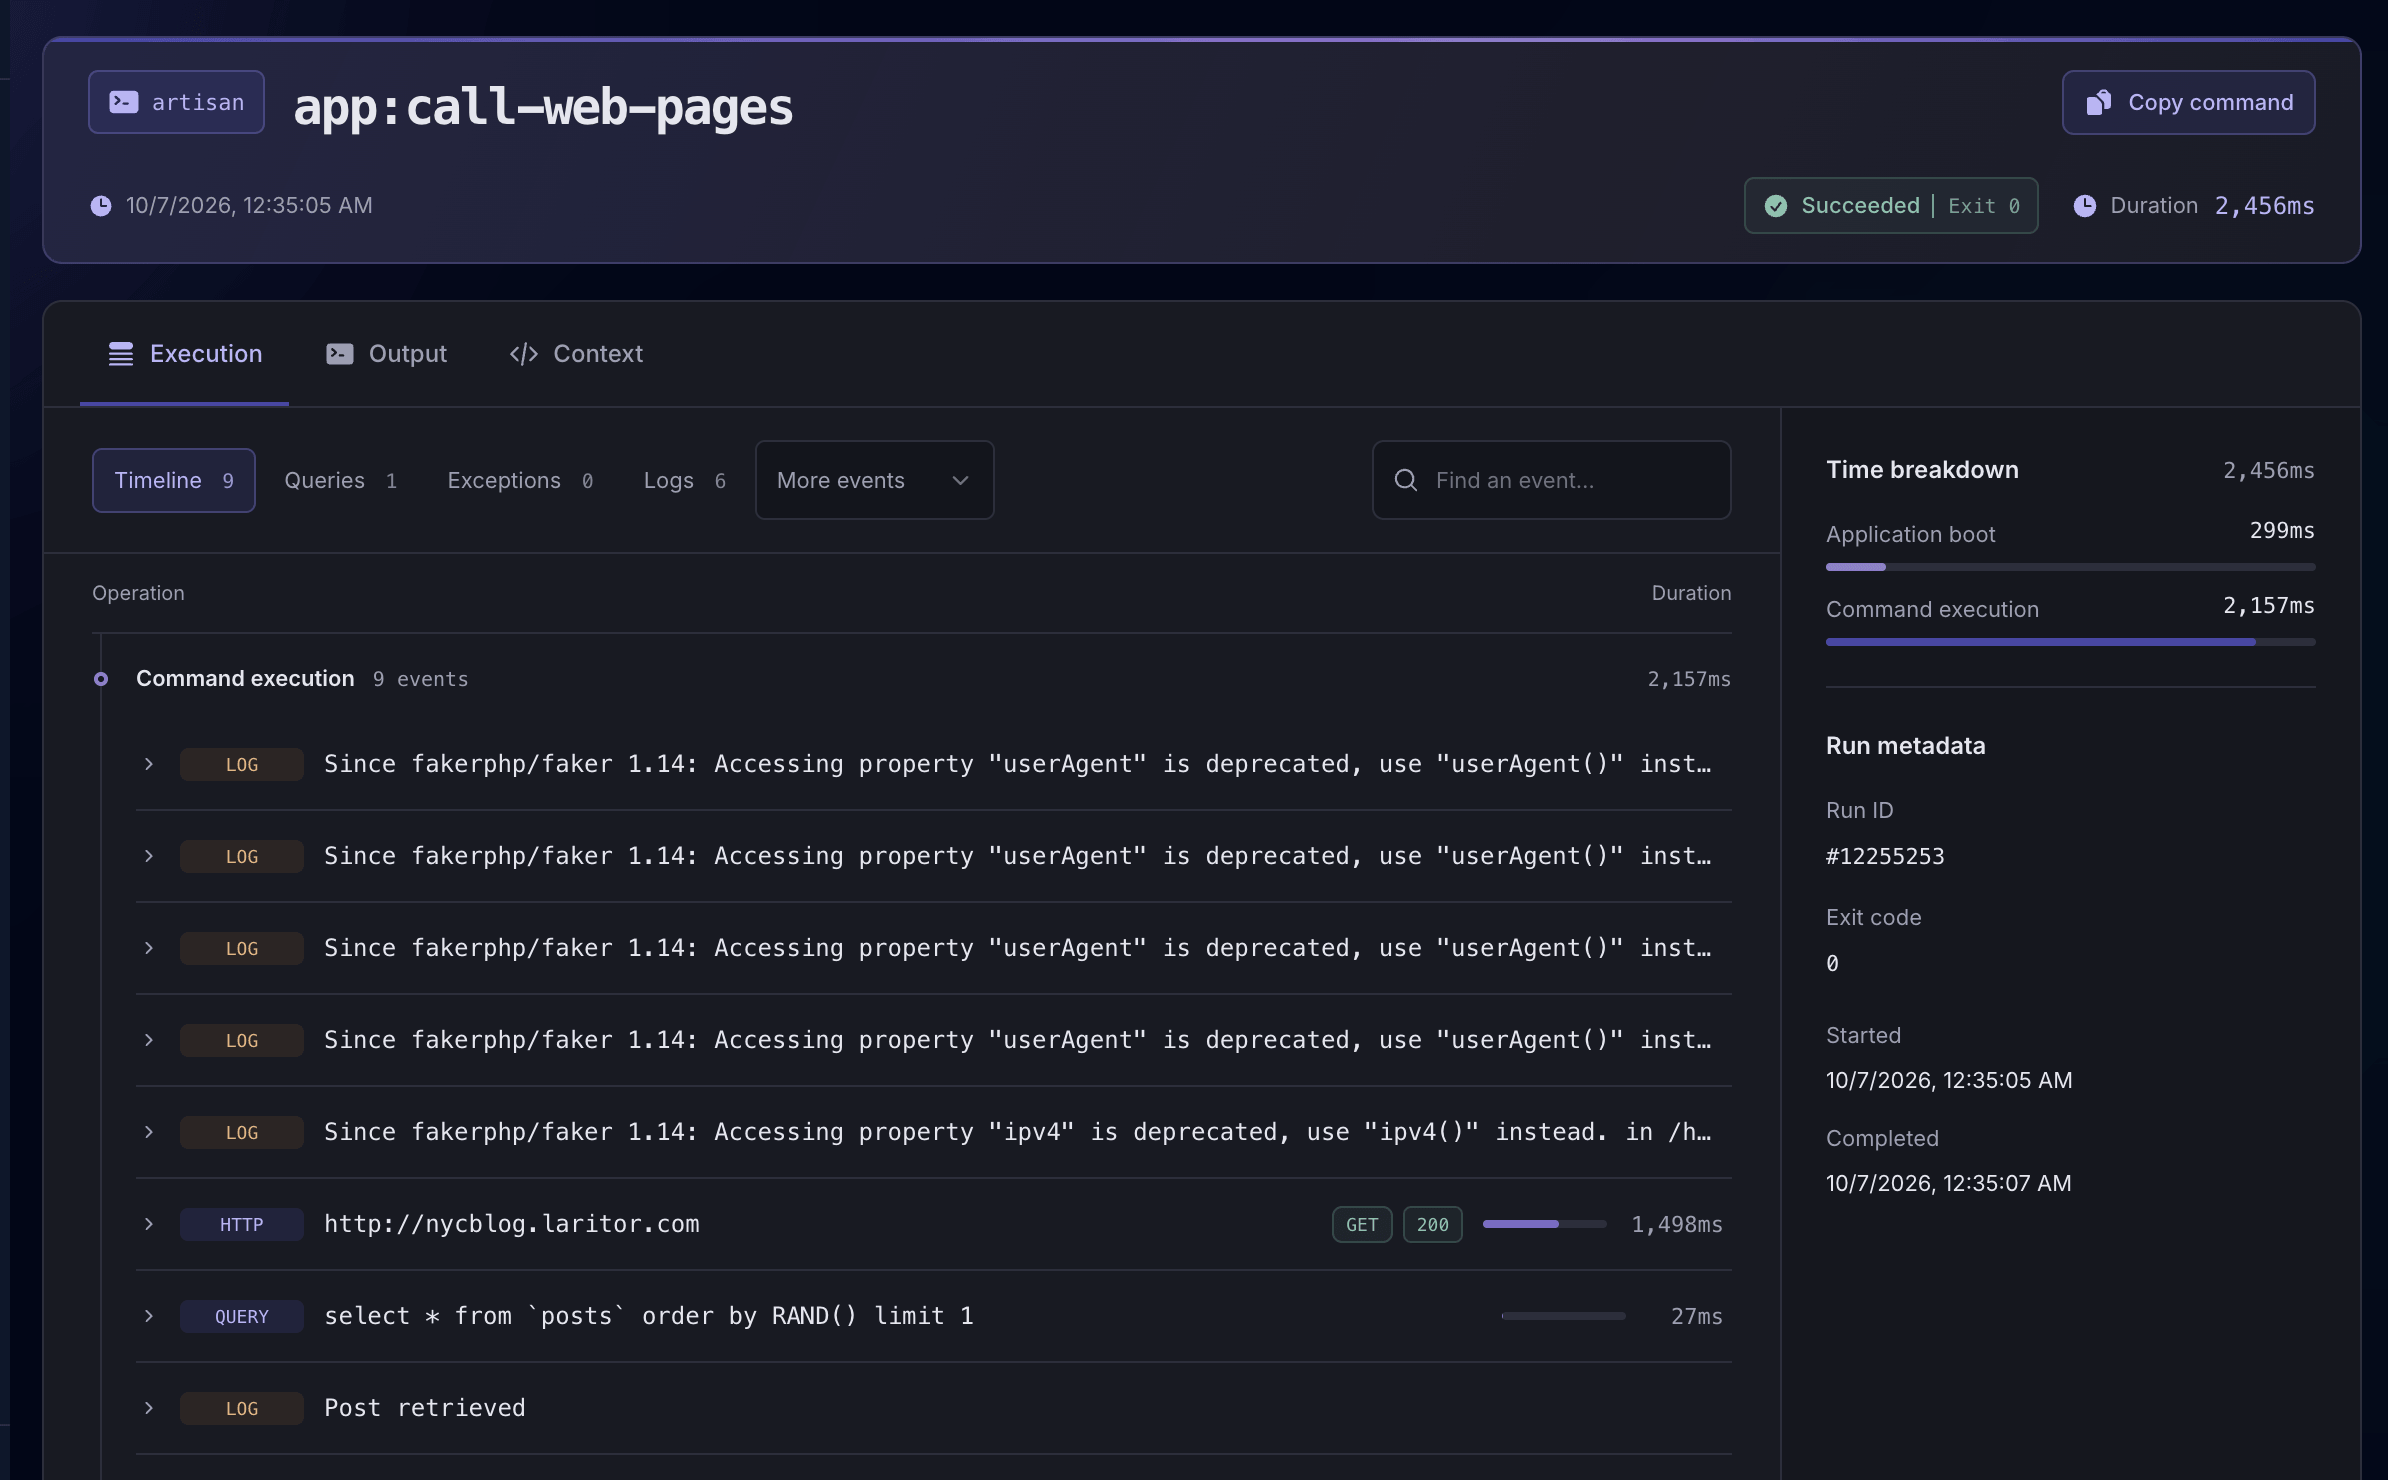
Inspect the queries a command ran and how long they took. Use the details to decide where to improve a query, add an index, or reduce repeated work.
See the duration and response status of external API calls. Find out whether a command is waiting on another service or receiving an error.
Inspect dispatched jobs, cache operations, mail, and notifications alongside logs. Check which steps ran before the command finished or failed.
Console output
See what a command printed while it was running, even after it has finished. Search its output, focus on error messages, or copy it to share with a teammate.
Enable output recording on a command with the SendOutputToLaritor trait. Laritor then captures its console messages alongside the run’s other events.
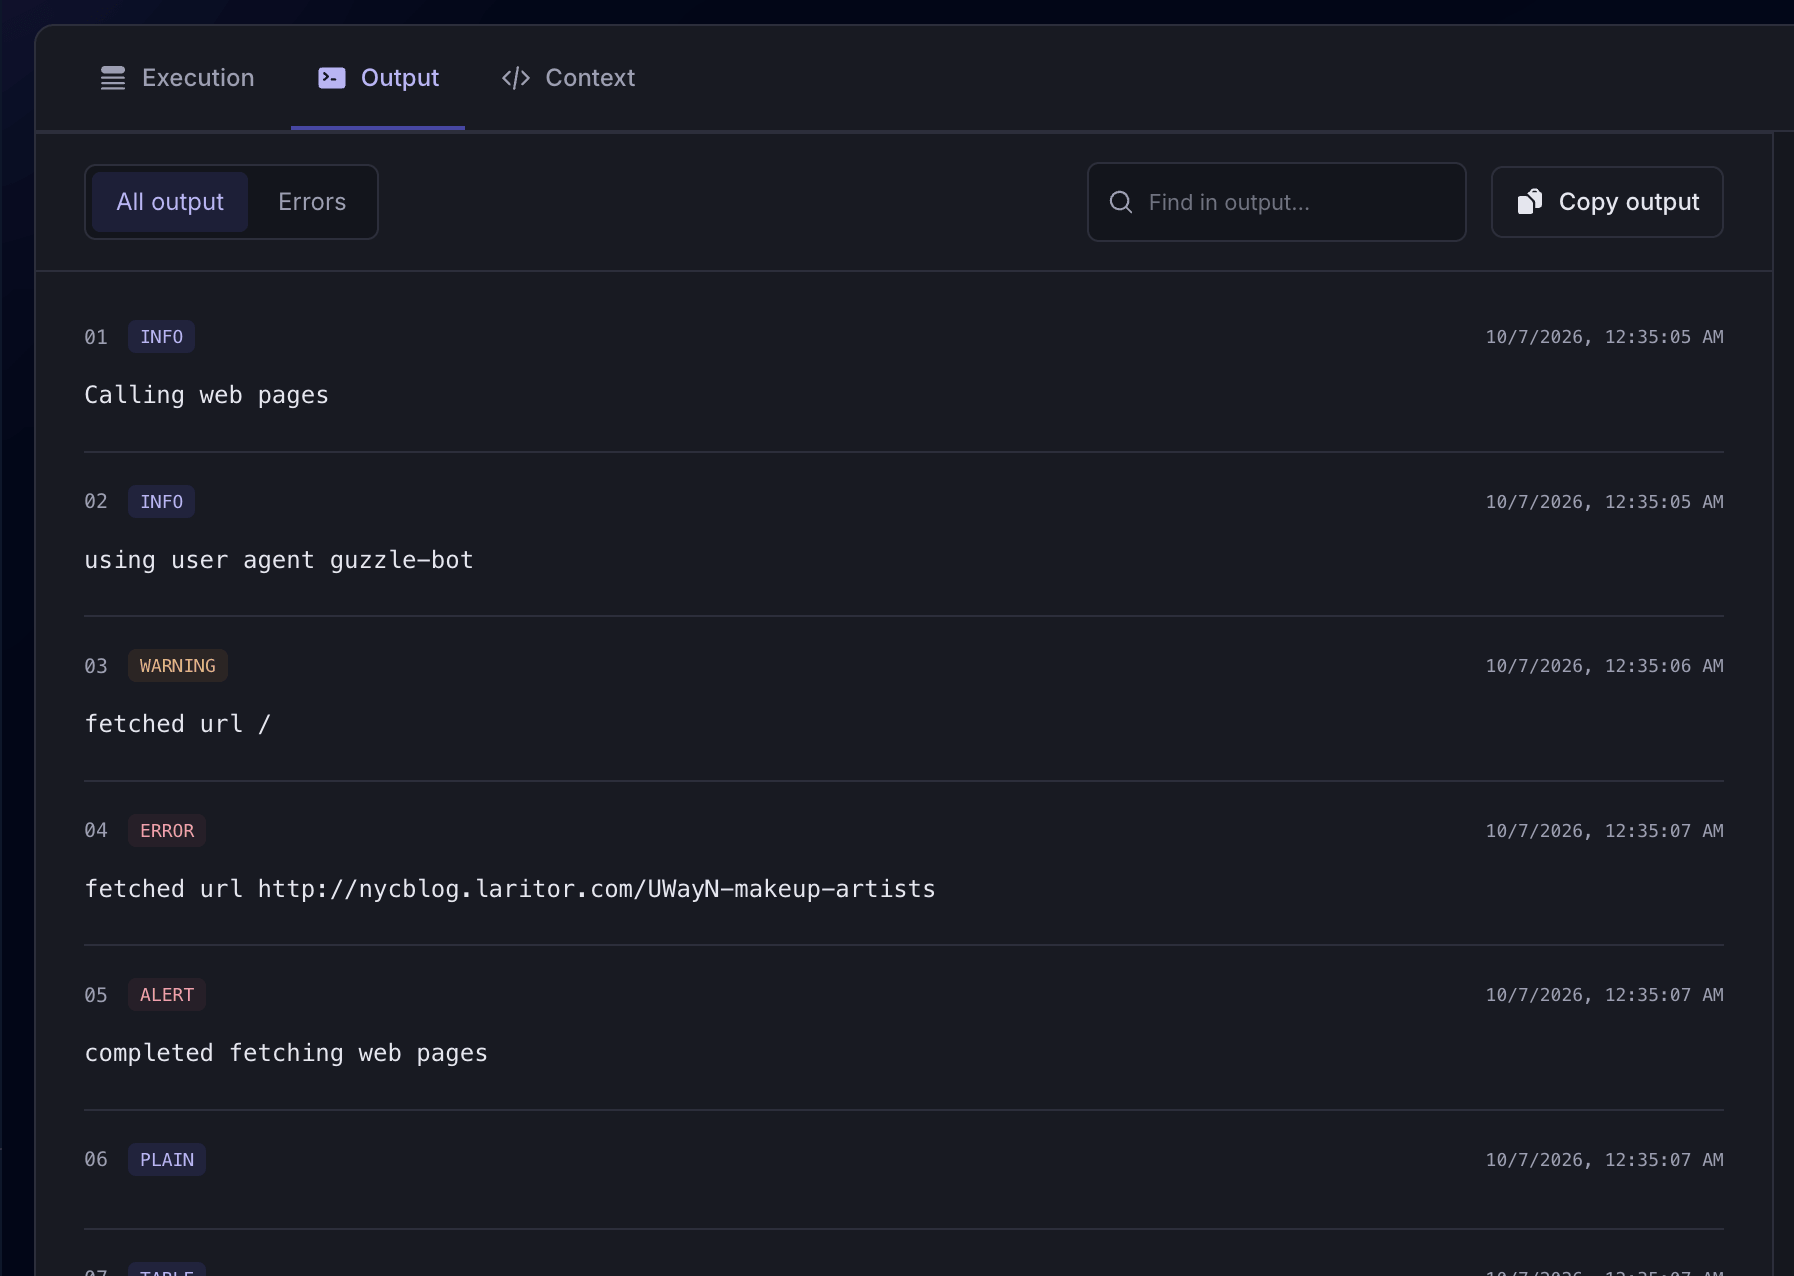
Search and read captured console messages.
View screenshotDebug with Laritor MCP
Connect your AI coding agent to Laritor’s MCP server. When a command throws an exception, your agent can retrieve its stack trace and recorded command timeline, then use that context with your code to investigate the cause and implement a fix.
Connect Laritor MCP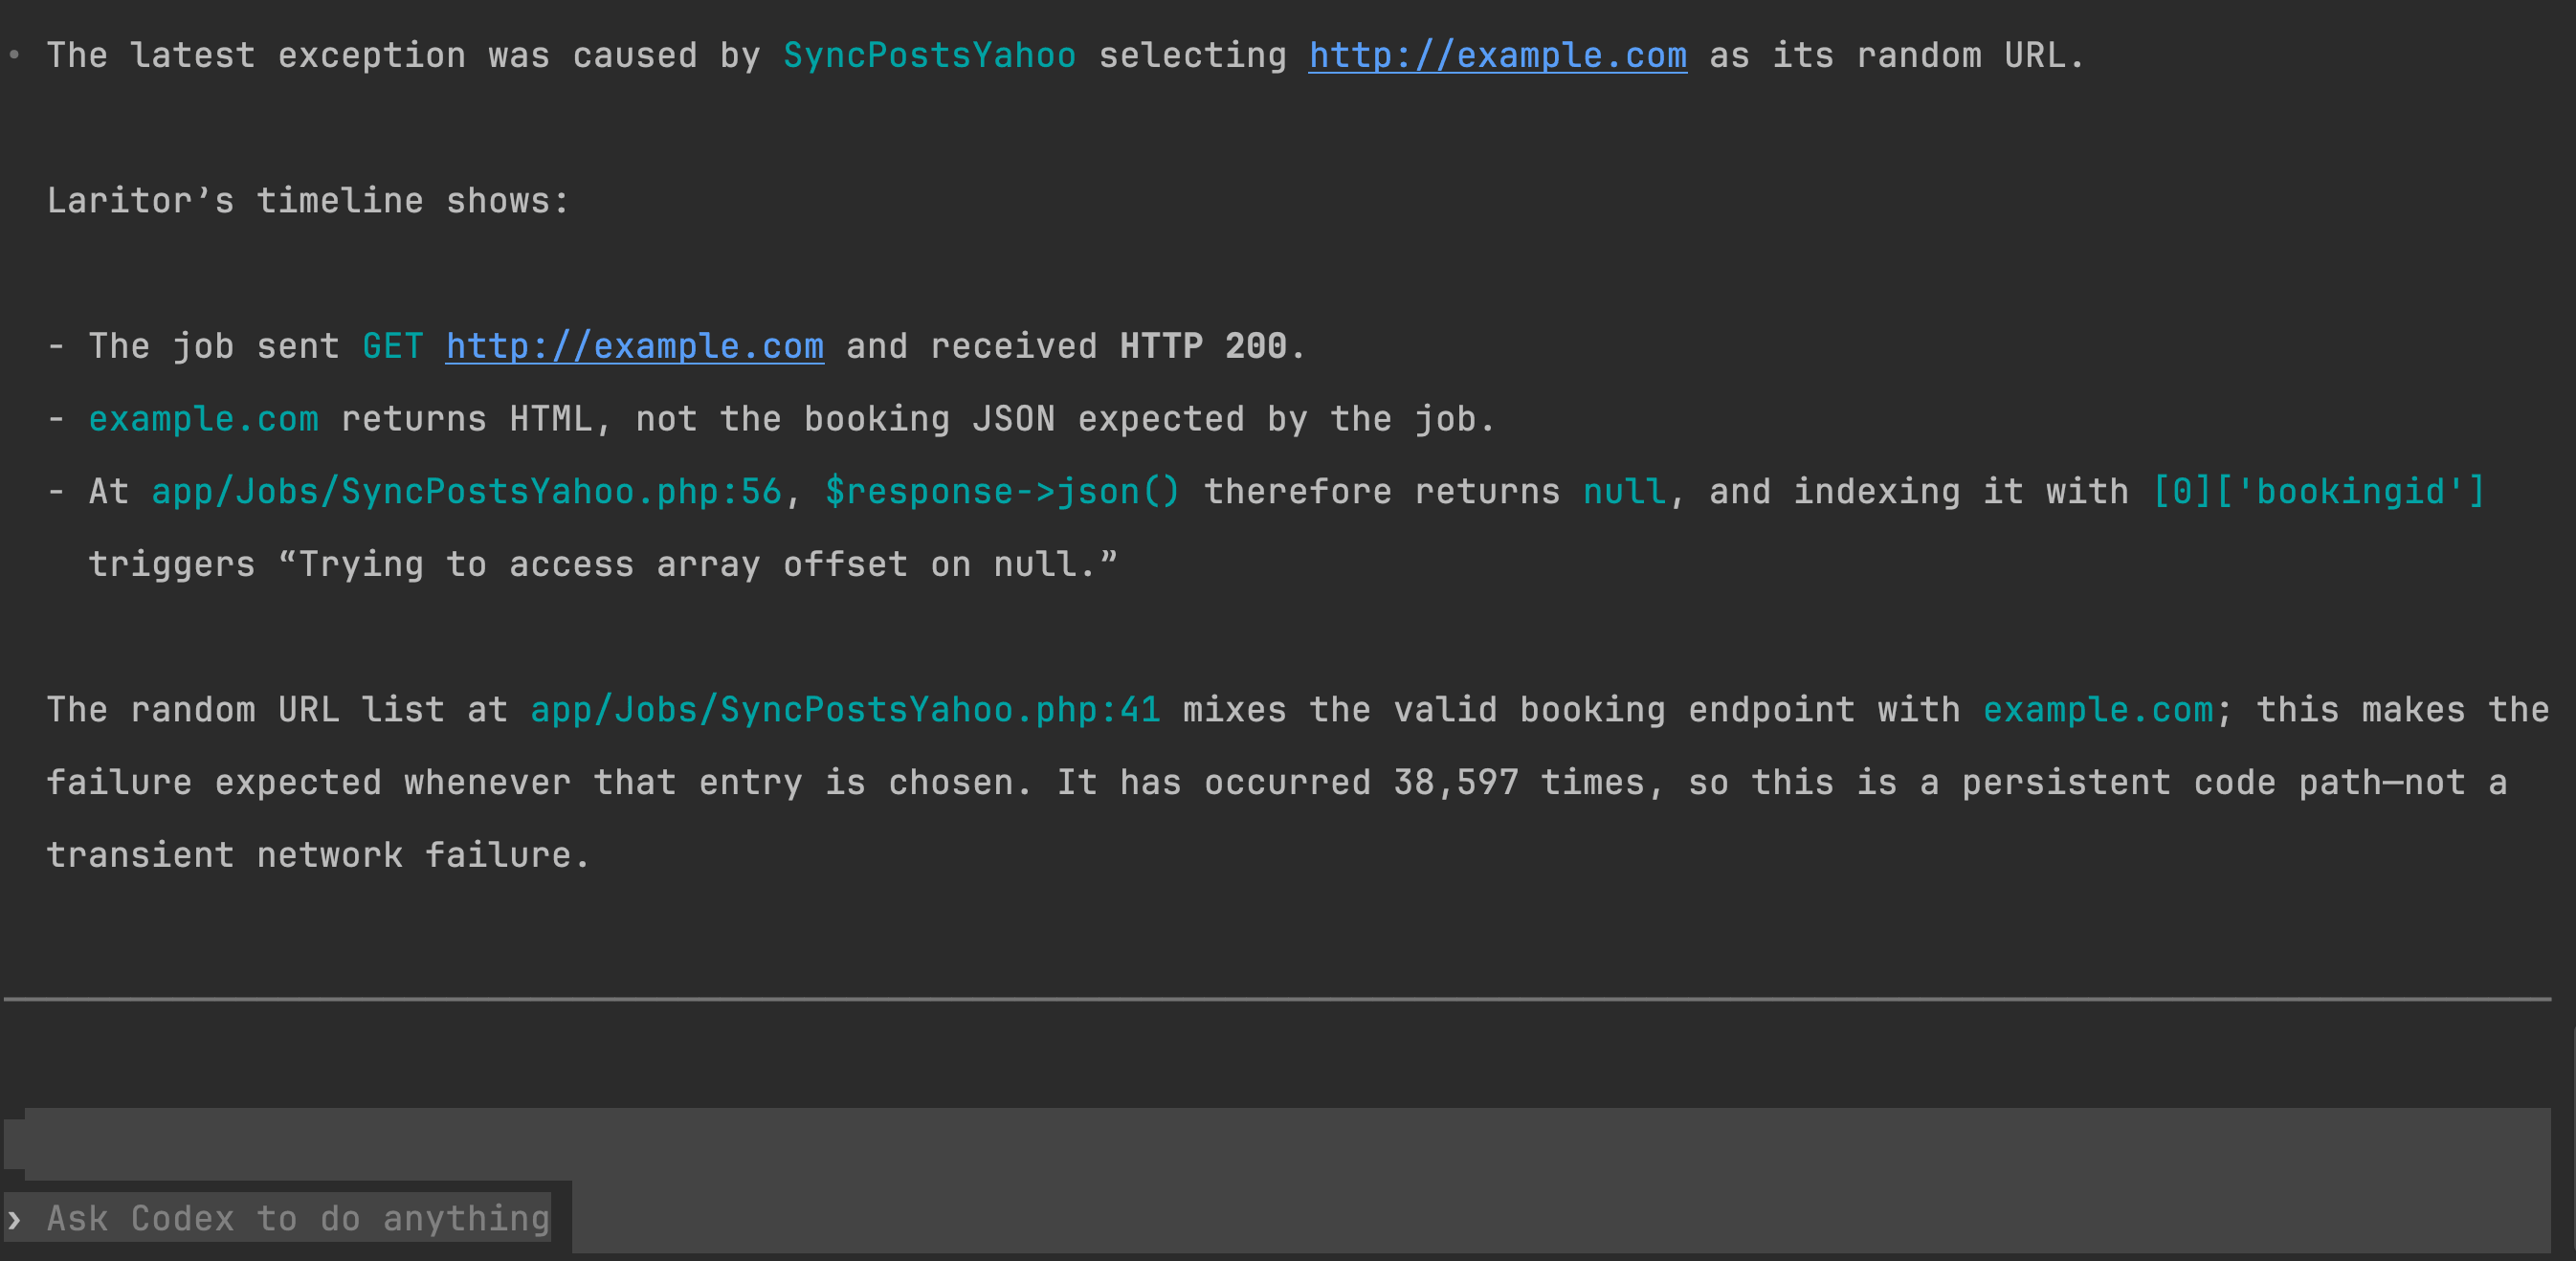
Example: an agent using Laritor’s recorded events to find the cause of a job exception. The same workflow applies to command exceptions.
MCP setup guideChoose what to record
You choose how much activity Laritor records. Start with exceptions, include other detected issues, or record all command runs to monitor performance over time. Each recorded run includes its related events.
Record commands that contain an exception, along with their related events.
Record runs with detected issues, including failed commands and slow queries, with the events needed to investigate.
Record successful runs too, to monitor command volume, success rates, and run times across your app.
Control what you send to Laritor. Filter events and redact passwords, tokens, and personal information before the recorded data leaves your servers.
Install in under 1 minute
Install Laritor’s Laravel package, connect your app, and choose what to record. Find command exceptions and failures, or monitor all runs to understand their performance.
Free trial: 300K events · Unlimited apps and users