
Slow queries
Filter by duration to find SQL statements that take too long. Inspect the query and its source before deciding whether an index or a query change will help.
Laravel database query monitoring
Laritor is a performance monitoring and issue tracking tool for Laravel. See which SQL queries your app runs, how long they take, and where they come from. Find slow queries, N+1 patterns, and duplicates, then open the request or job behind them to understand what to improve.
Free trial: 300K events · Unlimited apps and users
Find unnecessary database workSlow queries, N+1 patterns, and duplicates.
See the code and contextSQL, source lines, and the originating run.
Get help with optimizationAI suggestions using your database schema.
Slow queries, N+1, and duplicates
A page or job can be slow because one query takes too long, or because it runs too many queries. Laritor helps you tell the difference. Search SQL text and filter by date, execution time, N+1 patterns, or duplicates.
Explore query filtersFilter by duration to find SQL statements that take too long. Inspect the query and its source before deciding whether an index or a query change will help.
An N+1 pattern can happen when a loop loads a related record for each item. Find the repeated queries and inspect whether eager loading or batching can reduce them.
Find identical queries repeated within one request or job. Check whether you can reuse the result, consolidate calls, or cache data that does not need to be fetched again.
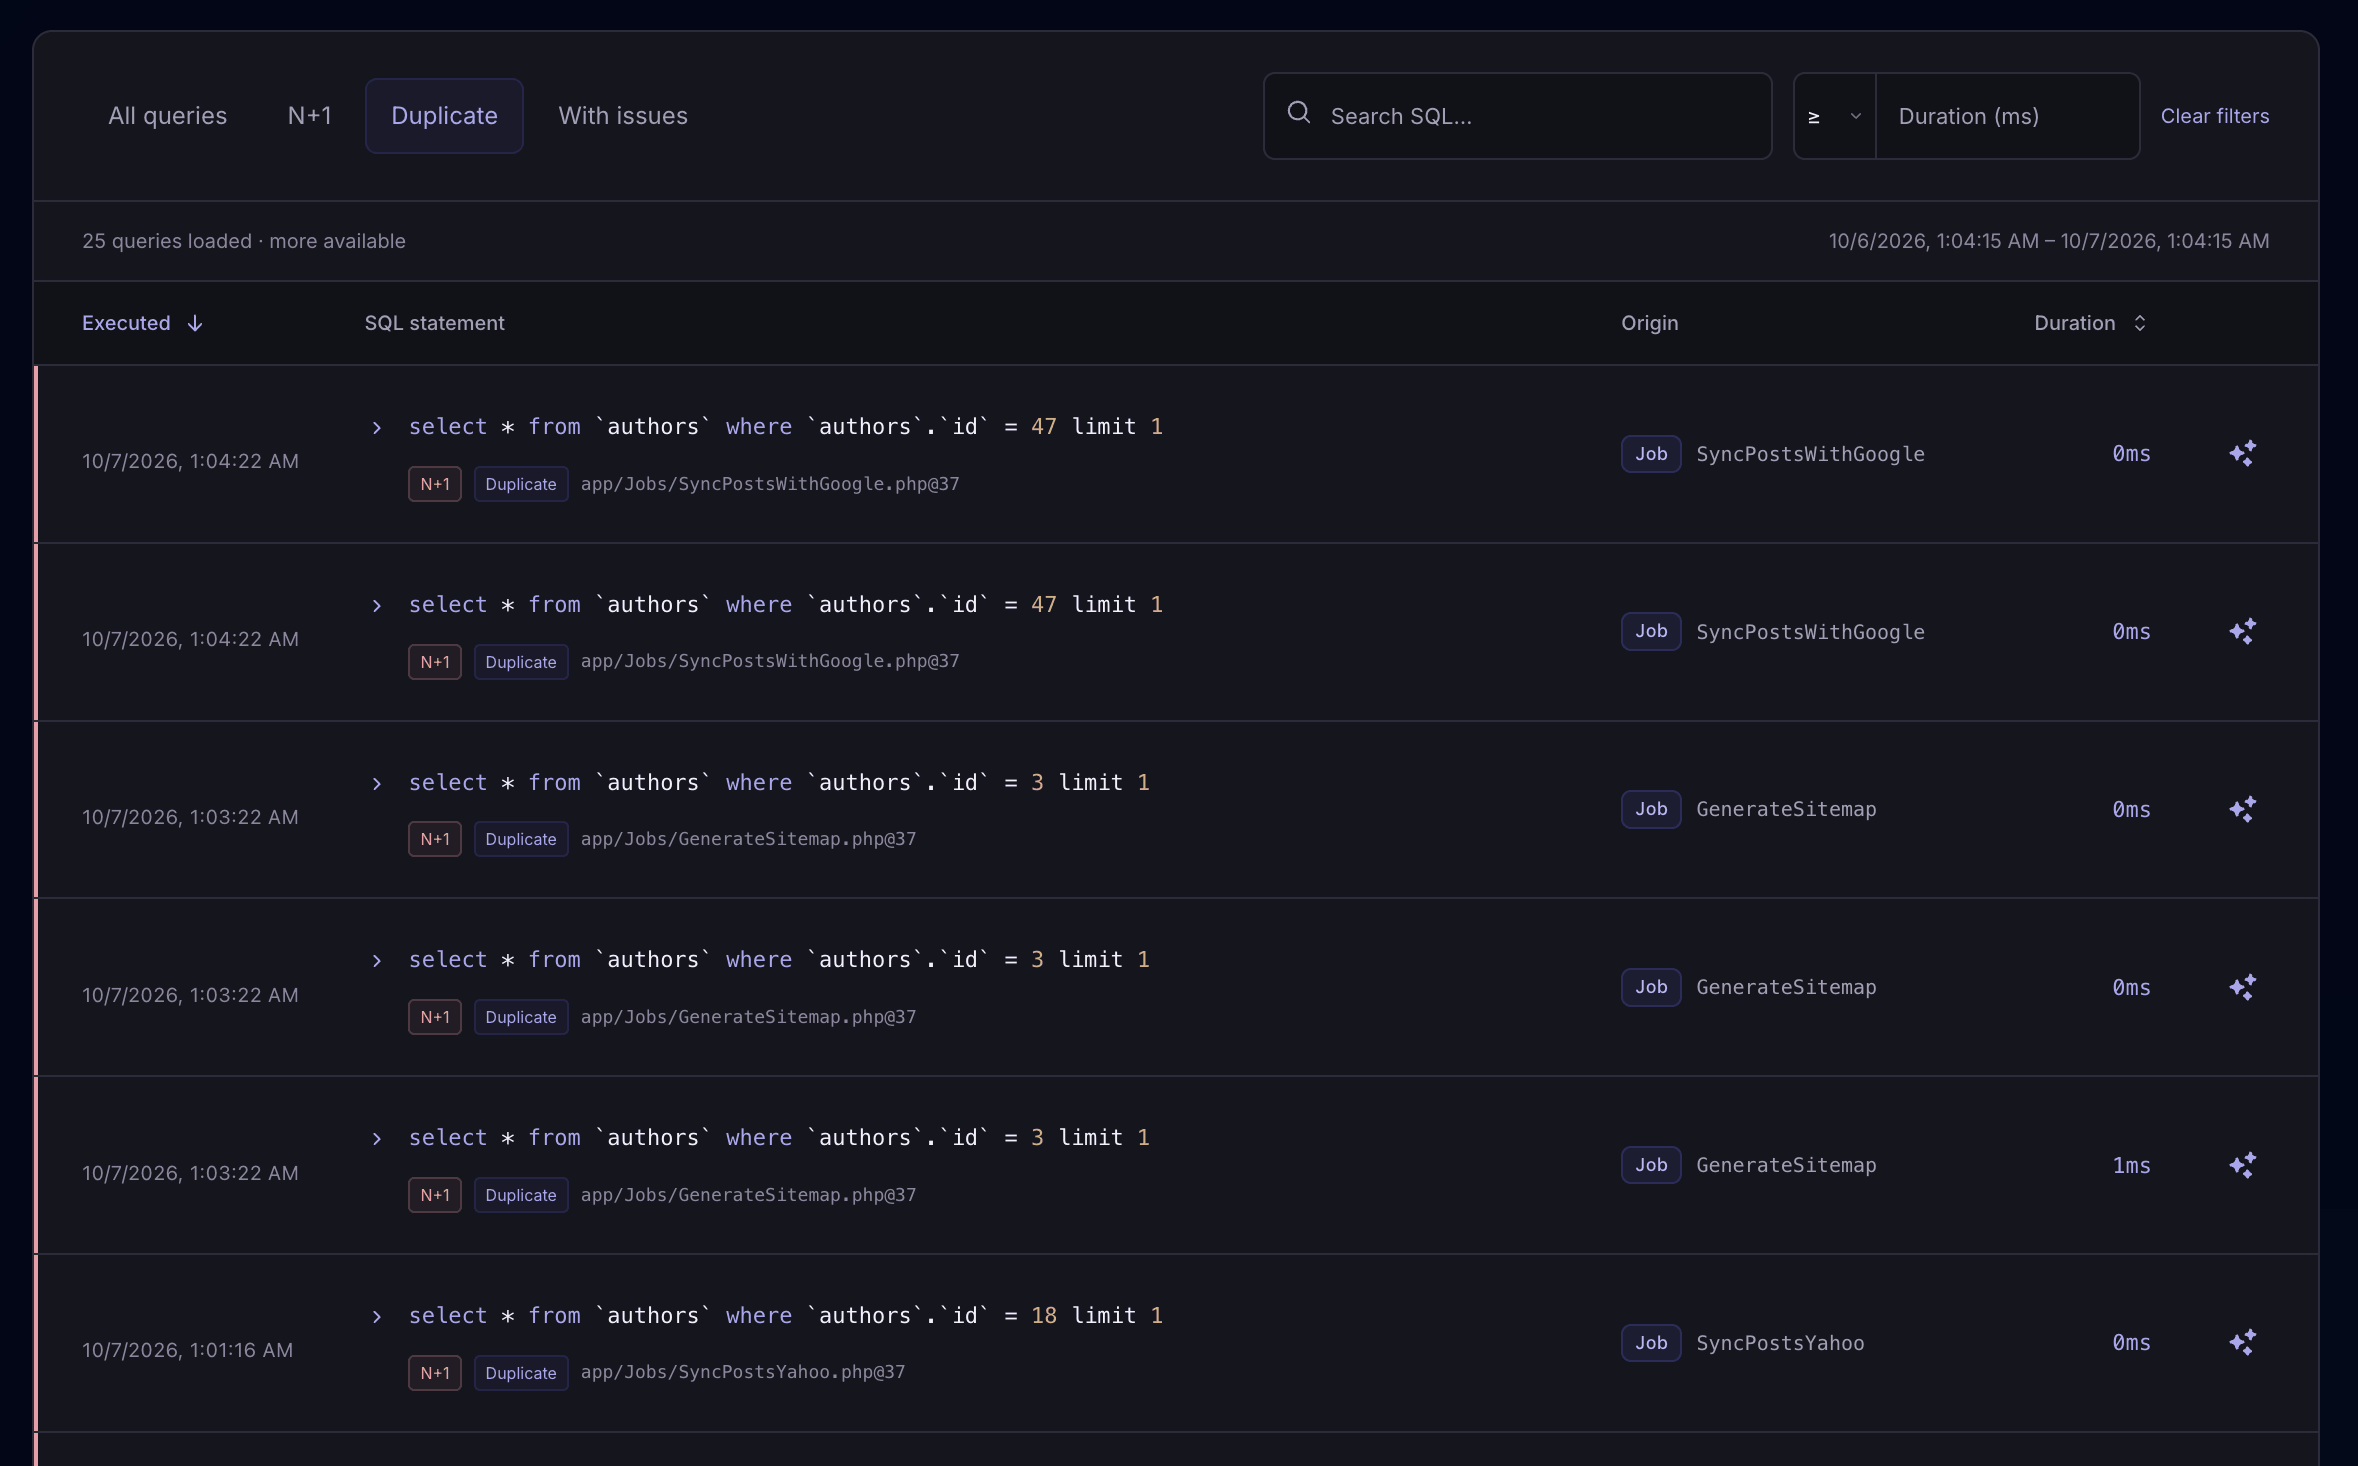
N+1 and duplicate indicators can overlap. A query can be part of a repeated lookup pattern and also repeat the same SQL within an execution.
From SQL to source code
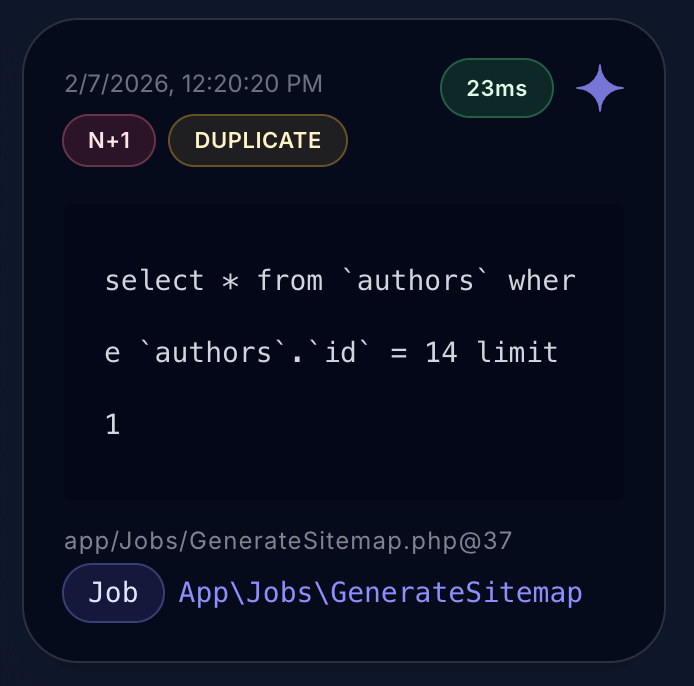
Inspect the recorded SQL and execution time, with bindings when your settings allow them. See the source file and line so you know which part of your Laravel app to investigate.
Database activity in context
A SQL statement makes more sense when you can see what your app was doing. Open its originating execution to inspect queries, logs, API calls, exceptions, and other recorded events in order.
Find repeated lookups inside an import, see the database work behind a slow page, or inspect the queries leading up to a failure.
Explore an execution timeline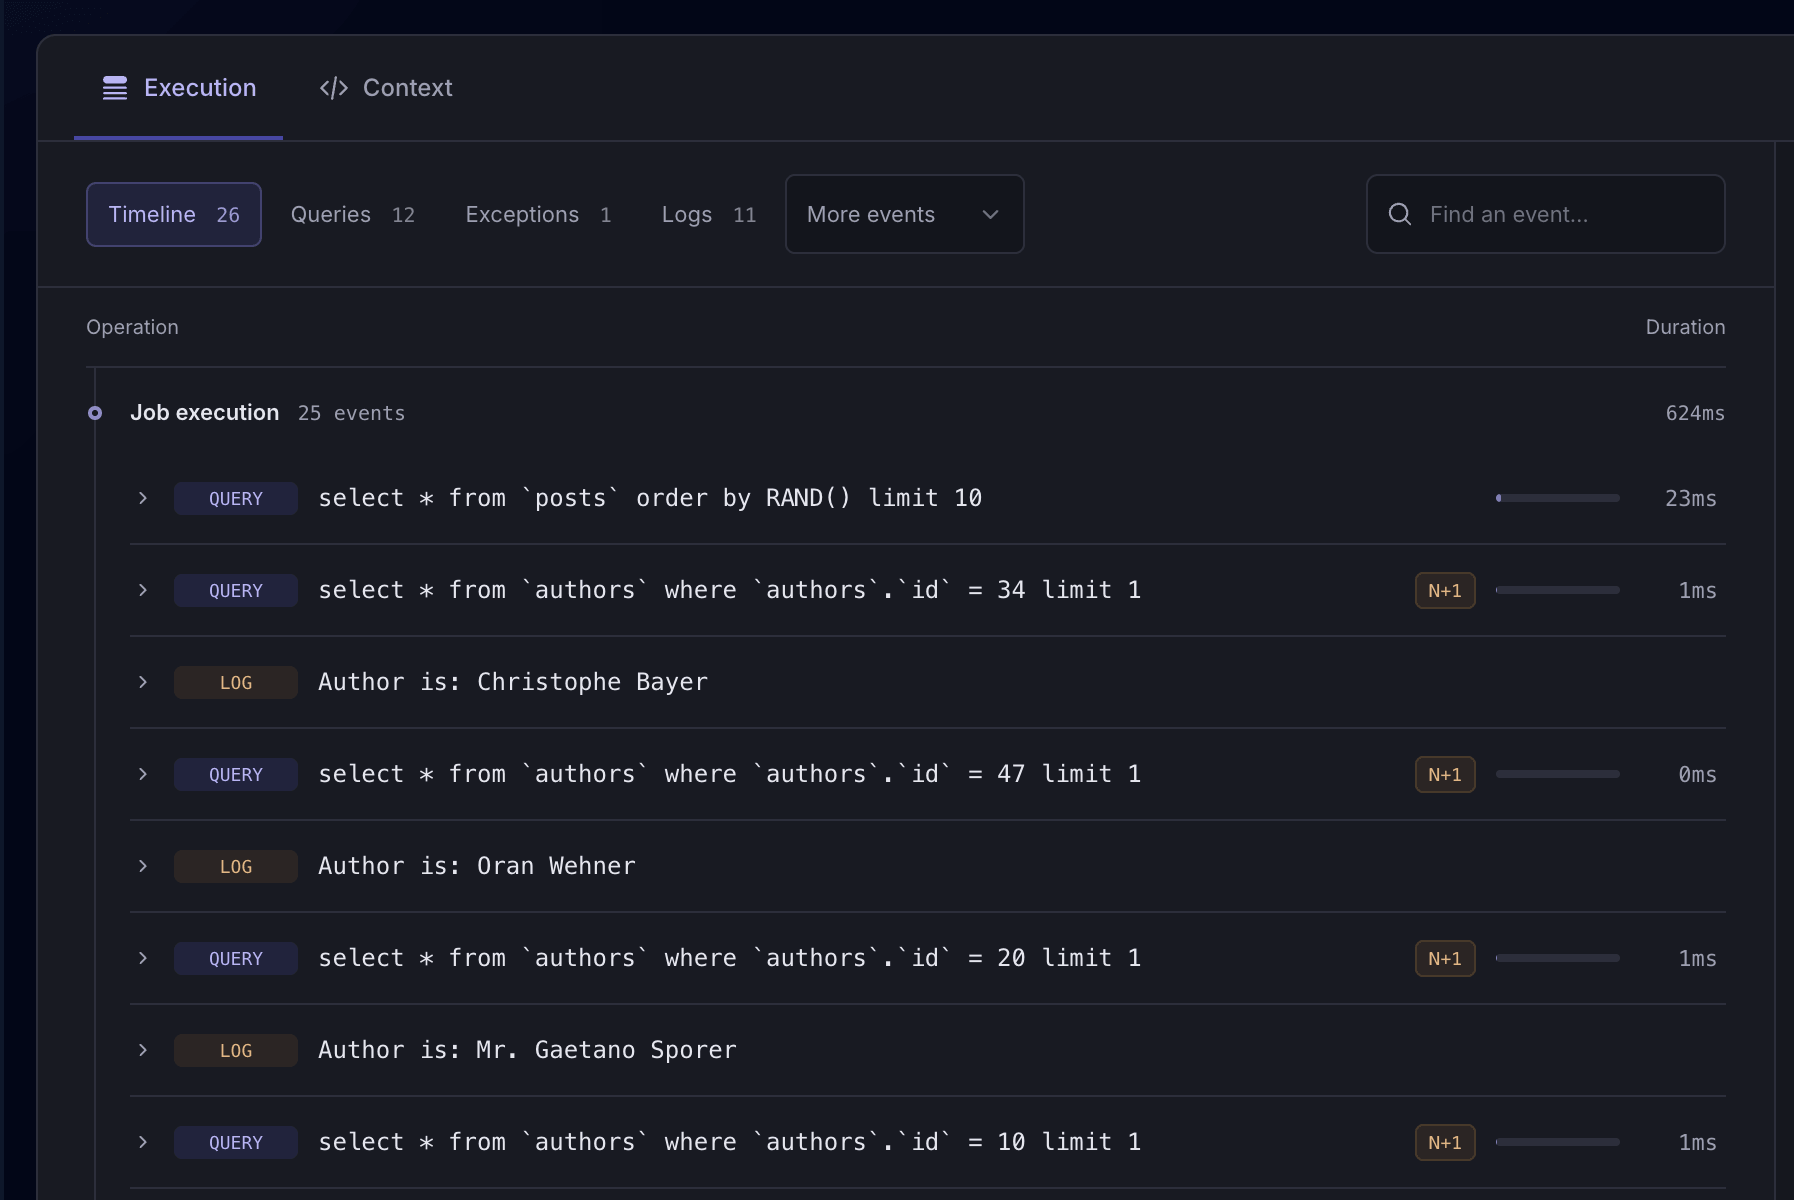
Schema-aware AI optimization
Laritor’s in-app AI uses the recorded query and available database schema to make recommendations relevant to your app. Ask about an individual query or explore how your table structure supports the work your application needs.
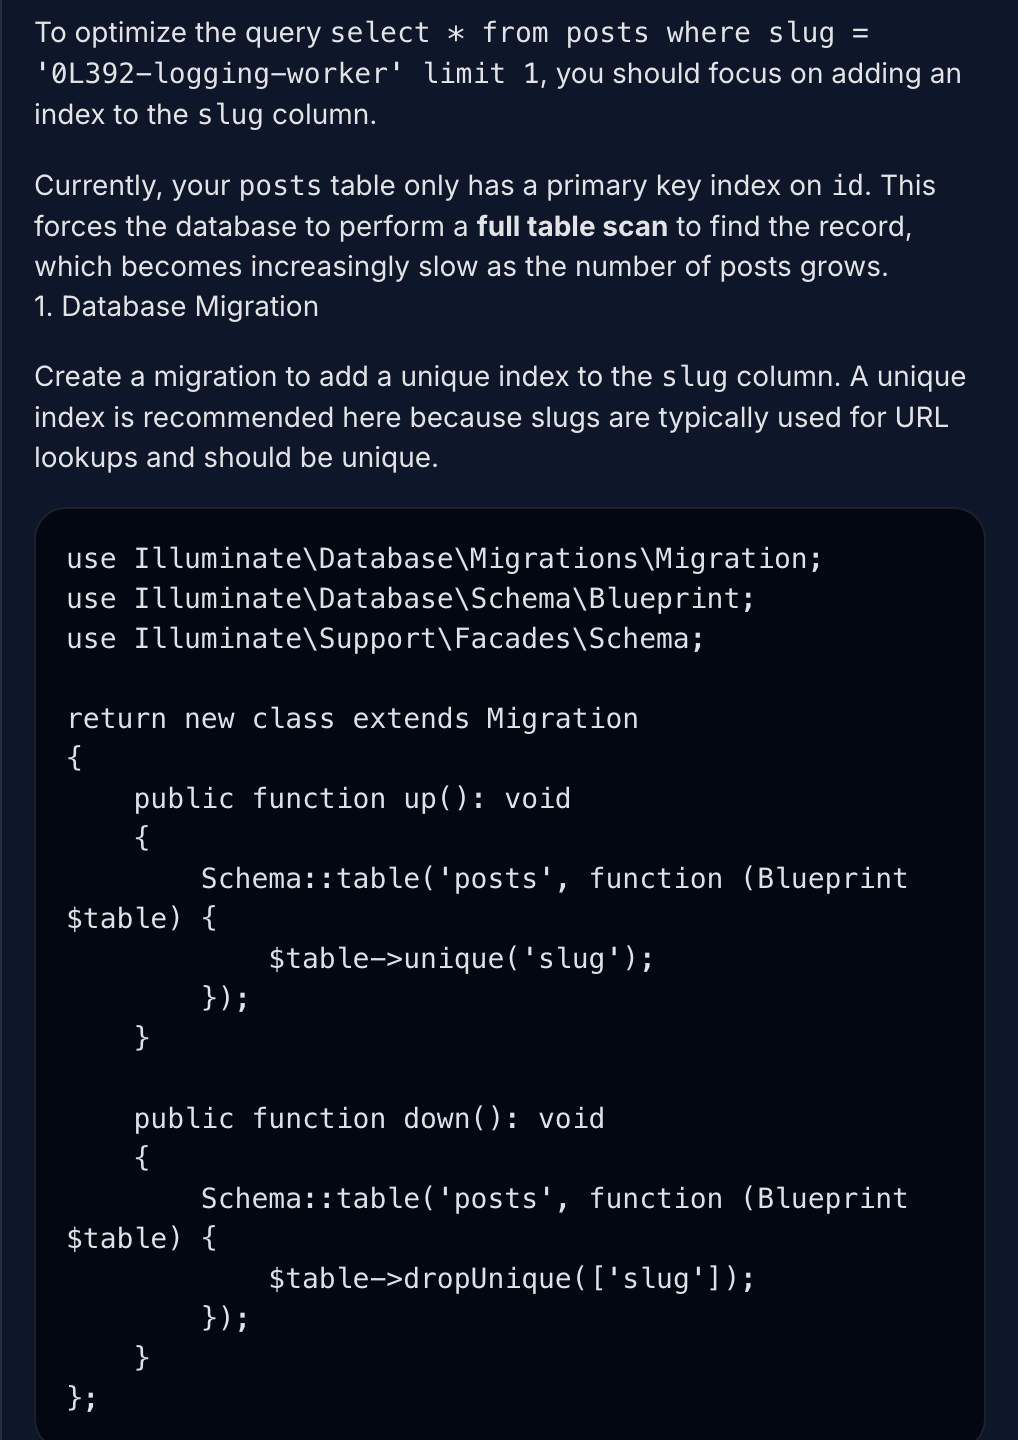
Explore the database schema toolsOpen Optimize with AI on a recorded query. Laritor uses the SQL and available database schema to suggest indexes, query changes, or other improvements. In this example, it identifies a lookup by slug and proposes a Laravel migration for an index.
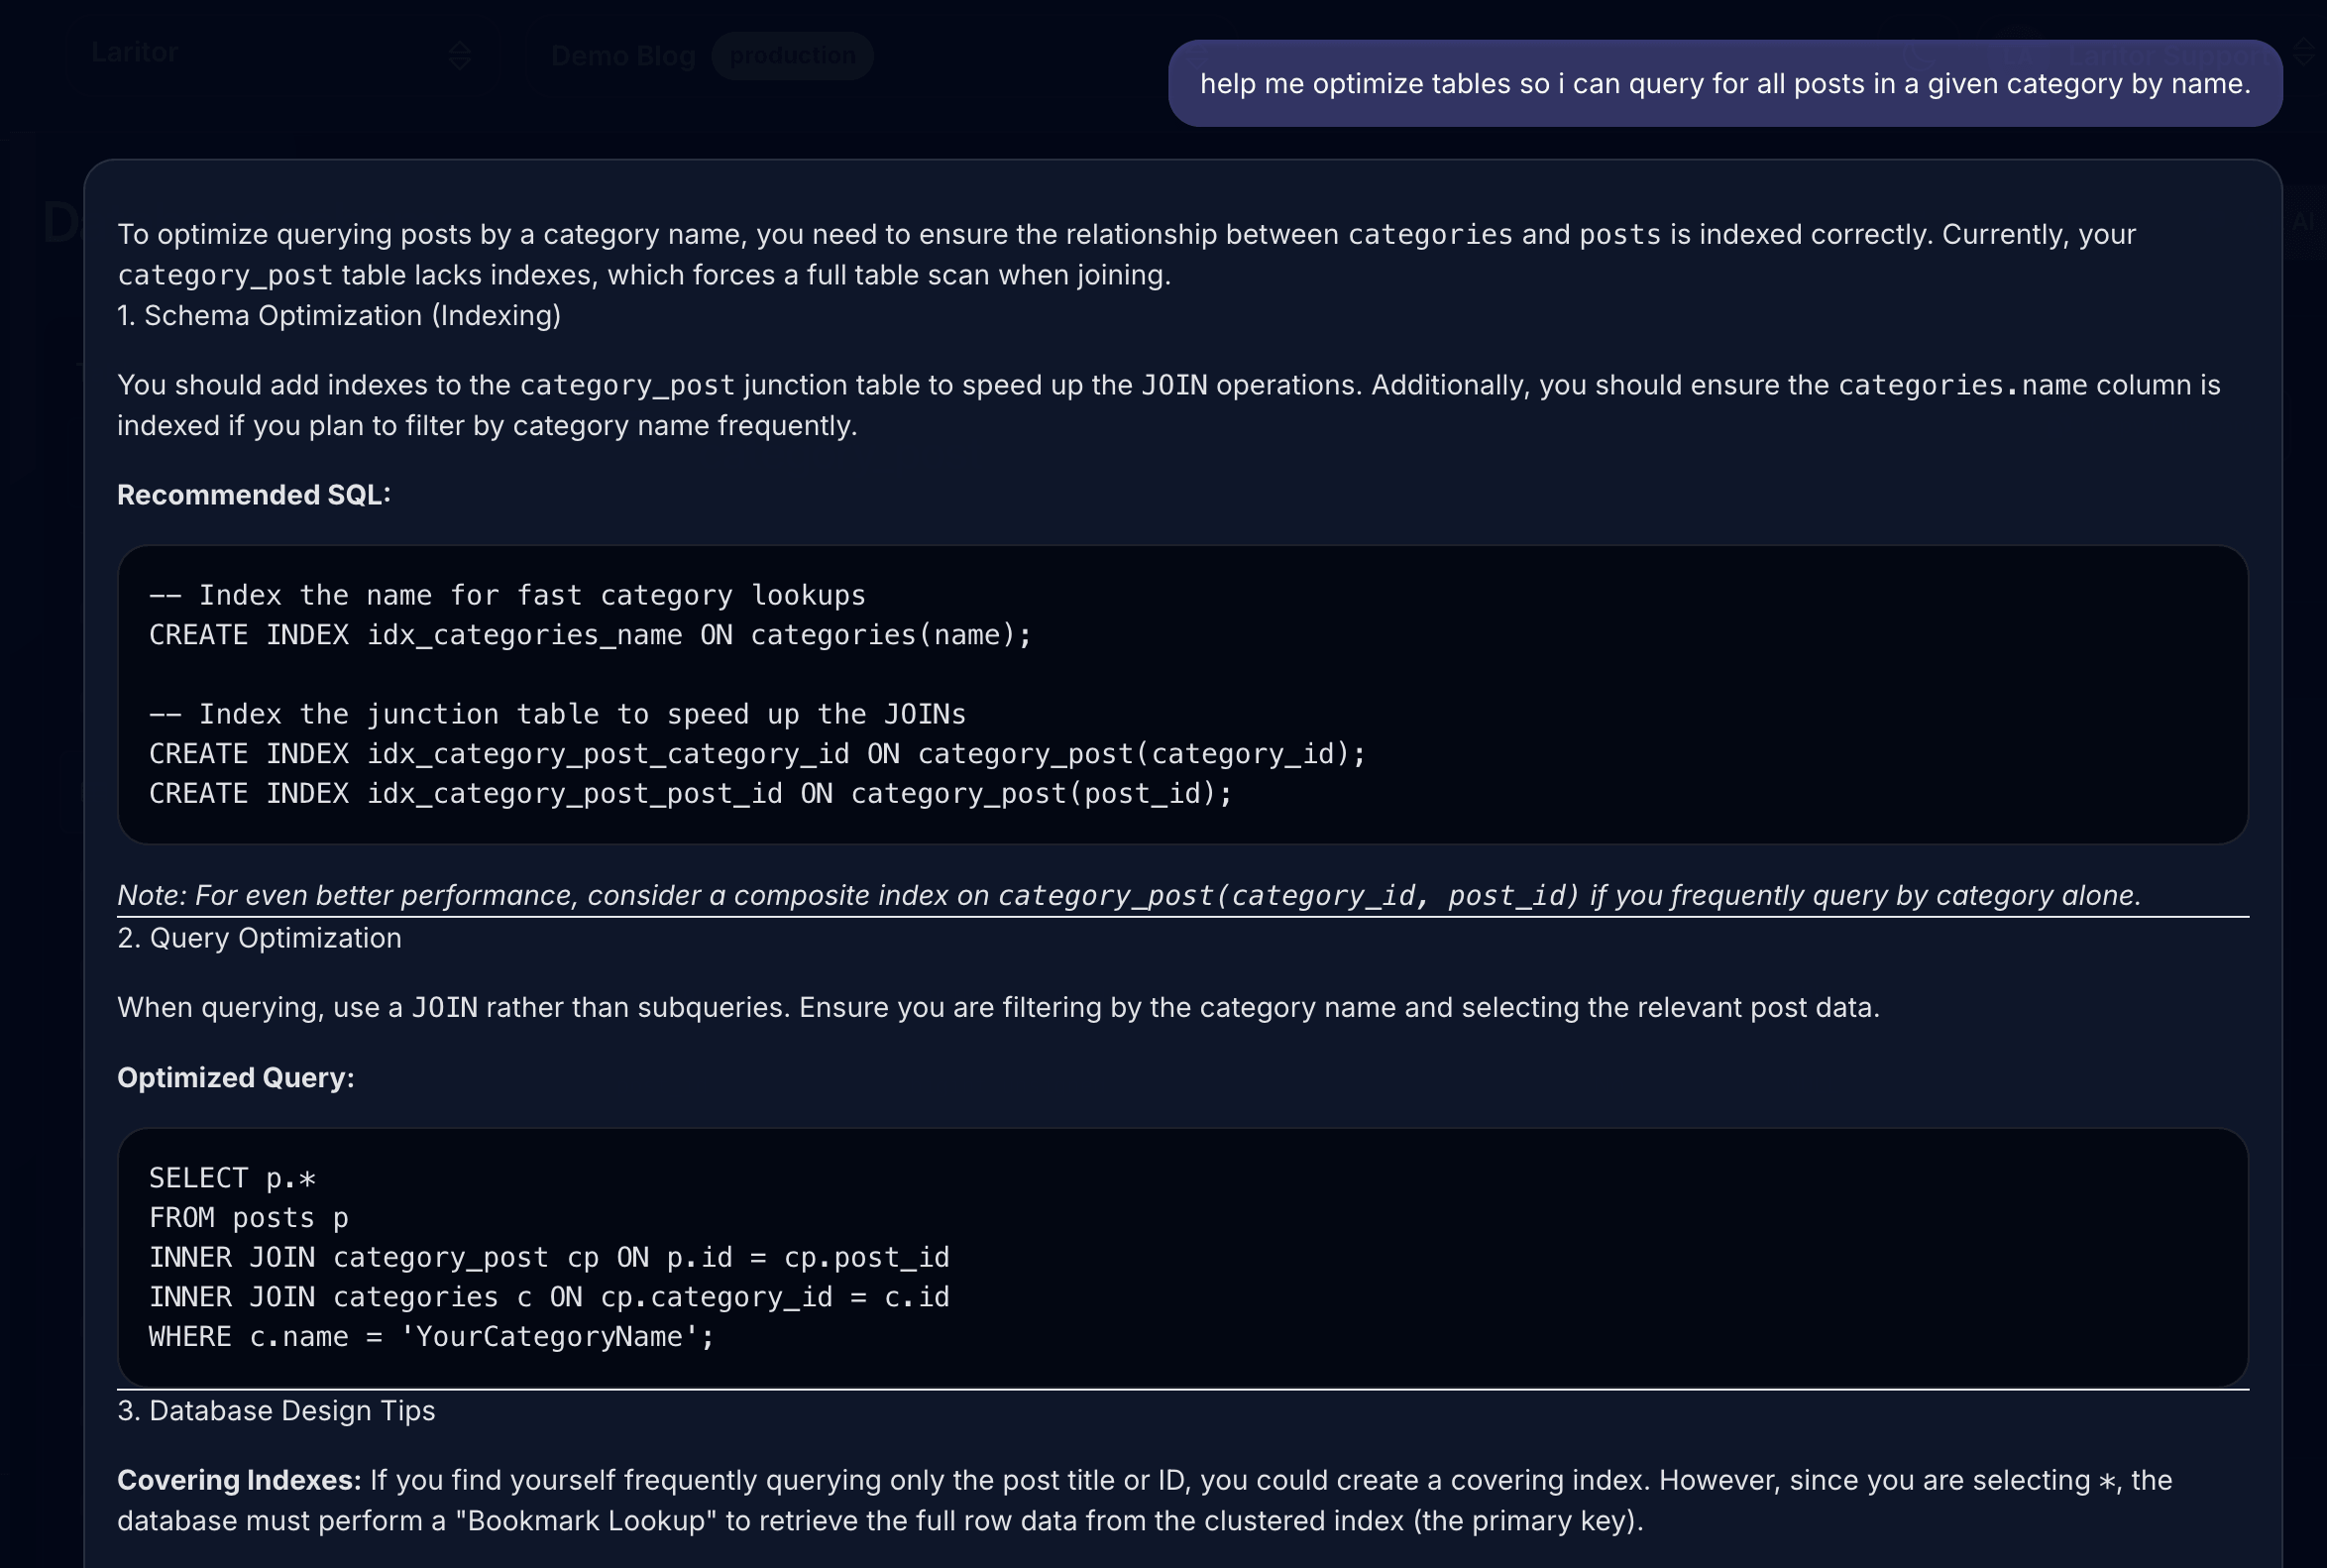
Use the schema explorer to inspect tables, columns, indexes, and relationships. Ask AI how to improve the queries your app needs. This example considers finding posts by category name and suggests indexes and a join using the application’s tables.
Keep schema information current. Run php artisan laritor:sync after deployment. Review proposed indexes and query changes, test the affected workflow, and compare performance before applying them to production.
Choose your AI provider. Every account includes 50 in-app AI prompts per month. You can connect your own provider for more usage. Explore AI settings →
Query performance over time
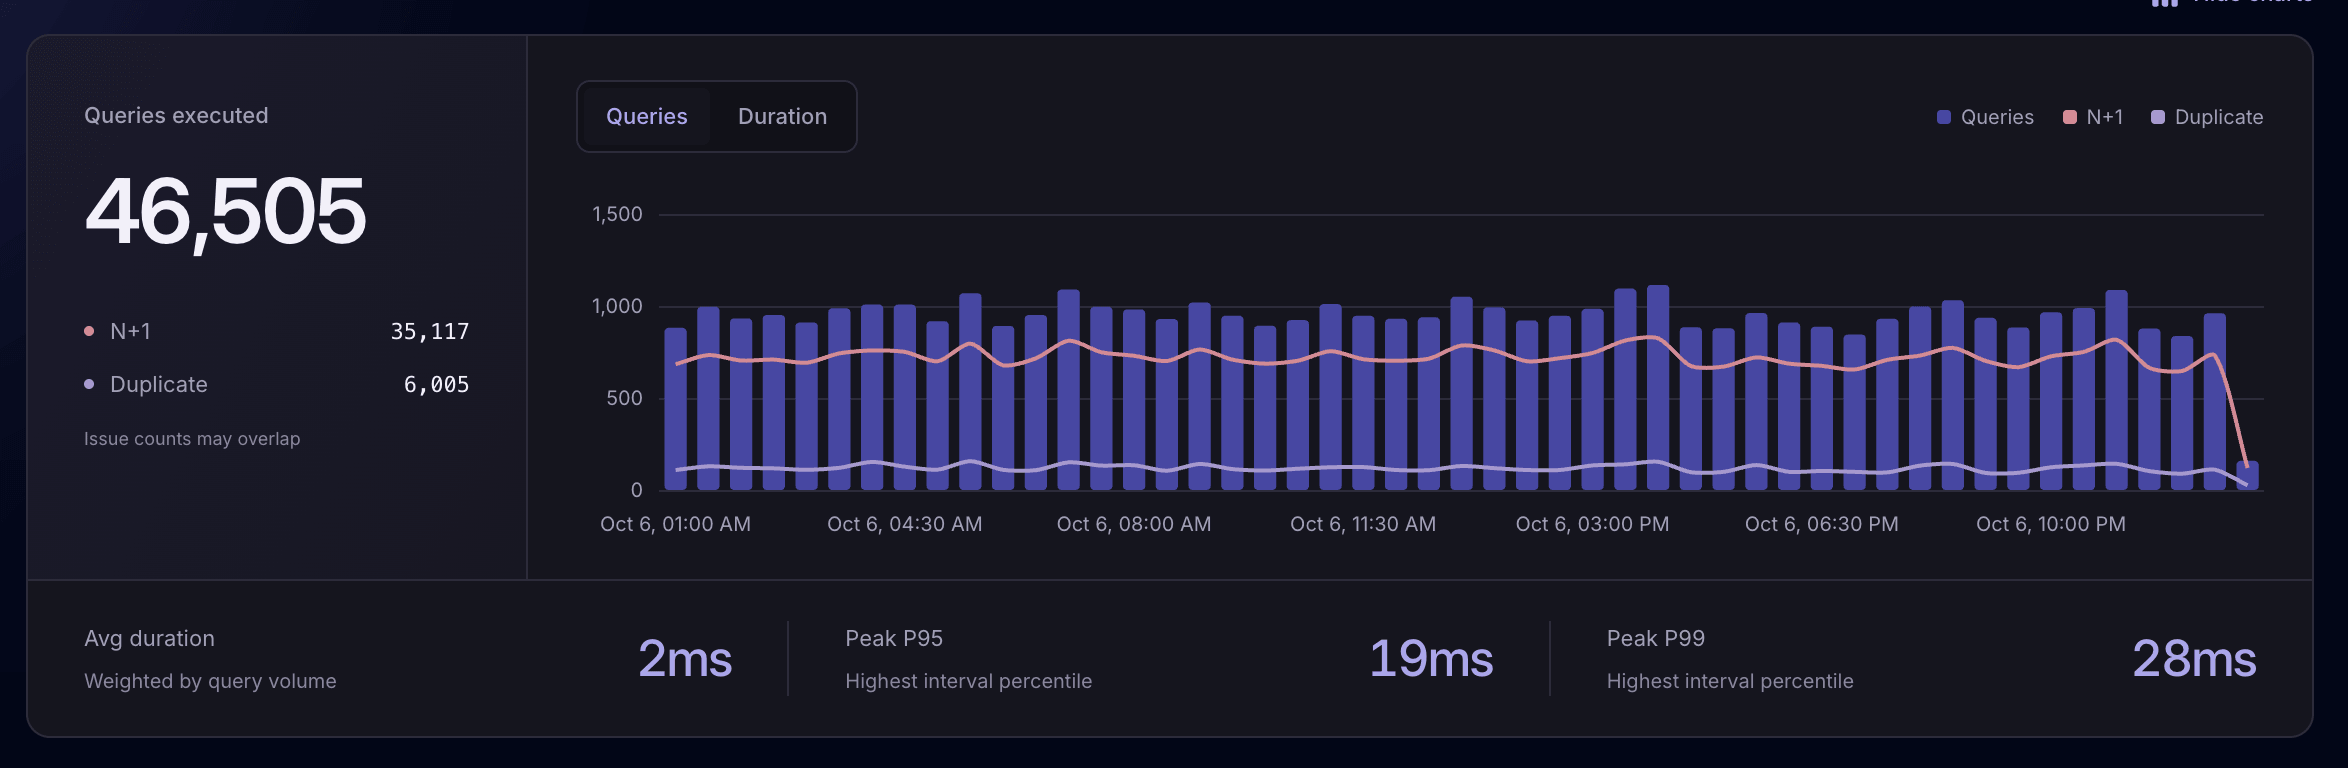
Use Laritor’s query metrics to see activity and timings over the selected period. Look for increases in database work, then inspect the individual executions behind them.
After a code or schema change, compare the affected workflow’s query counts and durations. Take changes in traffic and workload into account when assessing the result.
See how much database work your recorded activity generates. Compare total query counts with N+1 and duplicate counts over the selected period.
Check the volume-weighted average execution time. A low average can still hide individual slow queries, so inspect timings as well as counts.
Look beyond the average to the slower end of query timings. These cards show the highest interval percentile in the selected period, rather than one percentile for the entire period.
Metrics reflect the activity you send to Laritor. Use full observability for a broader picture of successful and unsuccessful activity; filtered modes show the occurrences you retain.
Use Laritor how you want
Choose which occurrences Laritor records. Each retained request or job includes its related events, subject to your filters. You can investigate database failures without recording all successful activity.
Compare modes and estimate your costKeep related queries when a request, job, command, or task contains an exception. Useful for investigating the database activity around a failure.
Successful activity without exceptions is not sent.
Record occurrences with detected problems, such as slow queries, slow requests, or failed jobs. Keep their related queries and other events for investigation.
Useful when you want to focus on problems.
Record successful activity too. Monitor query volume and timing across your app and compare healthy executions with ones that need attention.
Use this for broader database performance monitoring.
Queries and other related events count toward usage in every mode. Paid plans start at $20/month with 20 million events included. Sending fewer events can reduce extra charges.
Sensitive data and recording controls
Query bindings can contain email addresses, tokens, and other sensitive values. Control whether bindings are recorded, customize redaction, and exclude query activity you do not need before data leaves your app.
Explore binding and payload controlsUse recordQueryBindings to decide whether parameter values are included with recorded SQL.
Use recordQuery to exclude selected queries. Consider the investigation context you want to preserve when setting filters.
Customize the client’s redactor to remove or mask values before sending data.
Configure redaction →A practical optimization workflow
Use recorded evidence to decide what to change. Improving a single query and reducing how often it runs are different ways to reduce database work.
Filter recorded queries by SQL text, date, duration, or an N+1 or duplicate badge. Start with the queries behind a slow request or job.
See the source file and line, then open the originating execution. Check whether the problem is one slow operation or too many small queries.
Review AI suggestions, update your code or schema, and test the affected workflow. Compare query counts and durations when it runs again.
Common questions
Slow SQL, repeated queries, AI optimization, and recording controls.
Laravel query monitoring helps you see the SQL your application executes, how long queries take, and which requests or jobs run them. Laritor records database activity with source locations, identifies N+1 and duplicate patterns, and provides filters and AI suggestions to help investigate performance problems.
In Laritor, filter recorded queries by execution duration and date, or search for a SQL statement. Inspect the query and source file, then open its originating request, job, command, or scheduled task to understand the context. Use the available schema and AI recommendations to assess potential improvements.
An N+1 pattern commonly occurs when an application loads a collection and then runs an additional query for each item to load related data. Many individually fast queries can add unnecessary database work. Laritor marks detected N+1 patterns and shows their SQL, source location, and originating execution so you can investigate eager loading or batching.
Duplicate queries repeat the same SQL within one occurrence. An N+1 pattern involves repeated lookups, often with the same query structure and different values, such as loading an author for each post. A query can be marked with both indicators, so N+1 and duplicate counts can overlap.
Laritor shows the recorded SQL, its execution time, and its source file and line. Queries link to the originating request, queued job, Artisan command, or scheduled task. Open that execution to follow its timeline and understand how the query fits into the application’s work.
Yes. Query monitoring covers recorded HTTP requests, queued jobs, Artisan commands, and scheduled tasks. This helps investigate database work in imports, reports, and recurring jobs as well as web pages and APIs.
Laritor’s in-app AI uses available database schema information, including tables, columns, indexes, and relationships, to provide query and schema recommendations. Keep the schema up to date with php artisan laritor:sync after deployment. Review and test suggested indexes or query changes against your application’s workload before deploying them.
Yes. The Laravel client provides a recordQueryBindings override to control whether SQL bindings are recorded. You can also customize redaction and filter queries before data is sent. This lets you preserve useful query information while excluding sensitive values and activity you do not need.
No. Exceptions-only mode keeps related queries for occurrences containing exceptions. issue tracker mode keeps related events for occurrences with detected issues. Full observability also records successful activity for broader performance monitoring. Your query metrics reflect the activity you send, and custom filters can further limit it.
P95 and P99 describe the slower end of query execution times within a measurement interval. Laritor’s peak cards show the highest interval P95 and P99 values in the selected period. They are not a single overall percentile calculated across every query in that entire period.
Install in under 1 minute
Install Laritor’s Laravel package, connect your app, and choose what to record. Find slow and repeated queries, inspect their context, and get help with the next change.
Free trial: 300K events · Unlimited apps and users