Cache
Track cache performance with full context.
Laritor captures every cache hit, miss, write, and delete. Visualize hit rate, totals, and trends, and understand exactly when cache misses slow down your requests.
Cache visibility
Hits · Misses · Writes · Deletes
Performance insight
Hit rate + trends
Execution context
Hit vs miss per request
Actionable signals
Instant cache health
Hit vs miss clarity
See when cache misses slow requests.
Performance-ready metrics
Hit rate, totals, and trends at a glance.
Cache intelligence
Know when caching is helping or hurting.
Laritor highlights cache misses and hit-rate shifts so you can optimize caching strategies and reduce latency.
All cache events captured automatically
Hit rate and event totals per period
Highlight cache misses that slow requests
Pinpoint where hits vs misses occur
Understand write/delete churn
Correlate cache behavior to requests
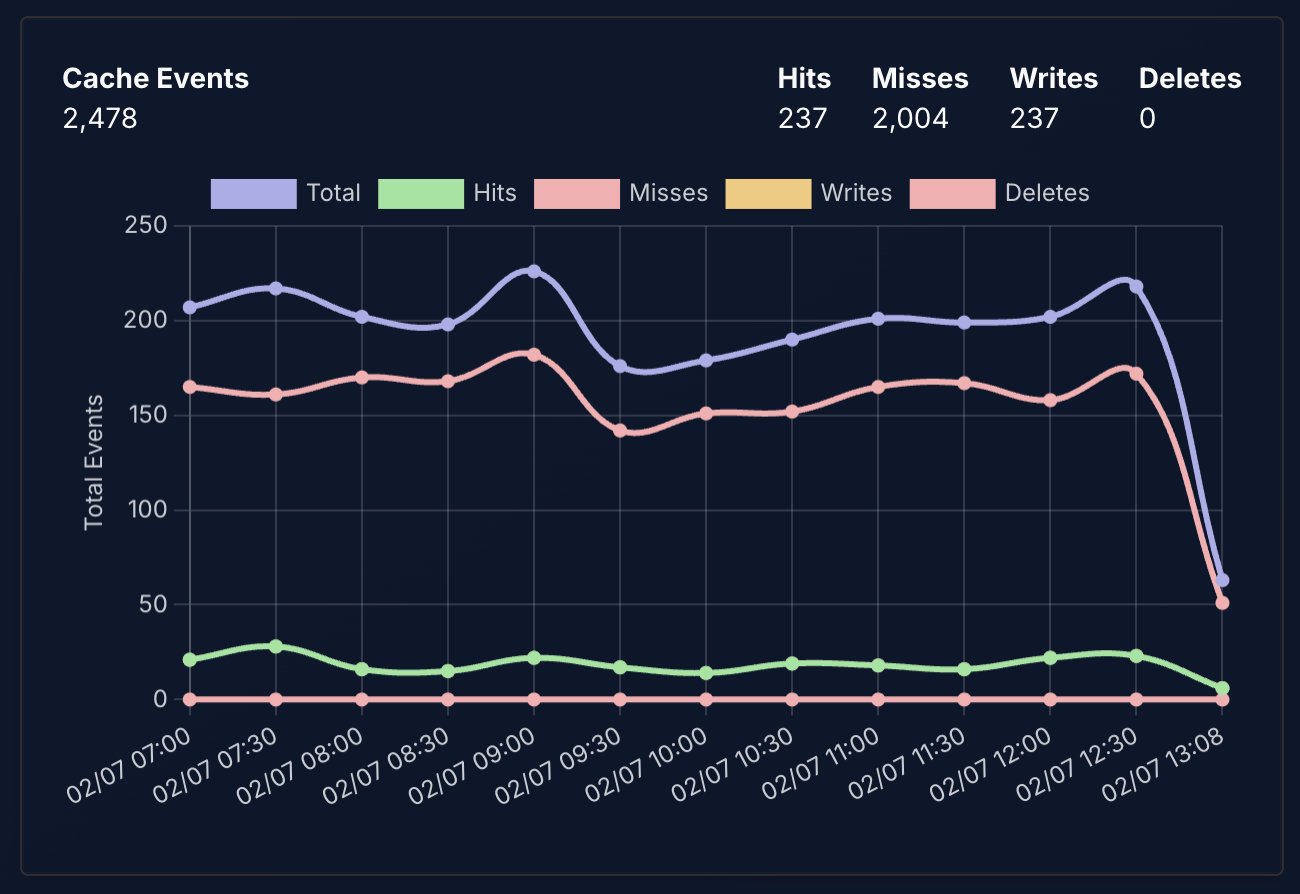
Event trends
Cache events over time
Track cache hits, misses, writes, and deletes across your app so you can spot regressions or unexpected churn.
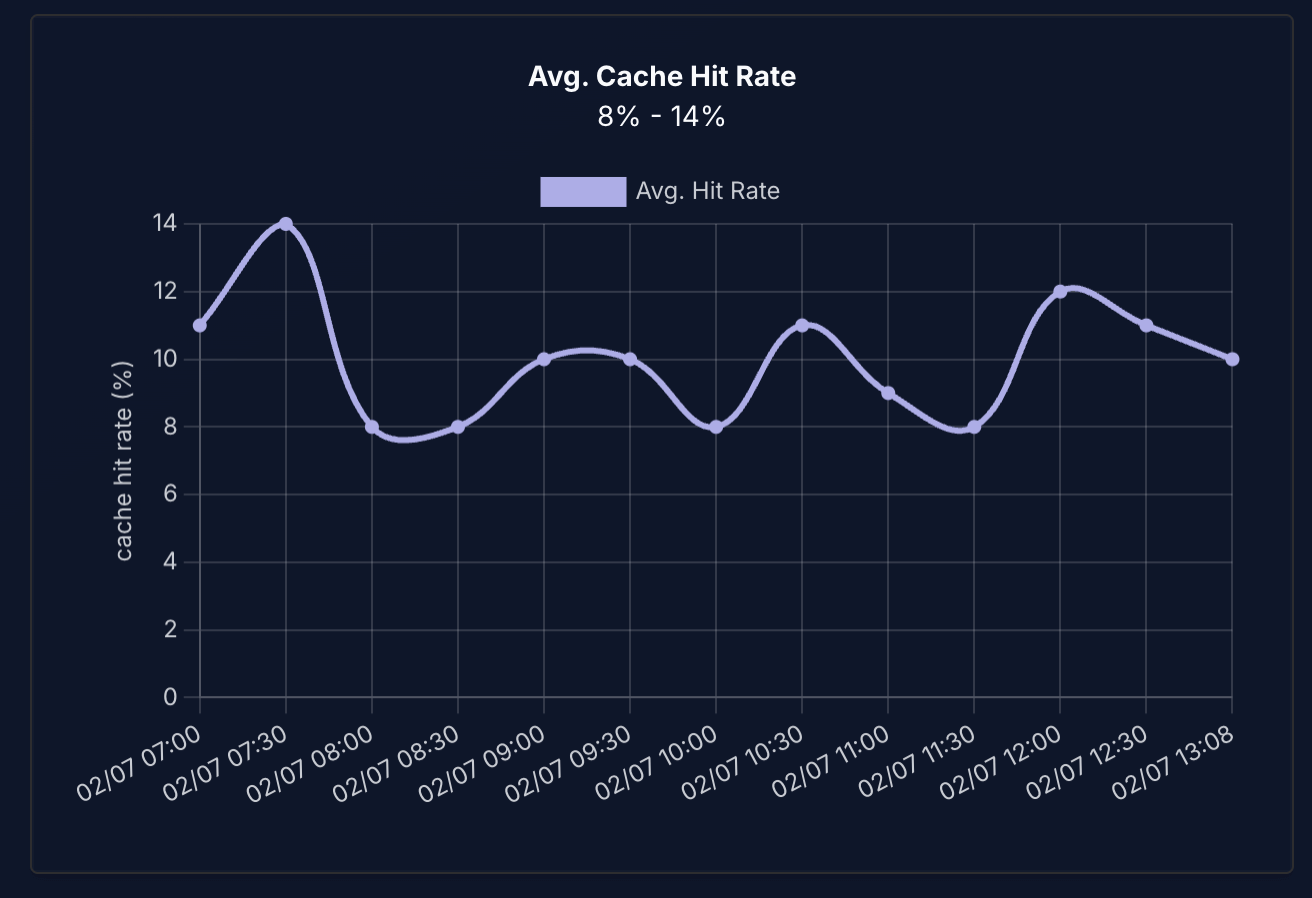
Hit rate
Hit rate visibility
Visualize cache hit rate to understand whether caching is helping or hurting overall performance.
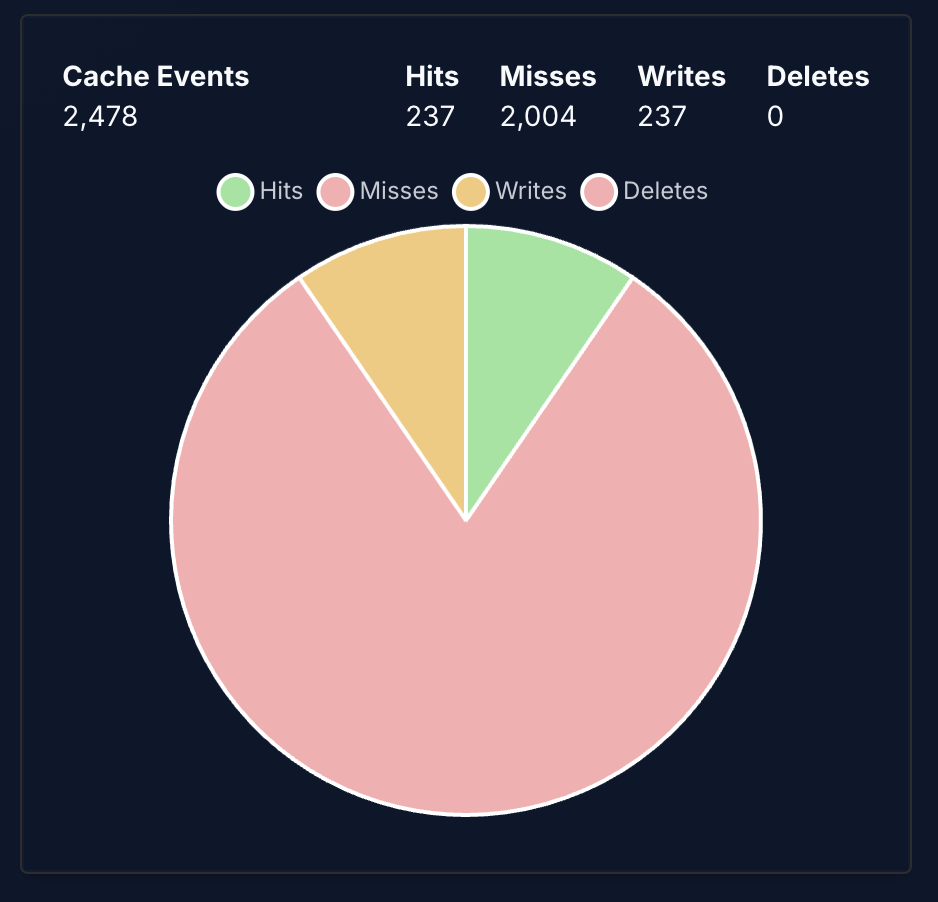
Event mix
Event distribution mix
See the breakdown of hits, misses, writes, and deletes to understand cache efficiency at a glance.
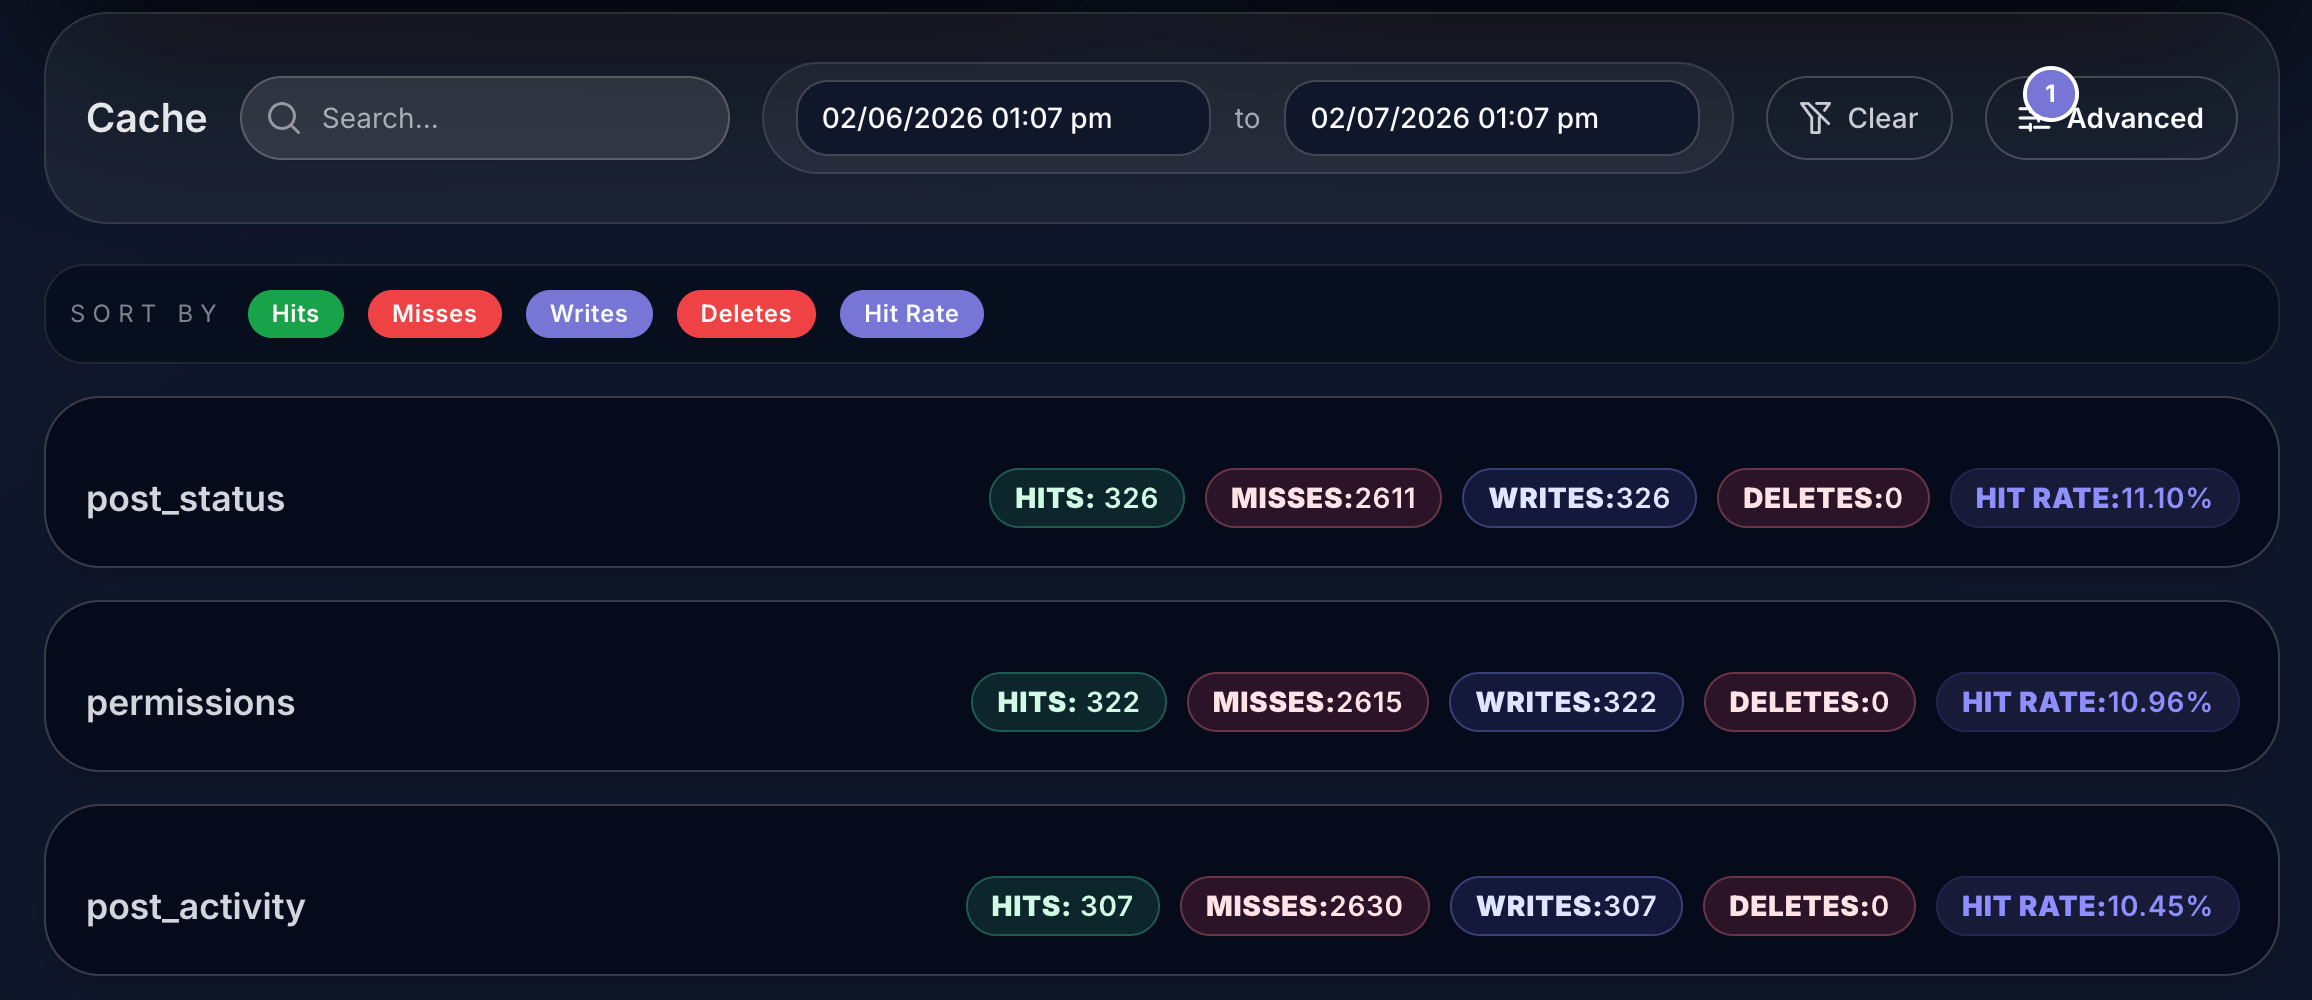
Cache details
Hits, misses, writes, and deletes in context.
Laritor stores cache operations with their context so you can see how cache behavior affects real request latency.
- Cache key, operation, and timestamp
- Hit or miss indicator for every read
- Writes and deletes tracked explicitly
- Hit rate and totals over time
- Links back to the originating request or job
- Environment and cache store metadata
Cache performance at a glance.
Monitor hit rate, event distribution, and churn to validate caching strategy changes quickly.
Cache observability without blind spots.
Track every cache event, understand hit rate, and eliminate slowdowns caused by cache misses.