
Check counts
See how often your app evaluated a flag in the selected period. A single request or job can check a flag more than once.
Laravel feature flag monitoring
Laritor is a performance monitoring and issue tracking tool for Laravel. Track feature flag checks, see when they are active, and compare execution times and errors for active and inactive results. Open the requests or jobs behind a check to investigate how a feature behaves in your app.
Free trial: 300K events · Unlimited apps and users
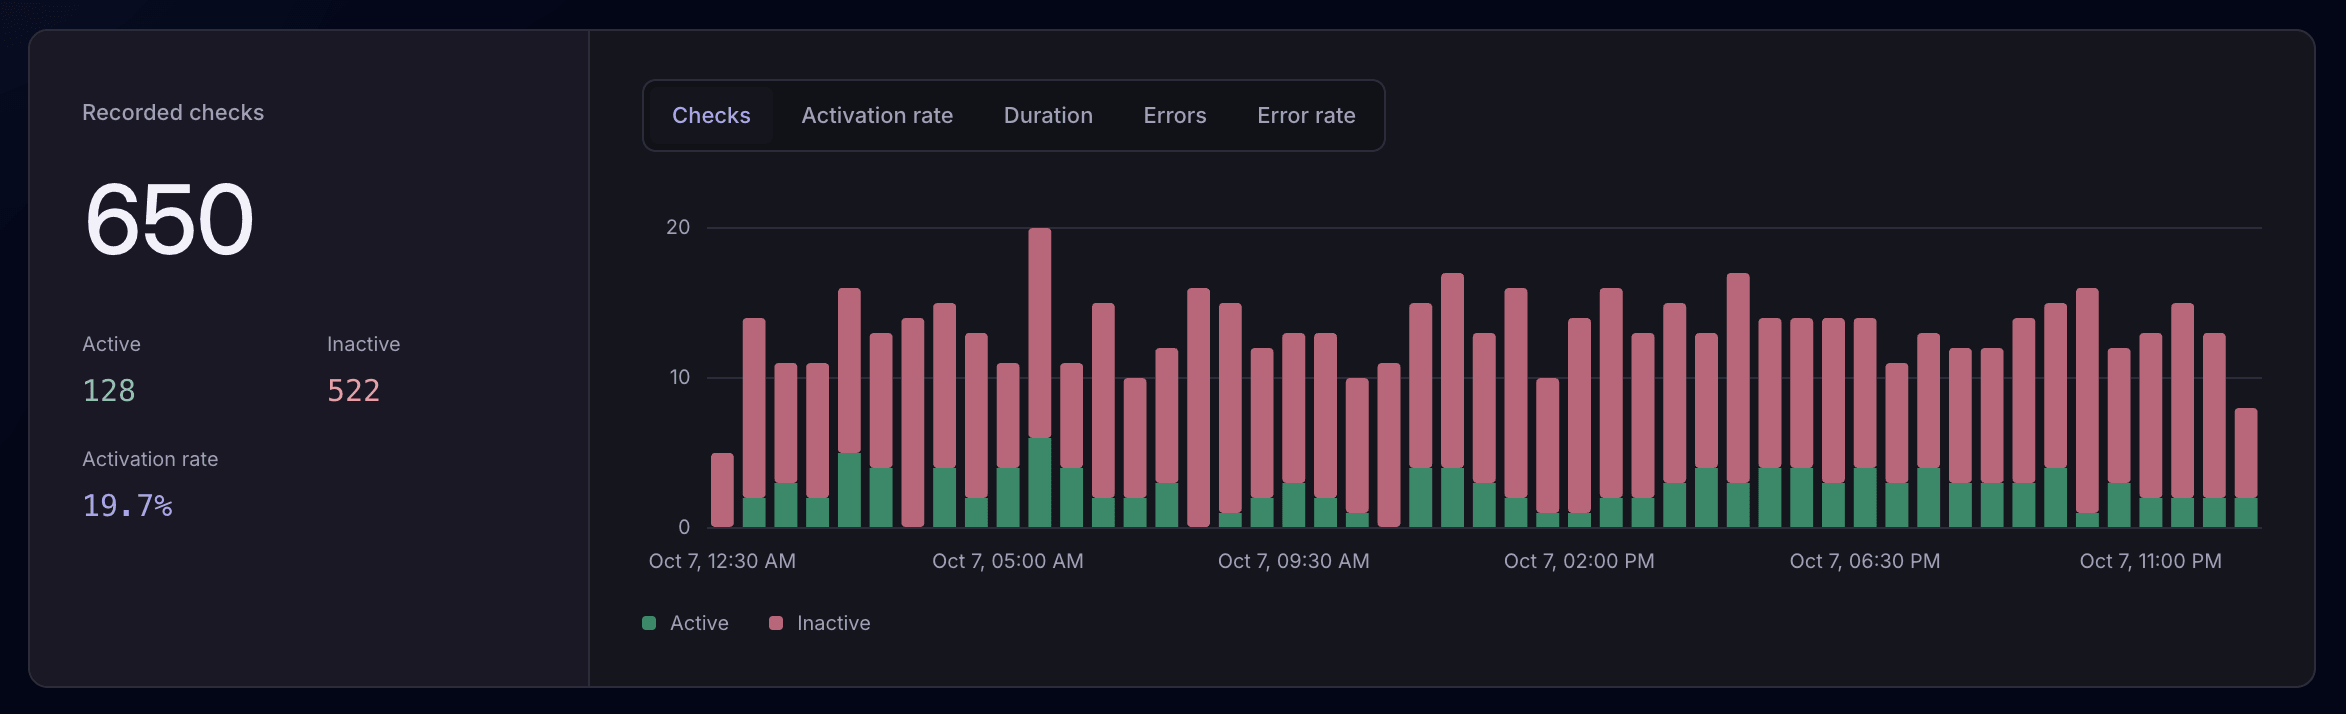
Understand flag usageRecorded checks and active outcomes.
Compare performance and errorsExecutions with active or inactive results.
Inspect the affected workOpen the request, job, command, or task.
See how often your app evaluated a flag in the selected period. A single request or job can check a flag more than once.
See the outcome recorded when each check happened. Results can vary by user, scope, or execution.
See the share of recorded checks that were active. This is a check-based percentage, not a percentage of unique users.
Your recorded feature flag inventory
Search flag names and compare checks, active and inactive results, and activation rates. Open a flag to explore its activity and related executions.
Use the inventory views to focus on flags with activations, inactive-only results, or no recorded checks in the selected period. The outcomes describe observed activity and can vary by user or execution.
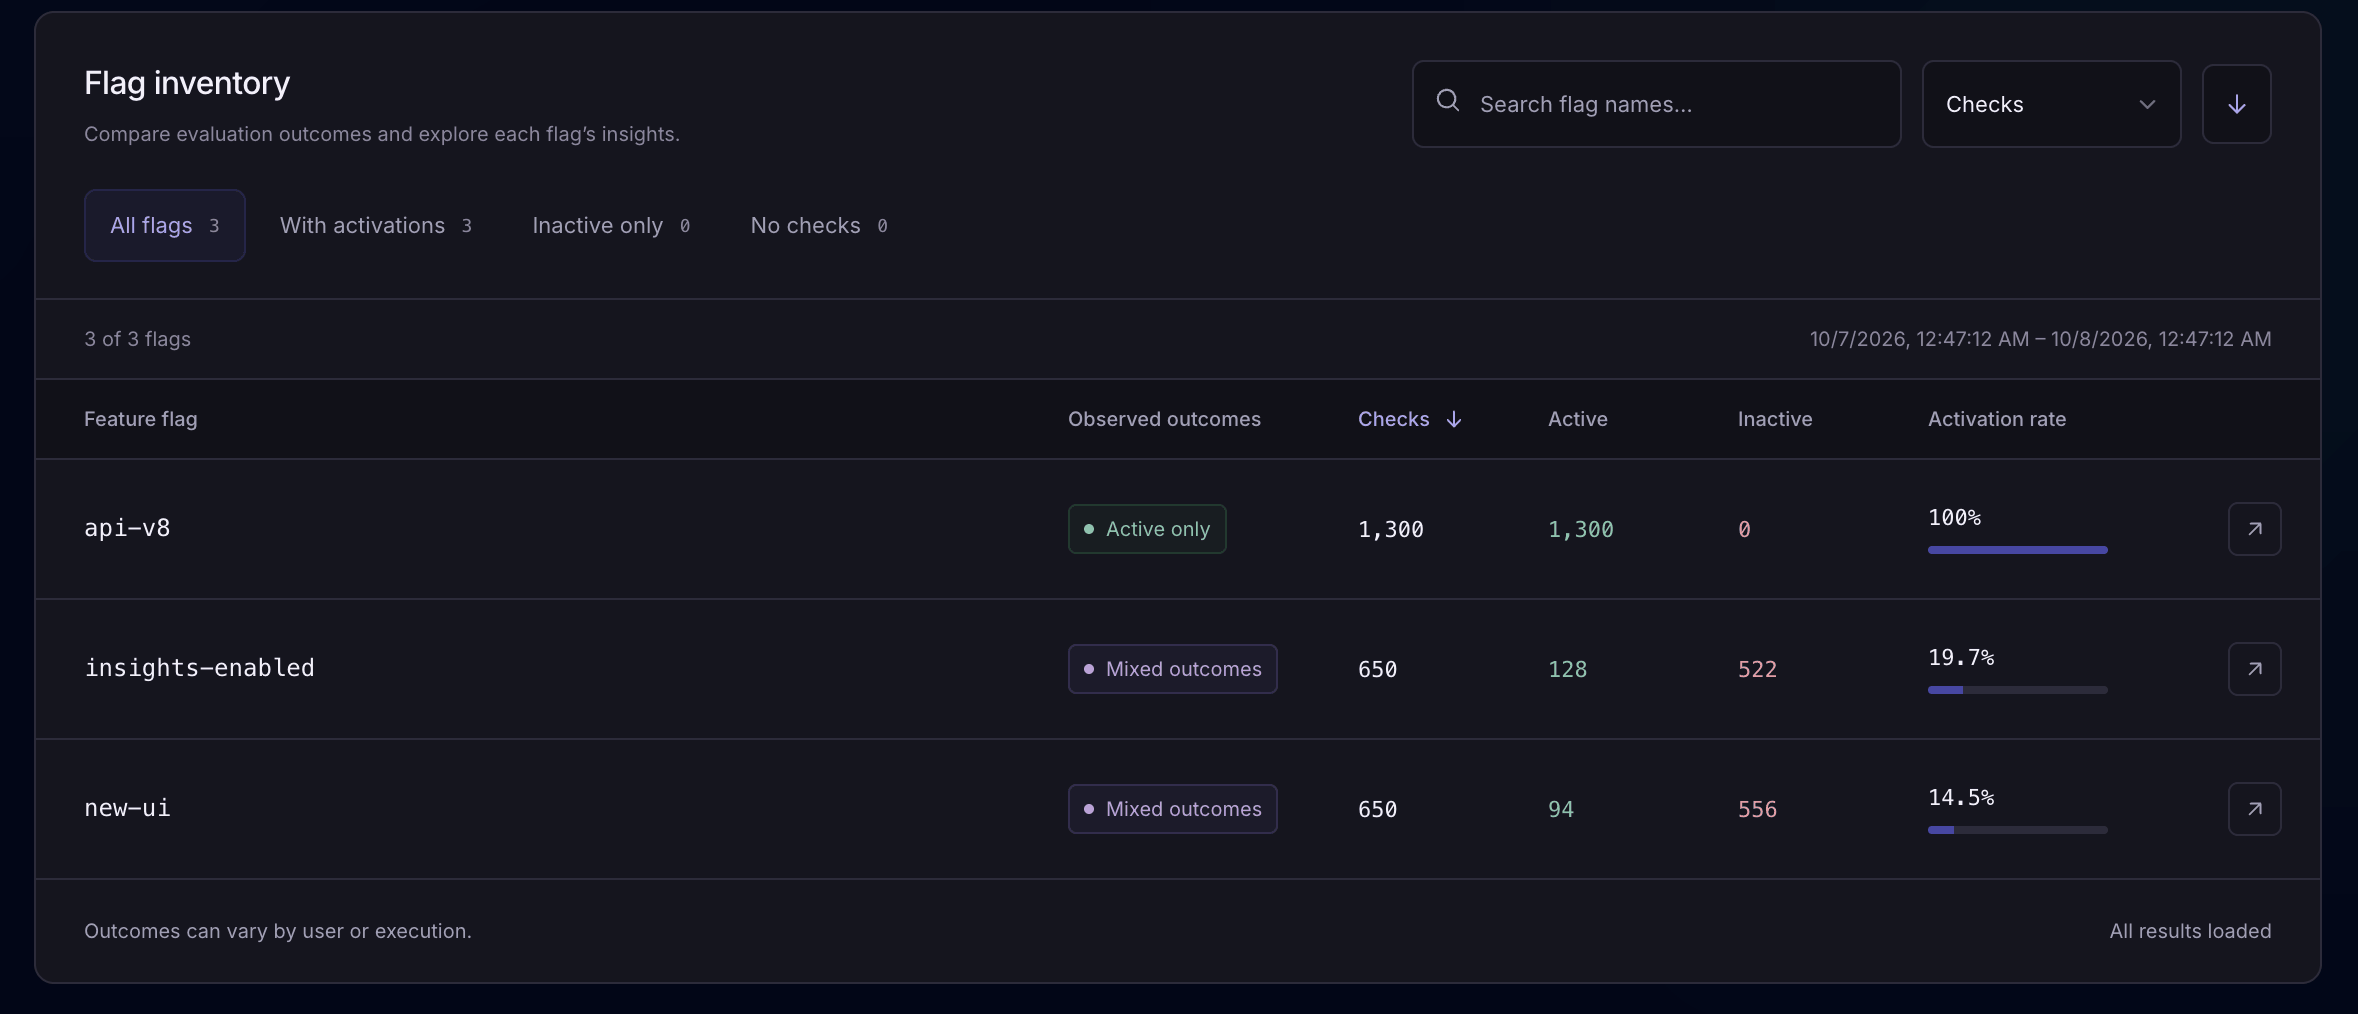
Search by name and compare check counts, active results, inactive results, and activation rates.
Active-only or mixed outcomes describe the checks Laritor observed in the selected period. They are not a global configuration setting.
If a known flag has no recorded checks, review the period, recording settings, and code paths before deciding it is unused.
Activation, performance, and errors
Follow activation trends and compare the executions where a flag was active or inactive. Use differences in duration or errors to choose what to investigate next.
These comparisons help you find patterns. Inspect the related work and account for traffic and workload differences before deciding what caused a change.
Follow active results over time to see how a rollout appears in recorded activity. Compare the same workload and time window when checking a change.
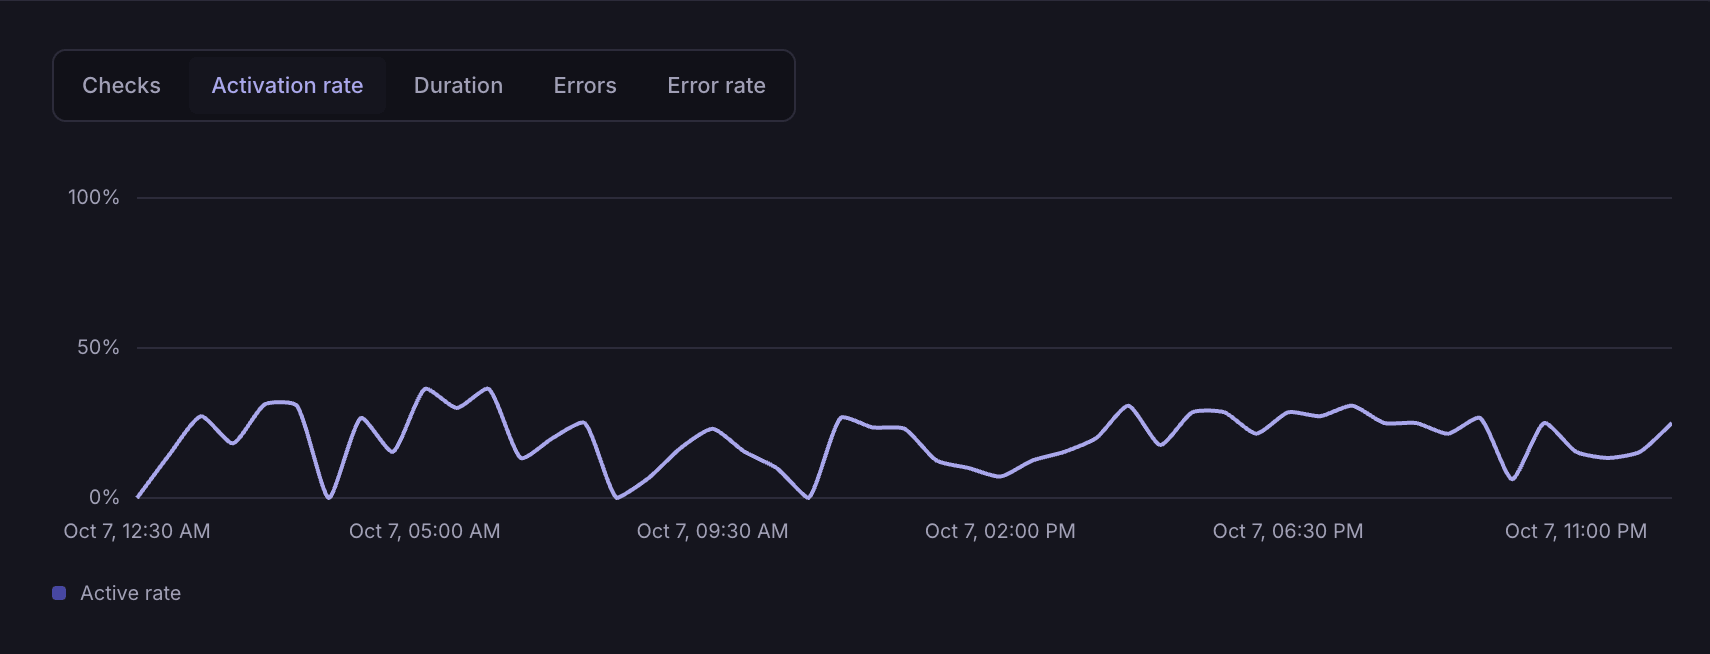
For example, 128 active checks out of 650 total checks give a 19.7% activation rate. A user or execution can contribute multiple checks.
Compare the durations of recorded executions where the flag was active or inactive. Look for a change worth investigating, then open related requests or jobs to inspect their queries, API calls, and other work.
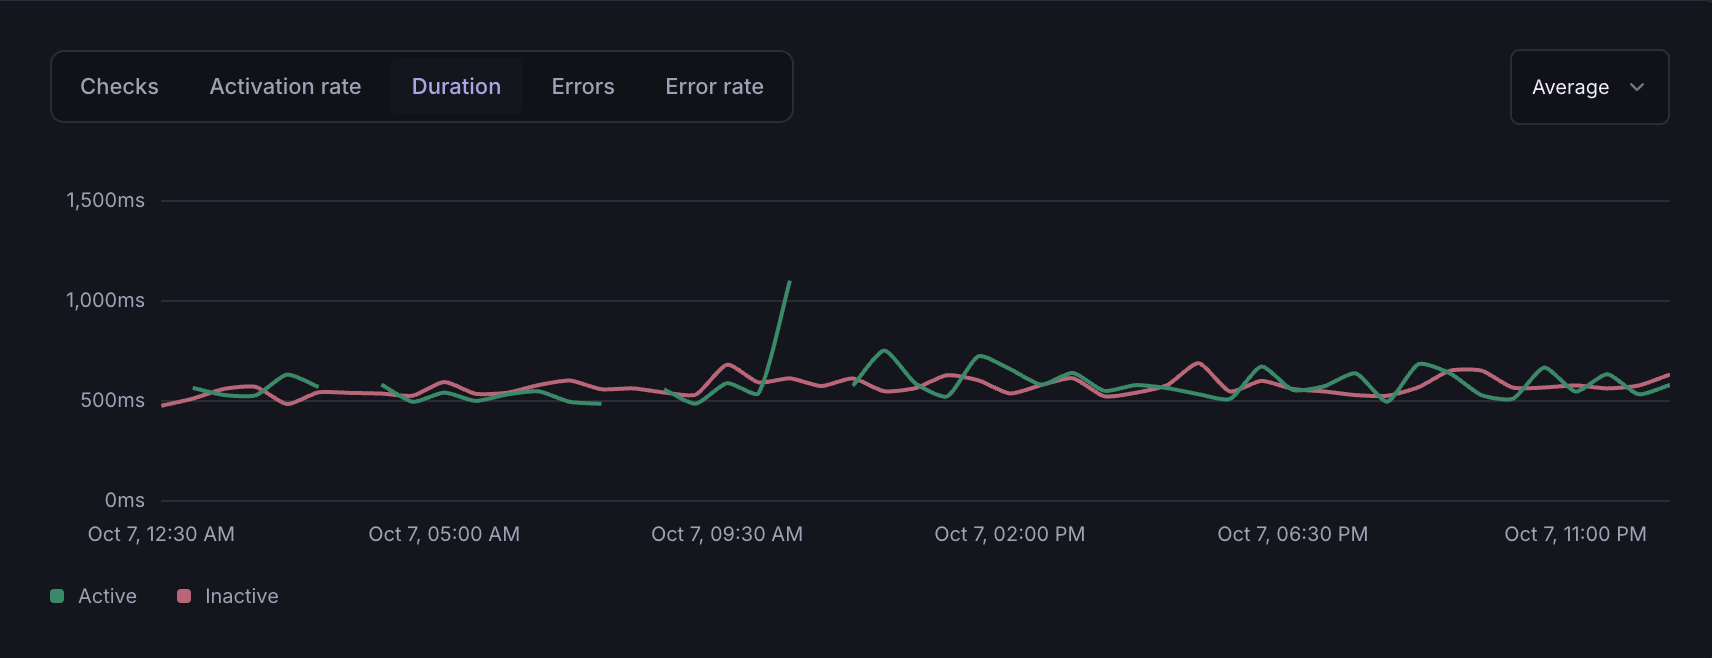
This measures the surrounding execution, not just the time spent evaluating the flag. Differences can also reflect traffic, user groups, and workload.
See recorded error counts alongside the flag outcomes. Use a change in errors as a starting point, then inspect the affected executions and exceptions to understand what failed.
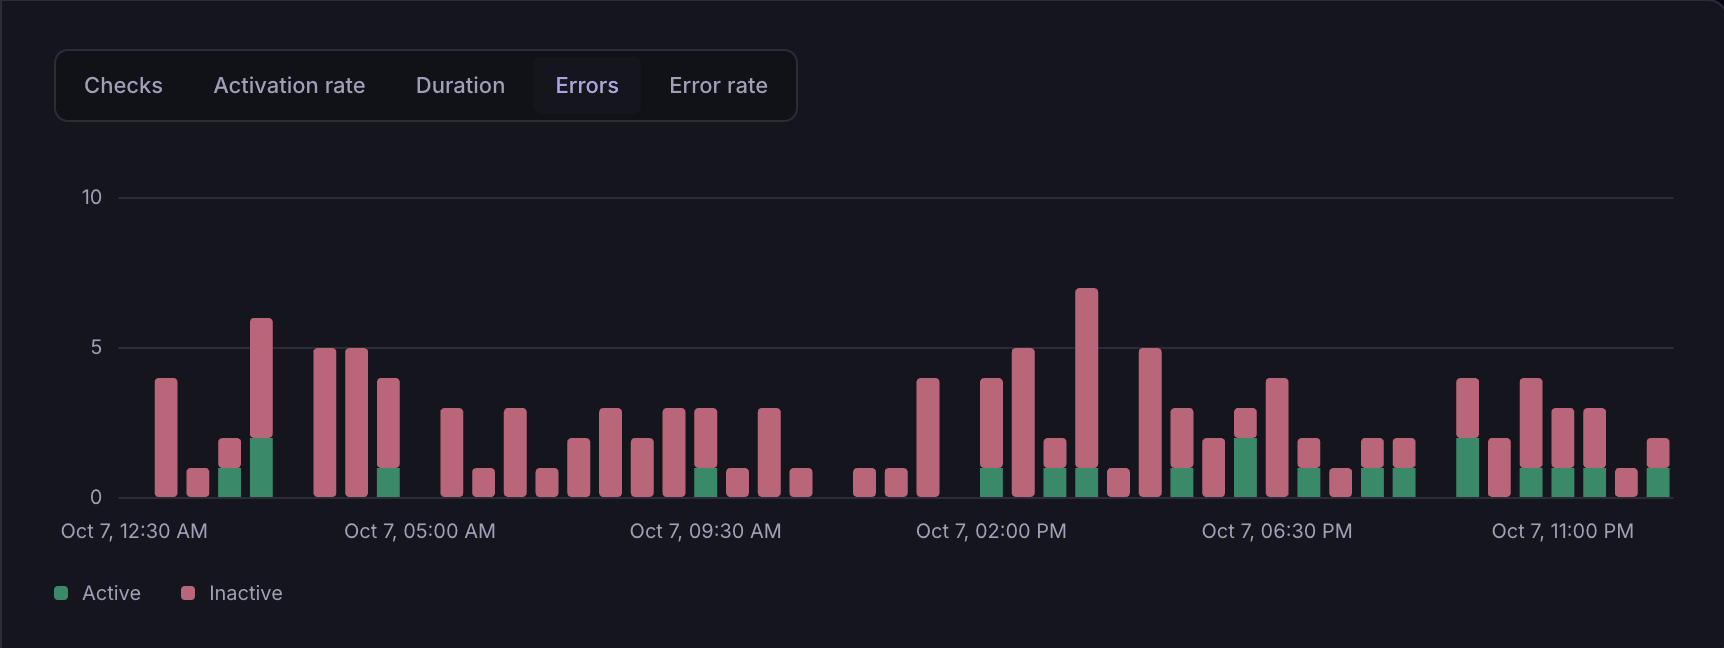
Compare error rates as well as counts when traffic differs. An error in an execution does not by itself prove the flag caused it.
Individual checks in execution context
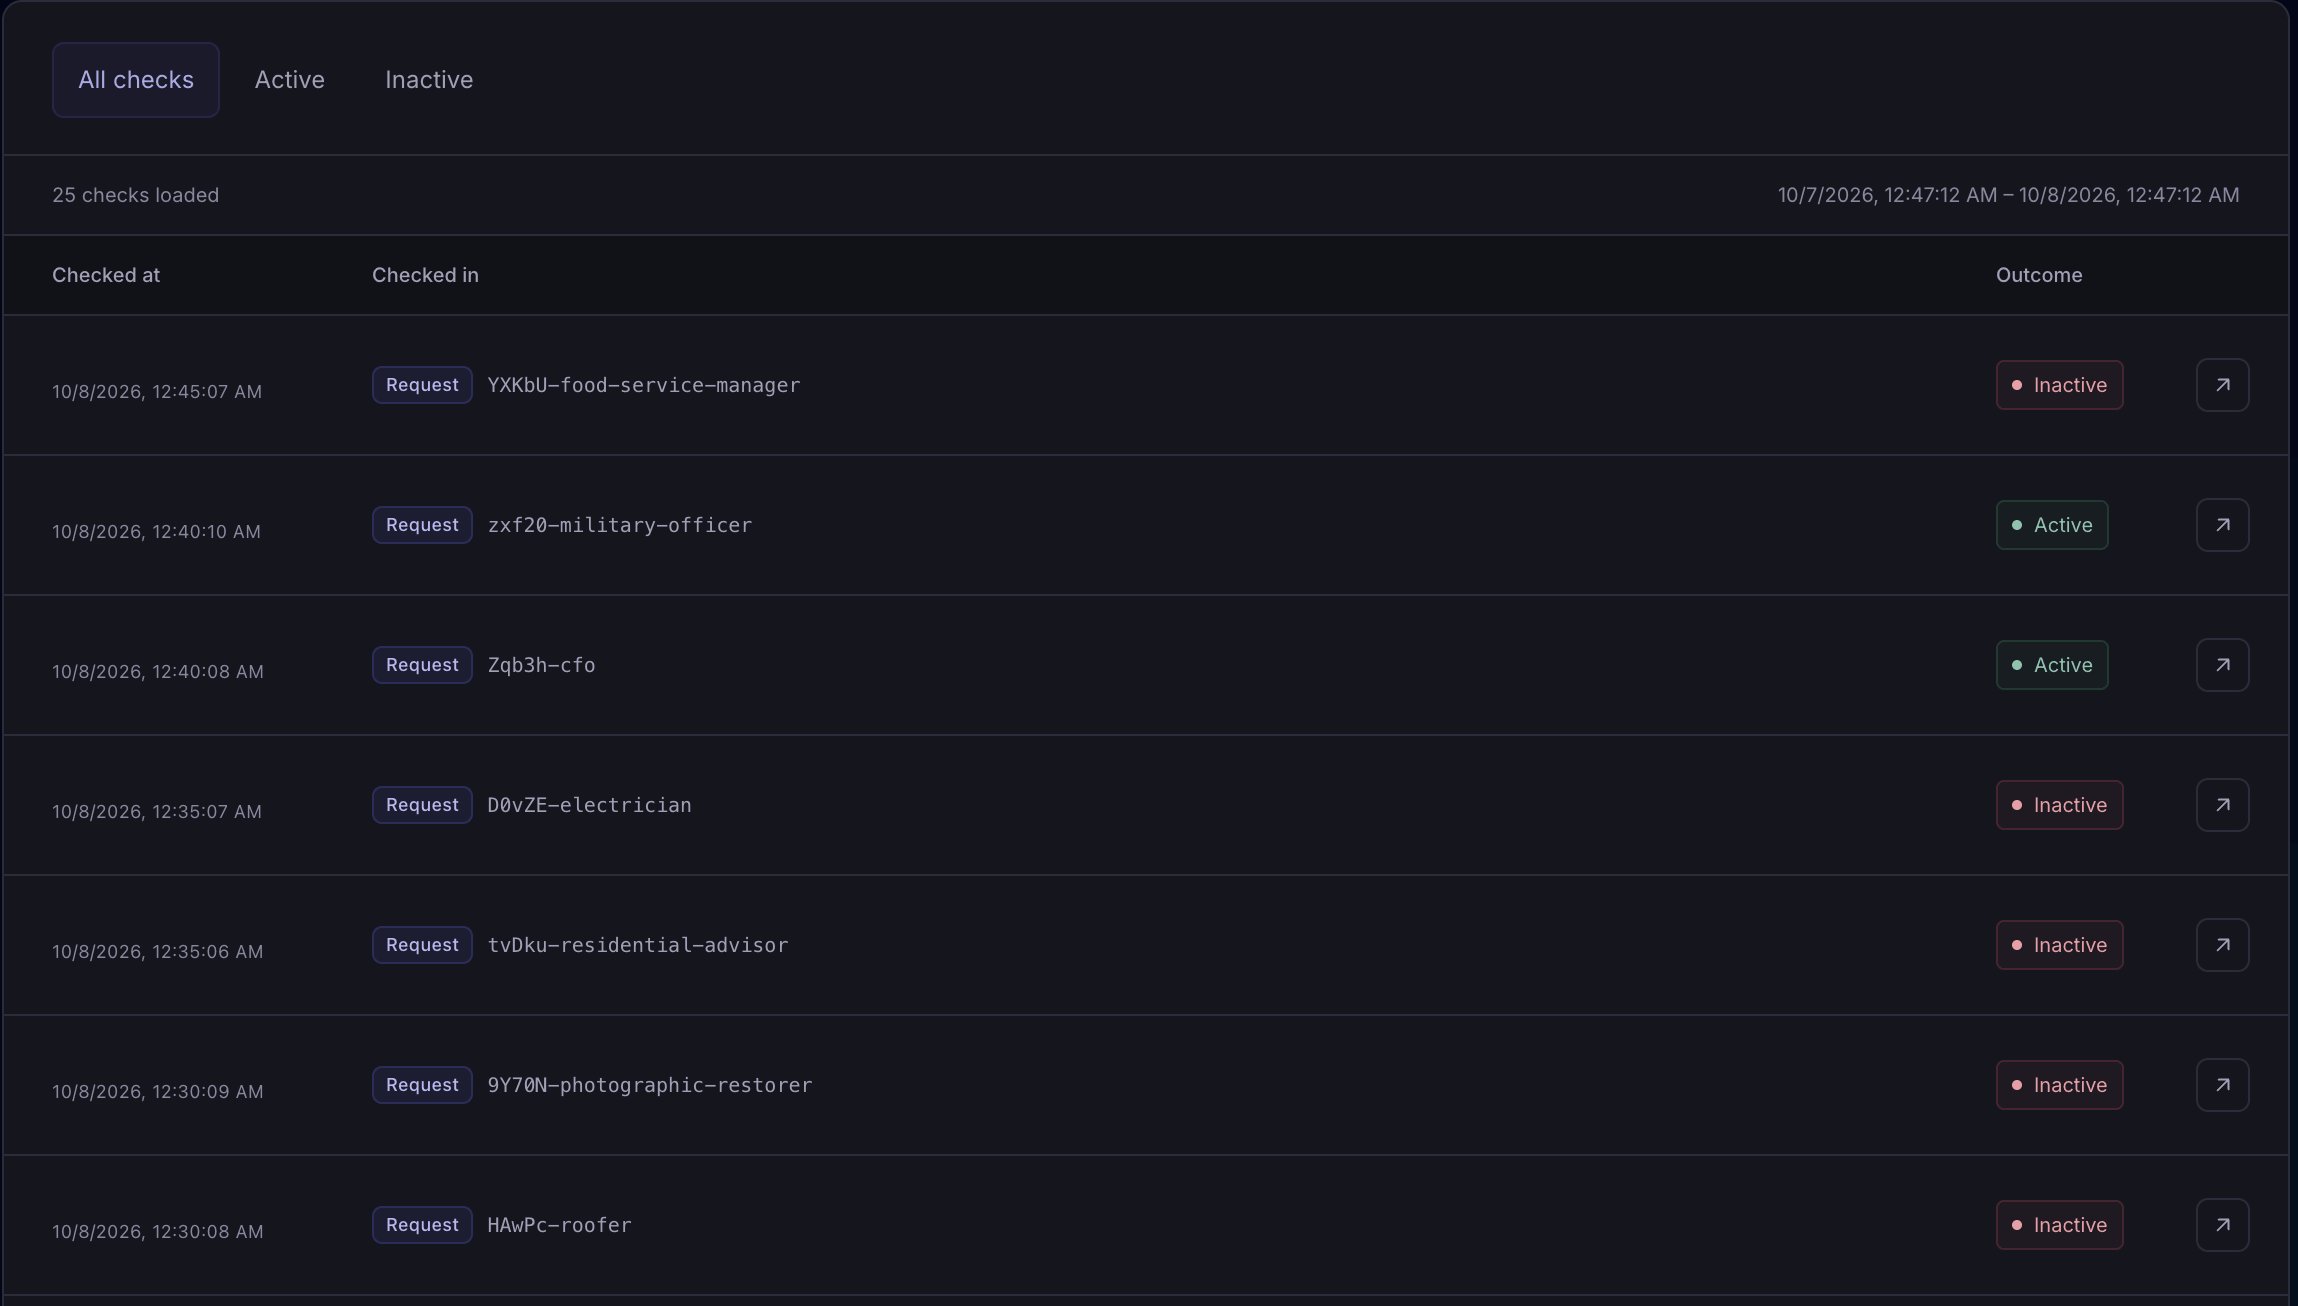
Open a flag’s checks to see when it was evaluated, whether it was active, and which execution checked it. Filter by active or inactive outcomes to focus your investigation.
Follow the origin to inspect the related queries, outbound requests, logs, exceptions, and other recorded events. Compare what your code did around the check.
Pennant and custom flag systems
A feature flag lets your code choose whether to enable a feature for a user, scope, or execution. Laritor records those decisions so you can investigate their behavior.
Keep your definitions, targeting, and rollout controls in Pennant or your existing flag system. Use Laritor to monitor the recorded checks and their surrounding activity.
Laritor hooks into Pennant to record flag checks, their active or inactive results, and the executions where they happened.
Install the current Laritor client and choose your recording settings. You do not need to add manual recording calls for Pennant.
Explore Pennant trackingEvaluate the flag in your existing system, then report its name and boolean result to Laritor.
use BinaryBuilds\LaritorClient\Recorders\FeatureFlagRecorder;

// Evaluate the flag using your existing system.
$isActive = feature_enabled('new-ui');

FeatureFlagRecorder::recordFeatureCheck(
    'new-ui',
    (bool) $isActive
);
Replace feature_enabled with the check your application already uses.
Investigate a rollout with recorded evidence
If a feature behaves differently than expected, start with its recorded results and compare the executions behind them.
Inspect database queries, API calls, and exceptions to understand what changed in the workflow.
Find the flag and review active and inactive results in the relevant period. Account for repeated checks and differences between users or scopes.
Compare execution duration and errors for both outcomes. Check workload and traffic differences before attributing a change to the feature.
Open affected executions and investigate their events. Make any code or rollout changes in your application or flag system, test them, then compare new recorded activity.
Use Laritor how you want
Keep flag context around exceptions, keep activity with detected issues, or record successful executions too.
Metrics describe the events you send. Exceptions-only and issue tracker modes may overrepresent problematic executions; full observability provides a broader basis for rollout comparisons.
Keep flag checks and related events when a request, job, command, or task contains an exception. Inspect the flag results recorded around the failure.
Useful for flag context when debugging exceptions.
Record occurrences with detected issues, such as a slow request or failed job. Inspect their flag checks alongside the other activity.
An inactive flag result is not itself an issue.
Record successful activity too. Compare flag usage, activation rates, duration, and errors across a broader set of executions.
Use this for a broader picture of rollout behavior.
Paid plans start at $20/month with 20M events included. Usage includes recorded flag checks and the other events you send. Filter unnecessary activity to reduce event usage. Estimate your usage
Recording and privacy controls
Flag names, scope information, and related execution data can contain private values. Laritor applies redaction before recorded data leaves your app, and lets you customize the rules for your application.
Explore privacy controlsUse recordFeatureFlag($flag, $scope) to filter checks you do not want to send.
Mask or remove sensitive strings and structured values with the client’s customizable redactors.
Check what your app sends after configuring recording and redaction. Retain useful flag results while removing private information you do not need.
Laravel feature flag monitoring questions
Answers about Pennant, custom checks, activation rates, performance comparisons, and recording settings.
Laravel feature flag monitoring helps you understand where your app checks flags, what outcomes it records, and how the surrounding executions behave. Laritor shows flag check counts, active and inactive outcomes, activation rates, execution duration, errors, and links to the requests, jobs, commands, or scheduled tasks behind individual checks.
Yes. The Laritor Laravel client hooks into Pennant to capture flag evaluations, their active or inactive results, and the execution where they happened. No extra recording calls are needed for Pennant. The events sent depend on your recording mode and filters.
Yes. Evaluate the flag in your existing system, then call FeatureFlagRecorder::recordFeatureCheck with the flag name and a boolean active or inactive result. Laritor can include that check in its insights and related execution context. Your application still decides the flag outcome.
Activation rate is active checks divided by total recorded checks, multiplied by 100. For example, 128 active results out of 650 checks give a 19.7% activation rate. This counts evaluations, not unique users. A single user, request, or job can contribute more than one check.
No. Active-only means the observed checks were active in the selected period. Results can vary by scope, user, or execution, and recording modes and filters limit what is sent. The inventory shows observed outcomes rather than a global flag configuration.
Yes. Laritor shows execution duration and errors grouped by recorded flag outcome. These are metrics for the surrounding executions, not just the time spent evaluating the flag. Differences can reflect traffic, user groups, or workload, so inspect related events before concluding that a feature caused a slowdown or failure.
Yes. The checks view shows the evaluation time, active or inactive outcome, and originating execution. Filter by outcome and open the recorded request, queued job, Artisan command, or scheduled task to inspect related queries, logs, API calls, exceptions, and other events.
The Laritor feature flag view monitors the checks your application records. Configure your flag definitions, targeting, and rollout changes in Pennant or your existing flag system. Use the observed activity in Laritor to investigate how those changes behave.
No. Exceptions-only and issue tracker modes retain related flag checks from occurrences that are kept. Full observability also records successful activity for broader comparisons. Activation rates, duration, and errors reflect recorded data, so filtered modes may overrepresent problematic executions.
Yes. Use recordFeatureFlag with the flag and scope to choose which checks are recorded. Laritor applies redaction before data leaves your app, and you can customize redactors for sensitive strings and structured fields. Review flag names, scope information, and related execution data to check what is sent.
Install in under 1 minute
Add Laritor’s Laravel client, choose a recording mode, and start monitoring Pennant or custom feature flag checks in your app.
Free trial: 300K events · Unlimited apps and users