Changelog

What’s New in Laritor

We ship fast and improve constantly. Follow along with updates that help you debug faster, reduce noise, and get deeper visibility into your Laravel applications.

July 10, 2026

zAI integration for AI-powered performance analysis and exception resolution

Laritor now supports zAI integration so teams can connect their own zAI API key and use AI analysis across application telemetry. This helps uncover query performance issues, investigate database slowdowns, optimize request duration, and resolve exceptions faster with more targeted guidance.

  • Added zAI integration for Laritor AI analysis.
  • Users can now connect their own zAI API key.
  • AI analysis can help identify query performance issues and database bottlenecks.
  • Use AI guidance to optimize request duration and investigate slow application paths.
  • AI-assisted workflows now help teams resolve exceptions faster with more actionable debugging context.

Connect your zAI key in Laritor to start using AI-assisted performance analysis and exception investigation.

July 3, 2026

Telegram alerts and live dashboards for always-on monitoring

Laritor now supports Telegram as an alert destination and adds live dashboard URL controls for always-on monitoring screens. Teams can route incidents directly into Telegram chats and configure dashboards to auto refresh with a default timeline for office monitors, NOC displays, and ops wallboards.

  • Added Telegram integration for alert delivery.
  • Teams can now send Laritor alerts directly to Telegram chats for faster operational response.
  • Added live dashboard support through URL query parameters.
  • Use `refresh` to auto refresh dashboards on a chosen interval, with a minimum supported value of 10 seconds.
  • Use `timeline` to open dashboards in a specific default time range such as `1h`, `24h`, or `7d`.

Use Telegram alerts and live dashboards together to keep incident channels and wallboards in sync.

June 30, 2026

Route Insights page for detailed route-level visibility

Laritor now includes a dedicated Route Insights page that gives you route-specific visibility into application performance. Inspect activity for a single route across a selected date range, review key throughput and latency metrics, and spot slowdowns or failures without sifting through unrelated request traffic.

  • Added a dedicated Route Insights page for analyzing a specific route in detail.
  • Review route-specific performance and activity within any selected date range.
  • Get clearer visibility into latency trends and route behavior without filtering through the full requests index.
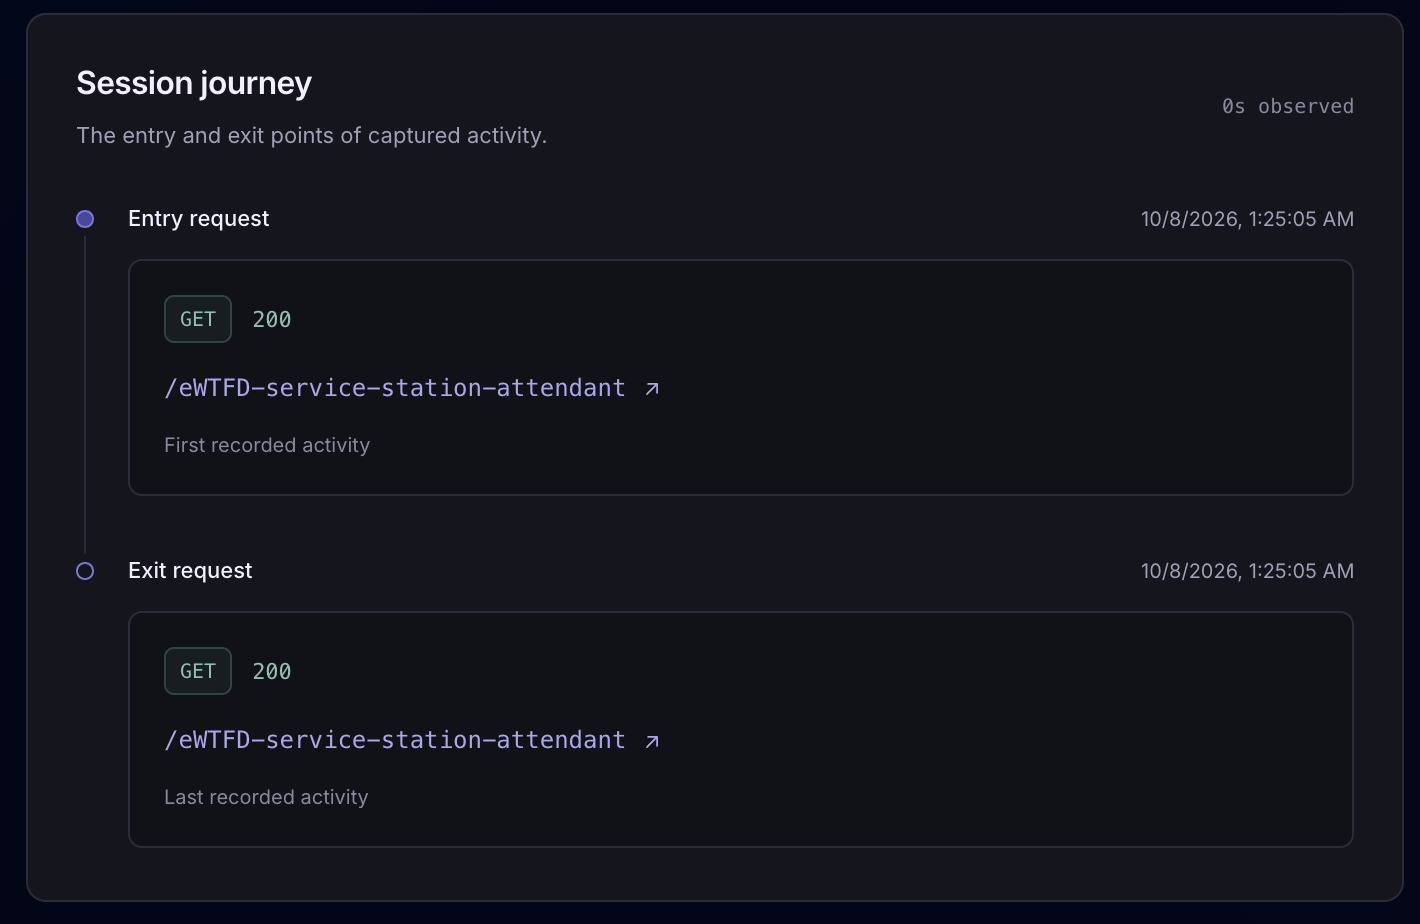
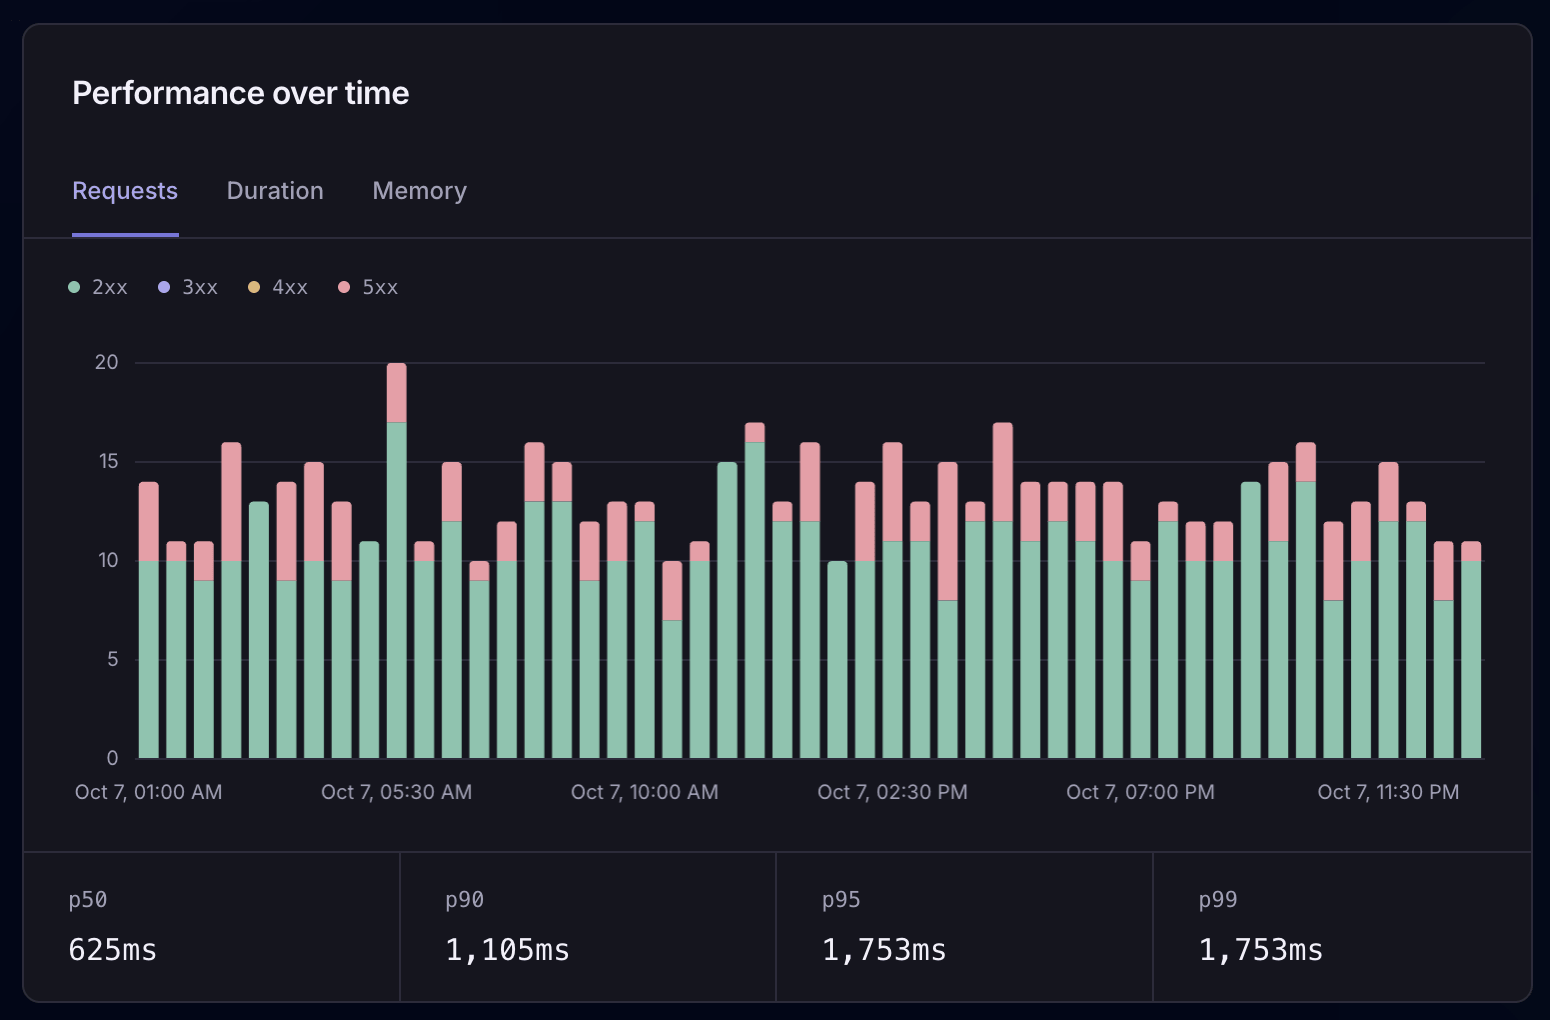
Laritor Route Insights page showing detailed metrics and trends for a specific route.

Open Route Insights in Laritor to investigate how an individual route is performing.

June 7, 2026

Job Insights

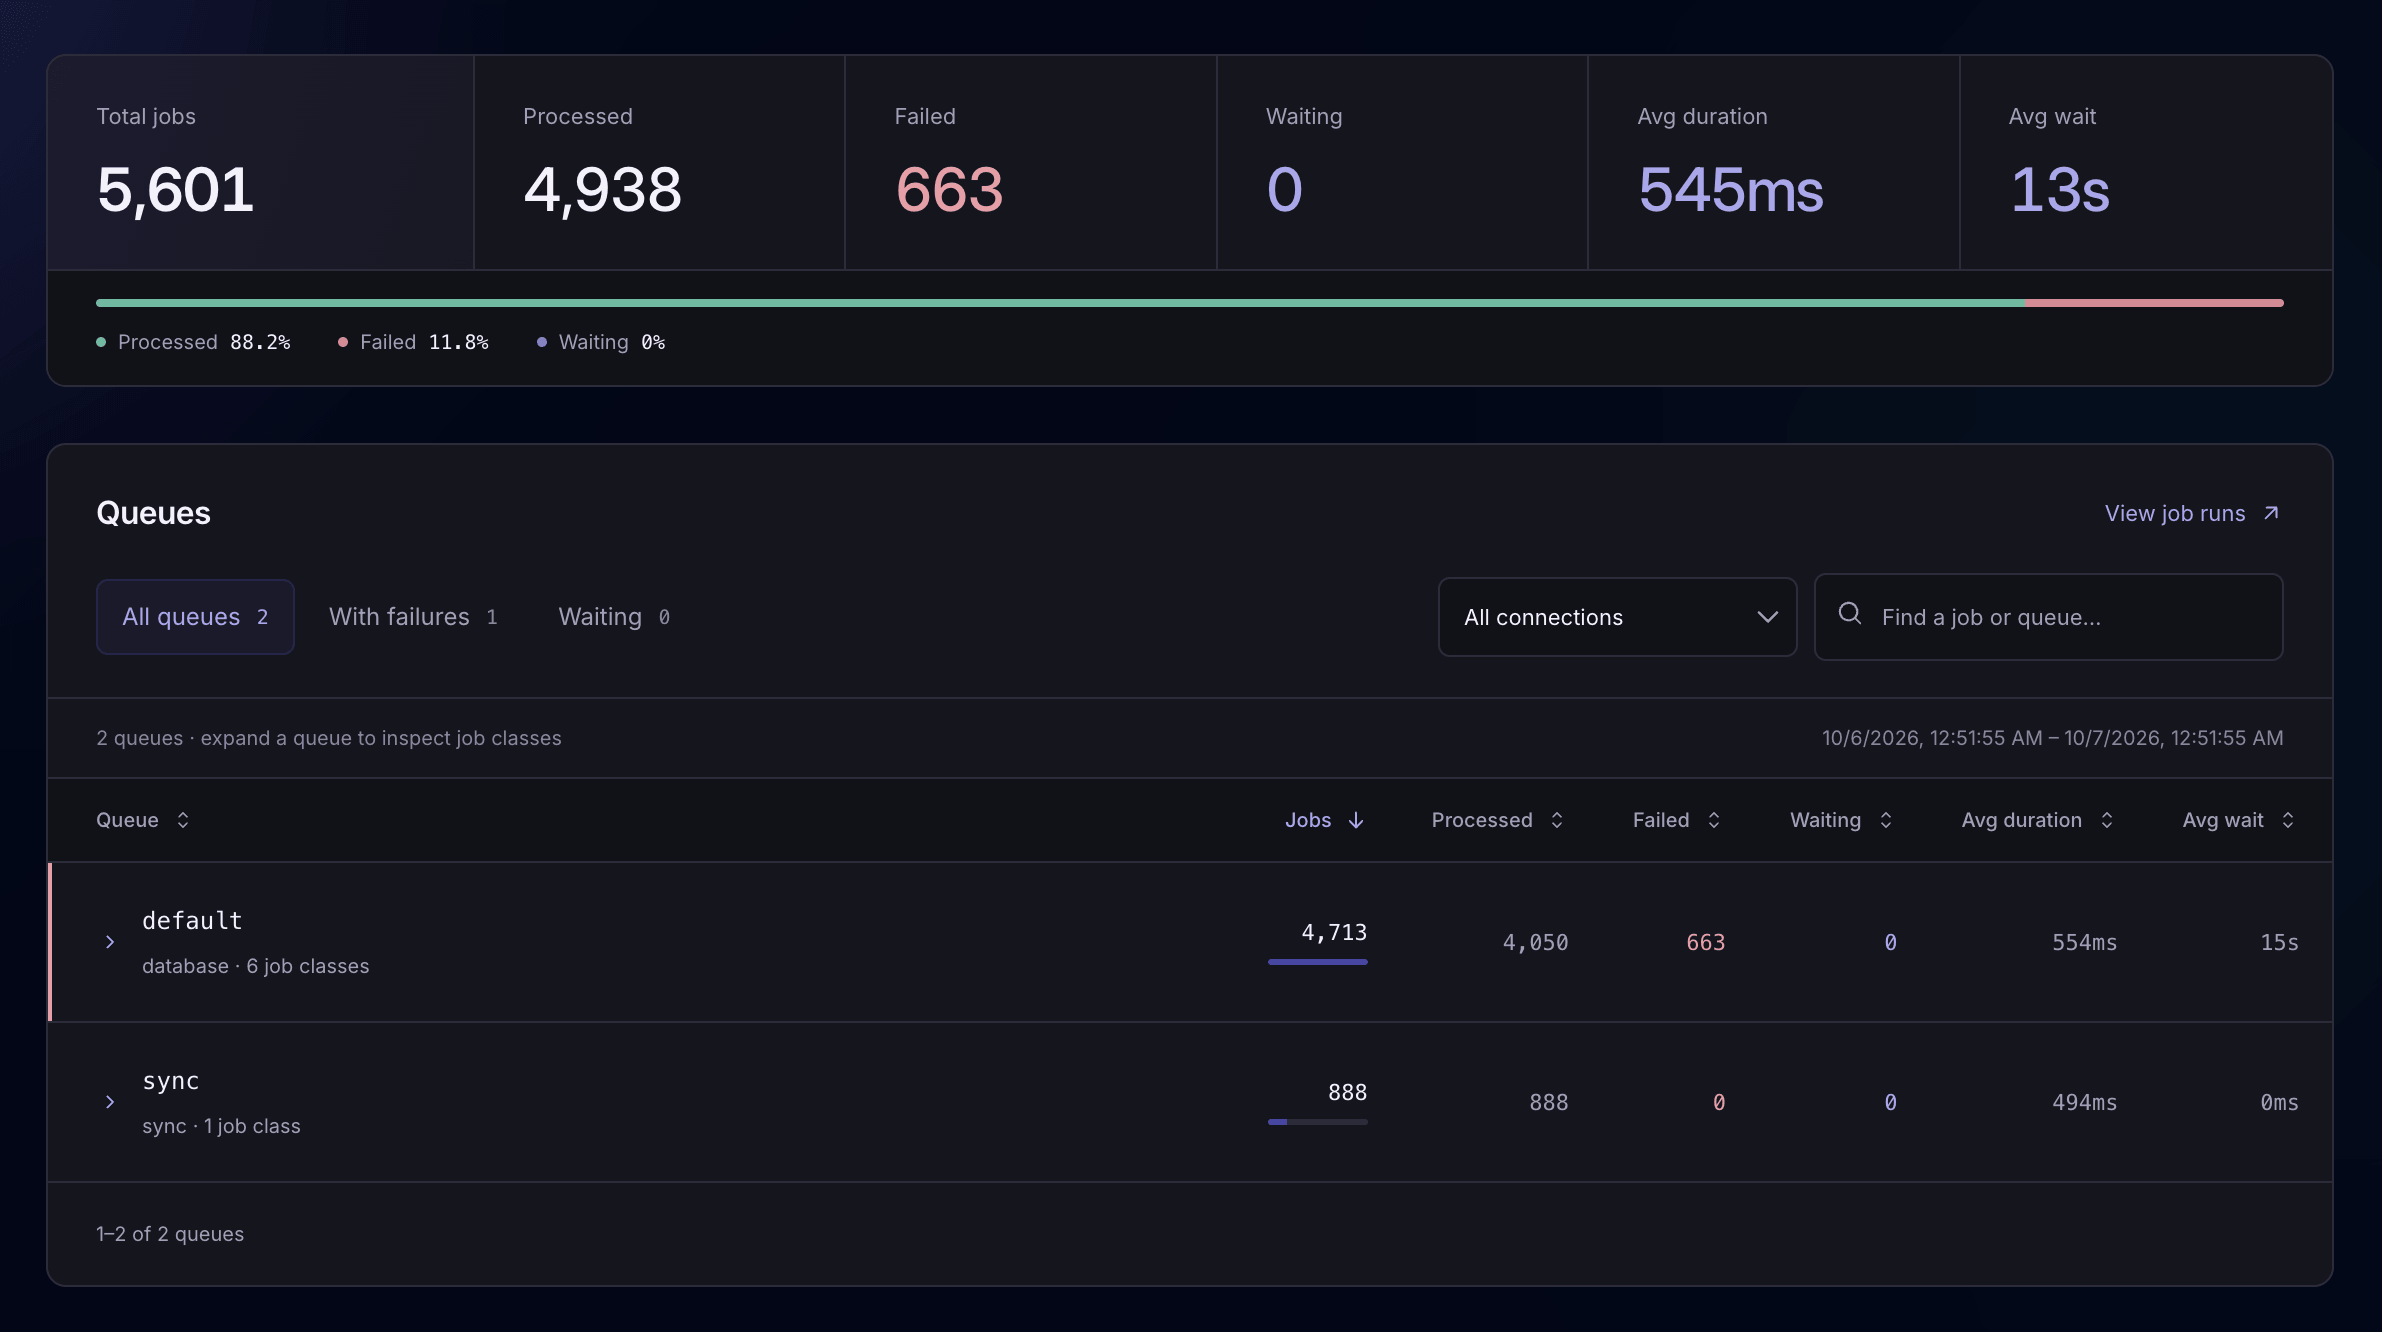
Laritor now includes a dedicated Job Insights page for understanding queue performance at a glance. Review total, processed, failed, and pending jobs alongside average duration and wait time for any selected date range. Drill into the data by connection, queue, and individual job to quickly spot bottlenecks, failing jobs, and slow workers before they become bigger issues.

  • Monitor queue activity across any selected date range from a dedicated Job Insights page.
  • See total, processed, failed, and pending jobs together with average duration and average wait time.
  • Drill down by connection, queue, and individual job to find bottlenecks and failing work faster.
Laritor Job Insights page showing queue performance metrics and drill-down views.

Open Job Insights in Laritor to see where your queue time is going.

May 14, 2026

Quick date filters now available across all Laritor pages

Laritor now includes quick date filters across all pages so teams can instantly narrow data to common recent time ranges without manually setting date windows.

  • Added quick date filters on all Laritor pages.
  • Users can instantly filter data for the past 5 minutes, 15 minutes, 30 minutes, 1 hour, 3 hours, 6 hours, 12 hours, 24 hours, 3 days, 7 days, 14 days, and 30 days.
  • Makes it faster to move between short-term incident investigation and broader trend analysis.

May 4, 2026

Custom event tracking across timelines and analytics views

Laritor now supports custom events so teams can mark important application moments, trace them in execution timelines, and analyze event occurrence trends over time.

  • Added support for sending custom events from the Laritor client ingest package.
  • Custom events now appear on timeline views for requests, jobs, scheduled tasks, and commands in the correct execution order.
  • Each custom event can include attached metadata for additional debugging and operational context.
  • Added a Custom Events page that shows total event occurrences during a selected timeframe.
  • Users can drill into individual events to see occurrence graphs and a table of every occurrence with its trigger context and metadata.

April 3, 2026

Linear and GitHub issue automation plus a redesigned alerts page

Laritor now creates issues in Linear and GitHub automatically when problems are detected, and the alerts page has been redesigned for simpler channel management.

  • Added Linear and GitHub integrations.
  • Laritor can now automatically create issues in Linear and GitHub when an issue is detected.
  • Redesigned the alerts page to make global alert channel configuration easier.
  • Added support for overriding alert channels per environment from a single page.

March 25, 2026

Laravel 13 support for the client ingest package

The Laritor client ingest package now supports Laravel 13.

  • Added Laravel 13 support for the Laritor client ingest package.

March 1, 2026

Billing page now shows usage breakdowns and cost projections

The billing page now gives teams clearer visibility into event usage, current spend, and projected end-of-month costs.

  • Improved the billing page to show event usage and cost projections.
  • Clearly shows which event types are consuming your usage.
  • Displays your current cost so far and projected end-of-month costs.

February 27, 2026

New issues page for operational problems across the app

Laritor now includes a dedicated issues page that surfaces important application problems in one place.

  • Added an issues page that highlights failures and suspicious activity across the application.
  • The page surfaces problems such as failed requests, bot requests, failed jobs, and failed scheduled tasks.
  • Gives teams a faster way to review operational issues without jumping between multiple sections.

February 4, 2026

Livewire request detection and hydration visibility

Laritor now detects Laravel Livewire requests and captures the component and hydrated data involved in each interaction.

  • Added Laravel Livewire support.
  • Laritor can now detect incoming Livewire requests automatically.
  • Captures the Livewire component and the data being hydrated for better debugging context.

January 22, 2026

Feature flag performance tracking and PHP 8.5 support

Laritor now helps teams analyze feature flag performance and adds PHP 8.5 support to the Laritor client ingest package.

  • Users can now track and analyze the performance impact of their feature flags.
  • Added PHP 8.5 support to the Laritor client ingest package.

January 8, 2026

Richer user context, cache filtering, and better AI suggestions

Laritor now captures more authenticated user metadata, adds cache event filtering for writes and deletes, and improves AI suggestions with better application context.

  • Added support to capture additional user attributes for authenticated users such as role, team ID, subscription status, and similar metadata.
  • Users can now filter by cache write and cache delete event types on the cache page.
  • Improved AI-based suggestions by providing improved context about the application.

Laravel observability, without the guesswork

See requests, jobs, queries, cache activity, and failures in one place

Laritor helps your team catch regressions faster with Laravel-native monitoring, issue detection, alerts, and release context built for production debugging.