
Laritor
Yes
Laritor vs Flare
Laritor tracks exceptions, detects issues, and monitors Laravel performance. Follow requests, queues, queries, and user sessions in one place. Build your own dashboards, inspect server resources, and debug with in-app AI or your coding agent through MCP.
Published by Laritor · Comparison checked · View comparison notes
Designed primarily for Laravel. All tools compared here support Laravel.
Yes
Yes
Why choose Laritor over Flare?
Flare now offers performance monitoring and logs alongside error tracking. Laritor brings those everyday Laravel investigations together with customizable dashboards, session journeys, feature flag insights, and server monitoring.
The full feature comparison
Compare 35 capabilities. See where Laritor gives you more, where Flare has an advantage, and what both tools offer.
“Not listed” means a dedicated feature was not found in the public documentation reviewed. Custom instrumentation or an integration may offer another way to meet that need. Both tools have performance monitoring, logs, AI, and MCP.
Custom views, feature flag insights, session journeys, server resources, and scheduled reports.
| Capability | Laritor | Flare |
|---|---|---|
| Customizable dashboards | 85+ widgets Unlimited dashboards with 85+ widgets. Arrange charts around each team and application. | Built-in performance dashboard. A custom widget dashboard builder is not listed in reviewed docs. |
| Feature flag performance | Dedicated flag insights Automatic Pennant tracking, activation rates, execution durations, and related errors. | Flag states can be attached as context. Dedicated feature flag analytics are not listed. |
| Custom health checks | Monitor dependencies Built-in and custom checks, status history, and failure alerts. | A built-in custom health check resource is not listed in reviewed docs. |
| Server CPU, memory, and disk metrics | Code and server resources Resource usage charts with optional scheduled metric collection. | Host, OS, PHP, and Composer metadata. CPU, memory, and disk usage charts are not listed. |
| Queue wait time insights | Find queue bottlenecks Compare dispatch delay, worker wait, execution duration, and queue throughput. | Job timing and chains are supported. A dedicated queue wait time dashboard is not listed. |
| Session request journeys | Follow a user’s journey Follow the recorded Laravel requests in a session, with related users and events. | Session data is captured on requests. A server-side session request journey view is not listed. |
| Suspicious and bot traffic views | Understand automated traffic Dedicated bot and suspicious request filters with customizable detection. | Request IP and user agent context. Dedicated bot and suspicious traffic views are not listed. |
| Database schema explorer | Schema-aware debugging Browse tables, columns, indexes, and relationships, with AI assistance. | Query performance is supported. A database schema explorer is not listed. |
| Custom daily and weekly PDF reports | Reports without logging in Choose metrics and email scheduled PDF snapshots to your team. | Custom scheduled PDF performance reports are not listed in reviewed docs. |
| Three ready-to-use recording modes | Record what matters Exceptions only, issues only, or full observability, with related events in each retained execution. | Error collection and configurable trace sampling. The same three named recording modes are not listed. |
| In-app AI provider choice | Choose your in-app provider Use included prompts or connect your own provider, including Anthropic, OpenAI, Gemini, and Ollama. | Flare Assistant uses OpenAI. External MCP and CLI clients can use your preferred AI tool. |
| Outbound API payload investigation | Inspect API bodies Optionally capture API request and response bodies, headers, and status, with redaction. | Standard HTTP recorder documents headers, status, and body sizes, rather than captured body contents. |
| Command and scheduled task output | Read what the command printed Opt-in console output alongside execution details and related events. | Command name, arguments, and exit code. Console output capture is not listed. |
| Dedicated custom event views | Explore business milestones Named business events appear in execution timelines, a custom events index, and dashboards. | Custom spans and span events support your own instrumentation. A separate business event dashboard is not listed. |
Browser monitoring, Livewire profiling, built-in error collaboration, and a GitHub-connected AI assistant.
| Capability | Laritor | Flare |
|---|---|---|
| JavaScript and frontend framework monitoring | Laravel backend monitoring, including requests from your frontend. | PHP and JavaScript SDKs, with React, Vue, and Svelte integrations. |
| Browser performance and Core Web Vitals | Server-side Laravel request and route performance. | Browser page traces and Core Web Vitals, including LCP, INP, and CLS. |
| Livewire component profiling | Inspect the Laravel request and the events produced by the component. | Dedicated component spans for mounting, calls, rendering, and dehydrating. |
| Built-in error assignment and snoozing | Exception investigation and linked GitHub or Linear issues for team follow-up. | Assign errors, set priorities, comment, and snooze notifications in Flare. |
| In-app AI pull request workflow | AI recommendations in Laritor; use MCP with your coding agent to work on a fix. | Flare Assistant can read GitHub code and open an approved draft pull request. |
| Spatie ecosystem | An independent monitoring product built for Laravel. | Built by Spatie, the team behind Ignition and many Laravel packages. |
Both tools track Laravel errors, performance, and logs, with AI and MCP. The workflows and captured data differ.
| Capability | Laritor | Flare |
|---|---|---|
| Laravel exception tracking | Grouped exceptions, file and line, stack traces, occurrence history, and recorded events. | Grouped errors, stack traces, occurrence history, and Laravel execution context. |
| Request and route performance | Duration metrics, route insights, failure rates, and recorded request details. | Route performance aggregates, duration metrics, breakdowns, and retained traces. |
| Jobs and Artisan commands | Failures, duration, execution details, and related events. | Failures, duration, retained traces, and related job chains. |
| Queries and external HTTP timing | Find slow SQL and API calls in the execution that triggered them. | Query and HTTP call aggregates linked to their routes, jobs, and commands. |
| Execution timelines | Inspect retained queries, logs, API calls, cache activity, and other events in order. | Inspect recorded spans and span events in a trace timeline. |
| Application logs | Search Laravel logs and custom log entries with their recorded execution context. | Search logs by message, severity, host, and entry point, with trace correlation. |
| Custom instrumentation | Add named custom events and metadata to explain your own application workflows. | Add custom spans, span events, glows, and context to explain your own code. |
| Request headers, payload, and session context | Optional headers, bodies, session data, and user context with field controls. | Request headers, body contents, cookies, session data, and authenticated user context. |
| Sensitive data controls | Client-side redaction and collection controls before ingestion. | Client-side censoring for bodies, headers, IPs, and other collected data. |
| Exception tracking without performance traces | Choose exceptions-only recording and retain the related execution events. | Disable performance tracing while continuing error reporting. |
| In-app AI and MCP support | In-app guidance plus read-only MCP access to exception details and recorded timelines. | Flare Assistant plus MCP access to errors, logs, and performance; optional error management actions. |
| Email and chat notifications | Email, Slack, Discord, Teams, Telegram, and webhooks. | Email, Slack, Discord, Teams, Telegram, and webhooks. |
| Unlimited projects and users for teams | Unlimited apps and users on the paid plan. | Unlimited projects and users from Standard upward; Hobby is limited. |
| 30-day data retention | 30 days on the standard paid plan. | 30 days on every listed plan. |
| No required ingestion daemon | Send application events directly from the Composer client. | Send directly by default; an asynchronous daemon is optional. |
Major difference
Laritor goes beyond errors and performance traces with dedicated Laravel resource views, user journeys, and dashboards you control. Your team gets more ways to understand what the application is doing.
Build unlimited Laritor dashboards with 85+ widgets and send daily or weekly PDF performance snapshots. Flare’s built-in performance overview does not provide an equivalent custom Laravel widget builder.
Laritor connects recorded requests across a Laravel session, with optional session context and custom events. Flare’s request context and browser metrics serve a different workflow from this dedicated backend session journey.
Pennant performance, custom application health checks, and optional CPU, memory, and disk charts give Laritor a wider application view. Comparable dedicated resources are not listed in the reviewed Flare documentation.
Why choose Laritor over Flare?
Follow users, inspect server resources, review feature flags, and build the views your team needs, alongside your exception and performance monitoring.
20M billable events, unlimited apps and users, and 30-day retention. Choose exceptions, detected issues, or all activity without a separate error or log quota.
Flare uses separate error, span, and log allowances. The calculator uses one monthly count for Laritor events and Flare spans, with separate Flare error and log counts.
Cost calculator
Enter one monthly count for Laritor events and Flare spans, then add your Flare error occurrences and logs to find a plan that fits.
20,000,000 billable events
Lowest listed monthly plan that fits all three allowances for your project scope.
USD and EUR are shown as published.
No exchange rate or percentage saving is assumed.
Monthly prices before tax, after any trial. The same count is used for Laritor events and Flare spans. Laritor adds $0.20 per started 100K billable events above 20M; estimates above $500/month require a quote. Flare’s plan is selected by all three allowances; volumes above its listed plans need a quote. Annual discounts and currency conversion are excluded.
Know whether a problem starts in your code, a worker, or the resources your app runs on.
Server monitoring
Laritor puts CPU, memory, and disk usage alongside your Laravel activity. Enable the optional scheduled metric collector to see resource pressure when requests slow down or jobs take longer.
Flare includes host and runtime metadata in its reports. Laritor adds dedicated resource charts, so your investigation can include the server as well as the execution.
Queue performance
See processed, waiting, and failed jobs by queue, connection, and job type. Separate dispatch delay, the wait for a worker, and time spent running the job.
Flare already traces jobs and their chains. Laritor’s dedicated queue views help you decide whether to optimize the job or add worker capacity.
Follow the execution, the user’s session, and the details your code exchanged with other services.
External API debugging
A status code tells you a call failed. The payload can explain why. Laritor can record the API request and response bodies beside timing, headers, and the execution that made the call.
Flare’s standard external HTTP recorder lists headers, status codes, and body sizes. Laritor’s optional body capture helps you investigate invalid payloads or an unexpected response. Enable only the fields you need and redact sensitive values.
User journeys
Open a session to inspect the Laravel requests that were recorded for that visit. Connect an exception to the earlier steps, user details, and custom events that explain how the user reached it.
Flare captures session data on individual requests and supports browser traces. Laritor’s session view brings recorded backend requests together. It shows retained activity, so choose a recording mode that provides the coverage you need.
Commands and scheduled tasks
Read captured console output next to status, duration, exceptions, and related events. If an import stopped halfway or a scheduled task reported an unexpected result, see what it printed.
Flare records command names, arguments, and exit codes. Laritor adds opt-in output capture for the messages your command or task produced.
Debug with your AI agent
Laritor MCP lets your agent retrieve exception details and the recorded execution timeline. It can inspect those events alongside your code to investigate the cause and work on a fix. In-app AI recommendations are available too.
Use the same recorded exception context inside Laritor or in your AI coding workflow. Choose your in-app AI provider ↗
Read the Laritor MCP guide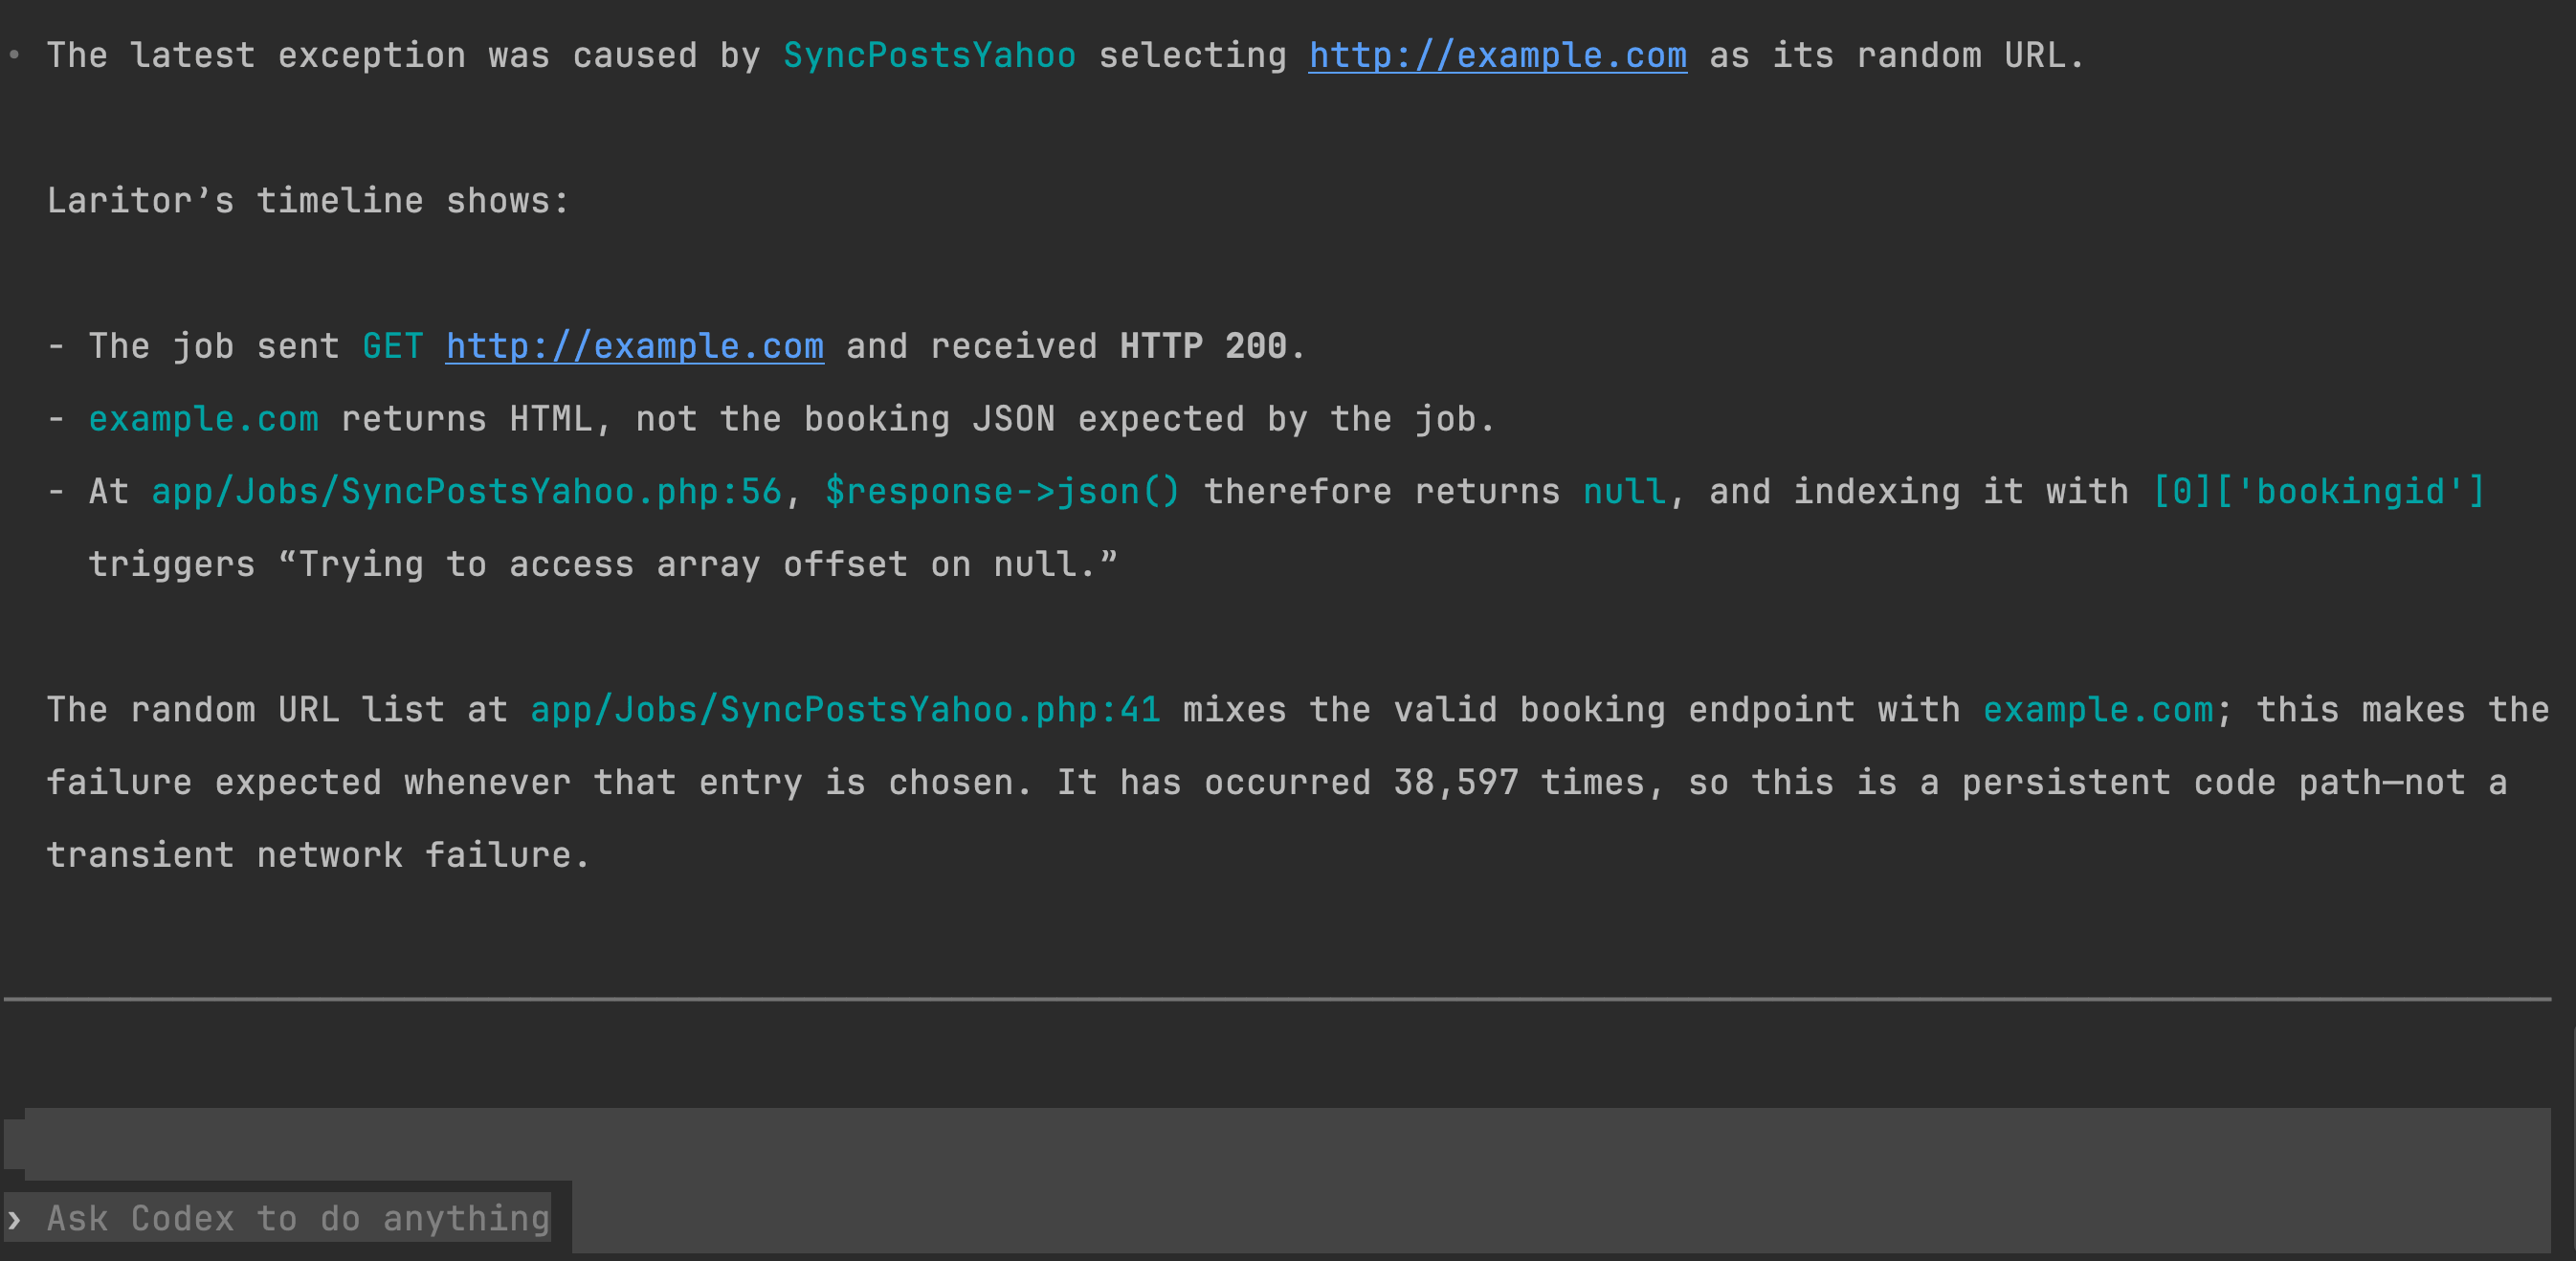
Go beyond an execution trace to understand rollouts, automated traffic, and your own business workflows.
Customizable dashboards
Create unlimited dashboards with 85+ widgets. Arrange and resize charts for requests, queues, exceptions, custom events, and the metrics each team needs.
Flare provides a built-in performance overview. Laritor lets you create separate views for each app, environment, or workflow, with live refresh when you need it.
Feature flag insights
Laritor automatically records Laravel Pennant evaluations. Review activation rates, related errors, and execution durations for active and inactive checks. Other flag providers can report checks manually.
Flare can attach a flag state as custom context. Laritor adds a view specifically for feature flag usage and performance. Compare recorded workloads carefully before attributing a change to a flag.
Business milestones
Add custom events for checkout steps, payment attempts, import progress, or fallback paths. Give each event metadata that explains what happened, then explore it in timelines and custom event views.
Flare also supports custom instrumentation through spans and span events. Laritor’s dedicated custom event resource and dashboard widgets make those milestones easier to review across your recorded Laravel activity.
Bot and suspicious requests
Use Laritor’s dedicated bot and suspicious request filters to investigate automated traffic alongside failures and slow requests. Customize detection to match your application.
Flare includes IP and user agent context in requests. Laritor adds specific traffic views to help you separate automated requests from customer activity during an investigation.
Performance in context
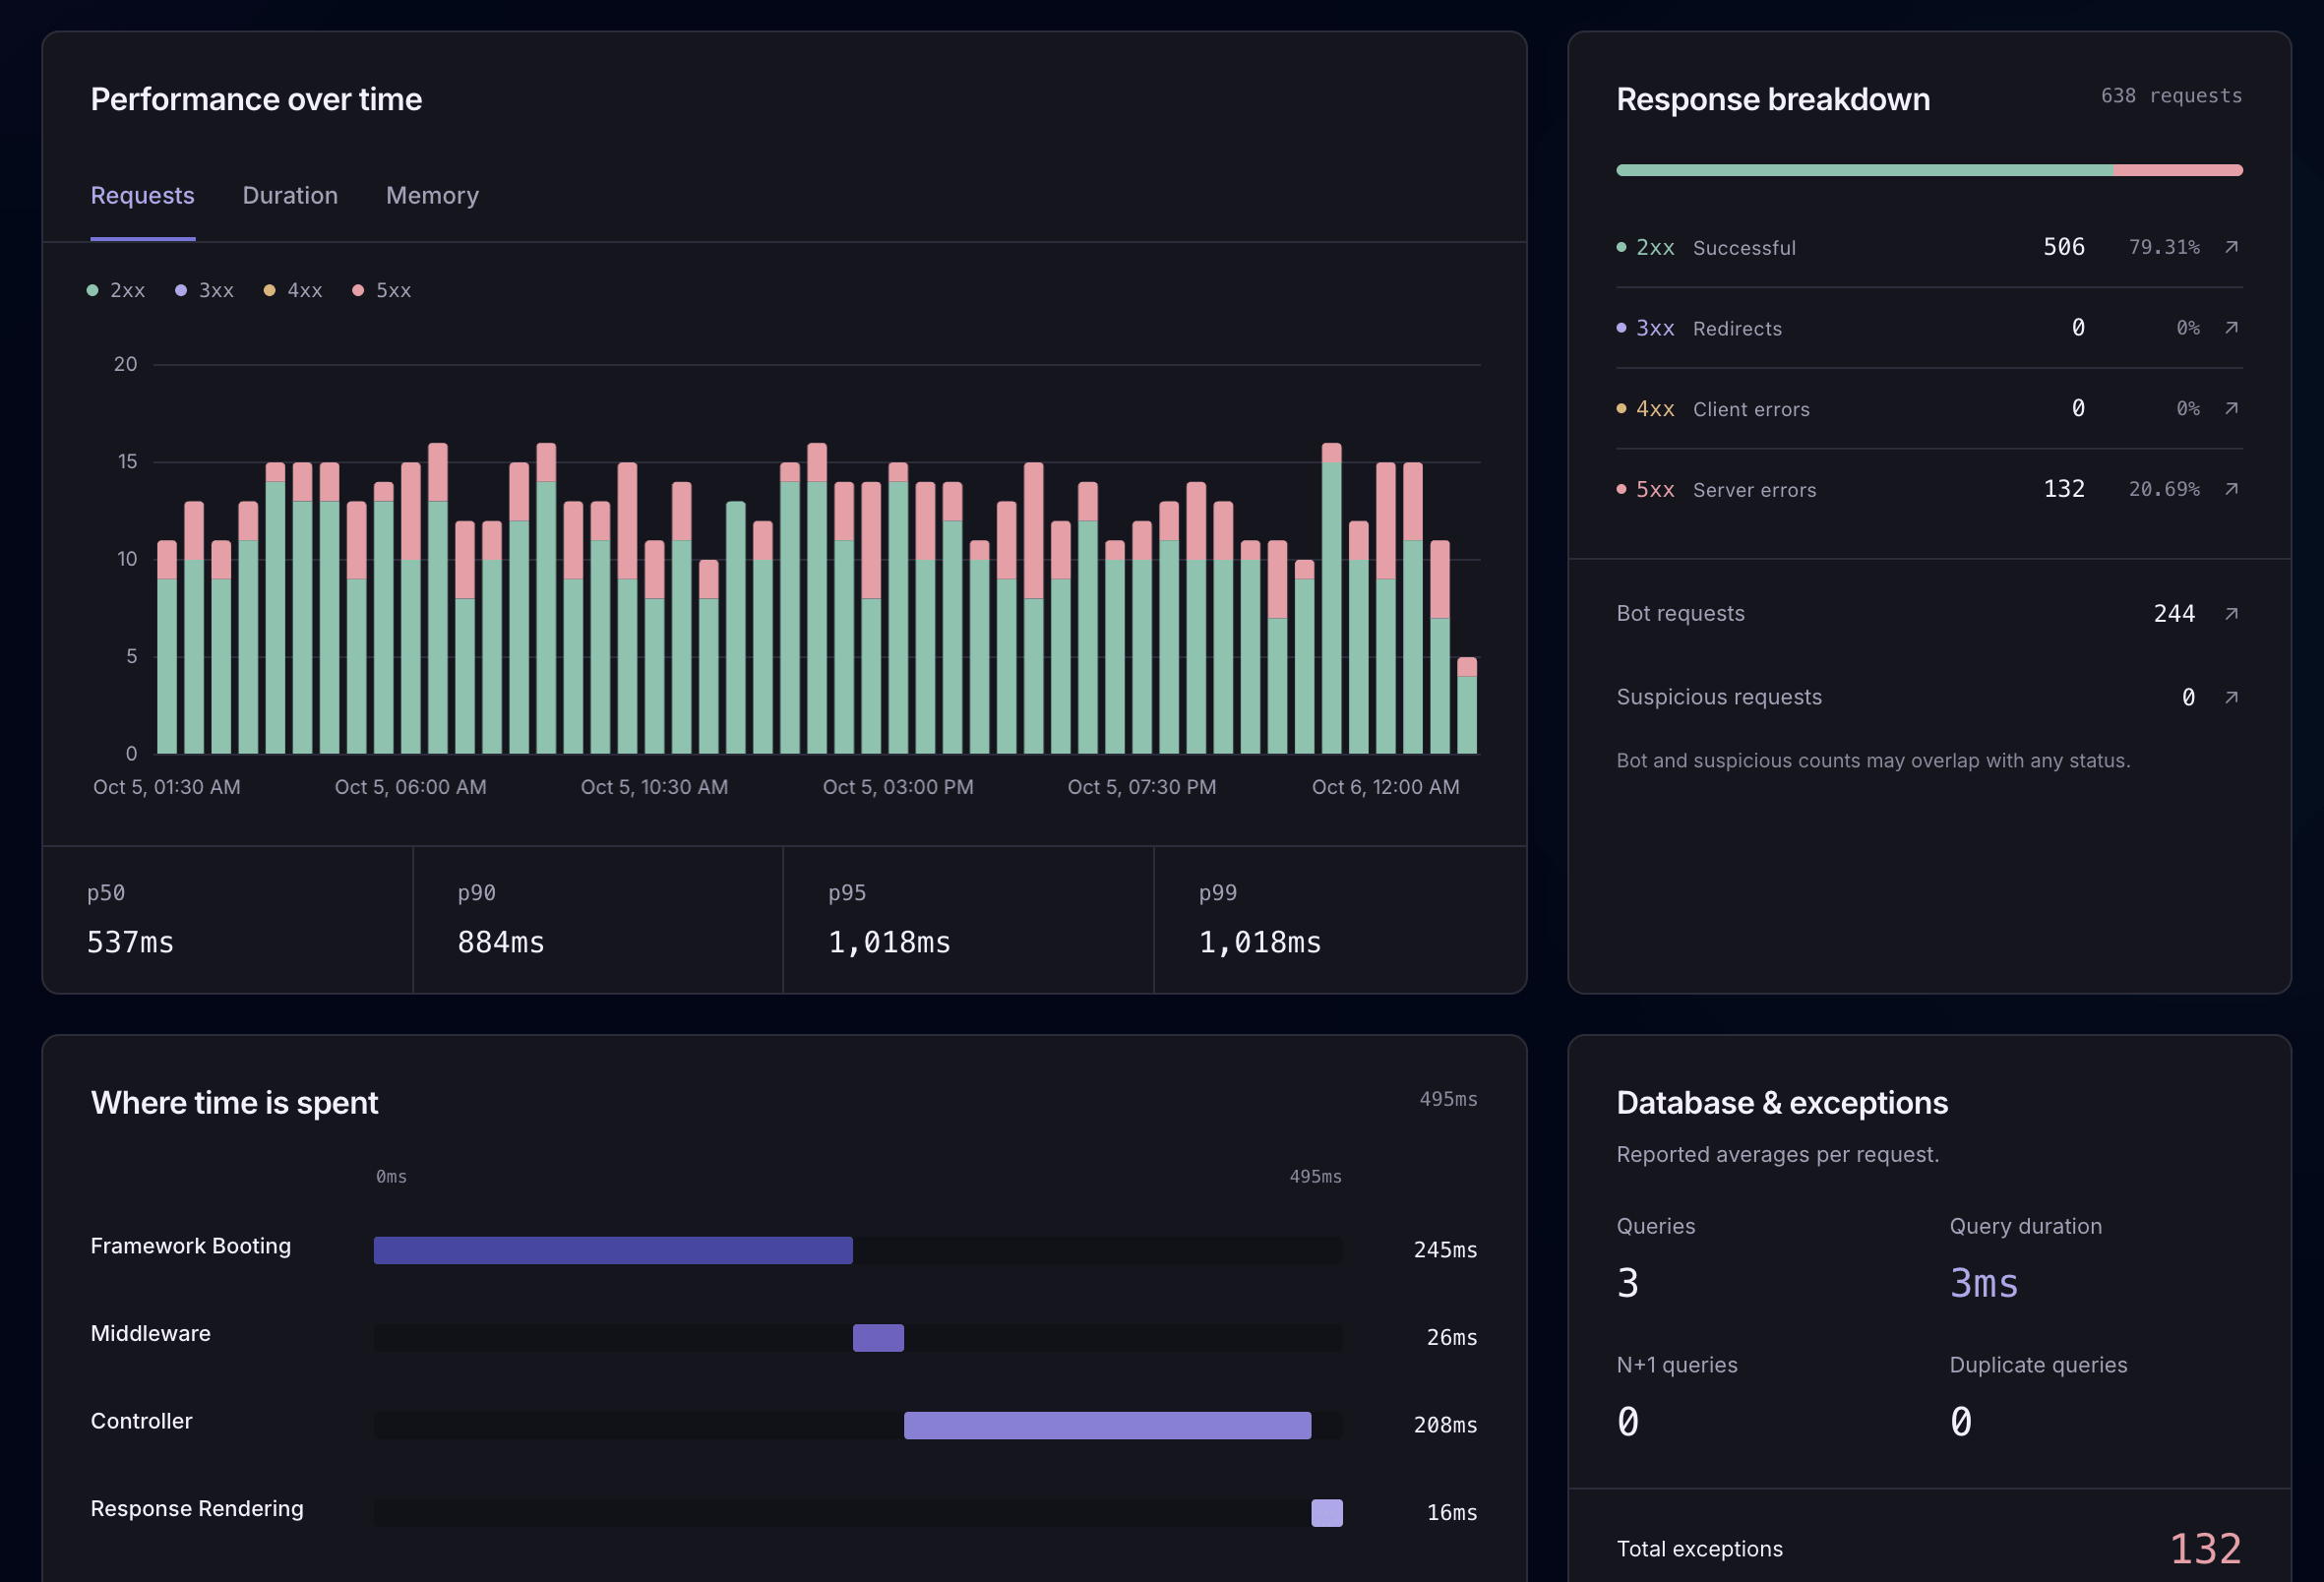
Review request volume, status codes, duration percentiles, and where time is spent. Open a retained request to inspect its queries, logs, API calls, and other recorded events. Explore request monitoring
Bring a useful performance snapshot to your inbox and your teammates.
Scheduled PDF reports
Choose the metrics for your report, set a schedule, and receive a PDF performance snapshot by email. Share it with teammates who need an update without building a dashboard or opening Laritor.
Flare has dashboards and alerts. Custom scheduled PDF reports are not listed in the reviewed documentation. Laritor gives you a regular record of how your application is doing.
Evaluate Laritor in your app
Use a representative app or environment to compare the details you receive, recording volume, and debugging workflow.
Create a Laritor account, install the Composer package, add your ingest endpoint and key, and run the sync command.
composer require binarybuilds/laritor-clientStart with exception tracker, issue tracker, or full observability. Register the generated filter, then review the data and privacy settings for your app.
Configure recording filtersInspect a known exception or slow execution, test alert delivery, and compare measured overhead and billable event usage. If you run both tools, include their combined collection work in your evaluation.
Explore exception investigationCreate your dashboards, choose alert channels, schedule reports, and connect AI. Keep access to your existing Flare history while Laritor builds a new record of your application’s activity. There is no documented automatic history import.
Explore Laritor guidesQuestions before switching
Laritor is an exception tracker, issue tracker, and performance monitoring tool for Laravel. Choose it when you want custom dashboards, feature flag insights, session request journeys, server metrics, and scheduled PDF reports alongside your exceptions and execution timelines.
Yes. Flare launched performance monitoring in November 2025 and now offers error tracking, performance traces, searchable logs, and AI tools. Its performance views include routes, queries, jobs, commands, external HTTP calls, Livewire components, and browser performance. This comparison includes those capabilities.
Yes. Exceptions-only mode retains an execution when an exception happens, including its related recorded events. issue tracker mode retains executions with detected problems, such as failures or slow requests. Full observability retains all activity allowed by your filters. Every mode includes all Laritor features.
Laritor starts at $20/month with 20M billable events. Flare has separate allowances for errors, spans, and logs, with EUR monthly prices of €9 for Hobby, €29 for Standard, €69 for Growth, and €279 for Premium. Hobby allows one project and one user. Use the calculator’s shared event/span count and separate Flare error and log counts to compare monthly plans.
The calculator uses one monthly count for Laritor billable events and Flare spans. Flare errors and logs are checked against their separate allowances. Laritor estimates above $500/month show “Ask for a quote”. Prices use USD for Laritor and EUR for Flare.
Yes. Laritor has in-app AI recommendations and a read-only MCP server for exception details and recorded execution context. Flare has its Assistant, MCP, and CLI for errors, logs, and performance, with optional error management actions. Laritor also lets you connect your preferred provider for in-app AI.
Yes. Flare supports custom spans, span events, glows, and context. Laritor supports named custom events with metadata, a dedicated event index, and dashboard widgets. The difference is how you explore and report on that activity, rather than whether you can instrument your own code.
Laritor focuses on Laravel backend monitoring. Flare also provides JavaScript integrations and browser performance metrics, including Core Web Vitals. If you need client-side error tracking or browser rendering metrics, evaluate that requirement separately from your Laravel monitoring.
Yes. Choose the fields you capture and use client-side redaction to remove sensitive values before ingestion. Request bodies, response bodies, API payloads, session data, and user attributes should follow your application’s data policy. Flare also offers client-side data censoring.
Neither requires a separate daemon for basic application ingestion. Laritor sends events from its Laravel Composer client. Flare sends directly by default and offers an optional asynchronous daemon. Optional Laritor server metrics use a scheduled collection command.
Laritor begins recording new activity after installation and configuration. There is no documented automatic import of Flare history. Keep access to the history you need while you evaluate Laritor, and compare a representative exception, request, and job before changing your monitoring workflow.
About this comparison
Published by Laritor, independently of Flare and Spatie. Flare’s current performance monitoring, logging, AI, documentation, and public monthly pricing were reviewed on . The table compares dedicated product features; the detailed explanations cover relevant recording controls and context options.
“Not listed” is a documentation finding, not a claim that a capability is impossible to implement. Dedicated product views are compared separately from custom spans and context. Prices use monthly billing before tax, in each product’s published currency. The calculator uses the same monthly count for Laritor events and Flare spans. No exchange rate or unpublished Flare overage charge is assumed.
Start with the data you need
Track exceptions, detect issues, and monitor performance.
Try Laritor with 300K events free.