
Guest and authenticated sessions
Explore sessions with an identified user and sessions without one. Guest activity can include people browsing before login and automated clients.
Laravel session monitoring
Laritor is a performance monitoring and issue tracking tool for Laravel. Follow the requests a user makes during a session, see which responses were slow or failed, and inspect the events behind them. Add custom events to understand the steps that matter in your app.
Free trial: 300K events · Unlimited apps and users

Find the sessionGuest or authenticated activity.
Follow the requestsFrom entry to the last recorded action.
Inspect the problemOpen the execution and related events.
Explore sessions with an identified user and sessions without one. Guest activity can include people browsing before login and automated clients.
See distinct users associated with the loaded sessions. One user can have multiple sessions, so user counts and session counts answer different questions.
Review average recorded request counts for the loaded sessions in the selected window. Load more results when you need a broader comparison.
The overview summarizes currently loaded sessions for the selected window and filters. Load more sessions to expand it. Counts reflect recorded activity, rather than every visit or users currently online.
Guest and authenticated Laravel sessions
A Laravel session connects activity across requests. Laritor uses recorded session context to help you follow what your app handled during that journey.
Select a time window, filter by IP address or user, and switch between All sessions, Authenticated, and Guest. Review the client, first and last activity, and recorded span before opening a session.
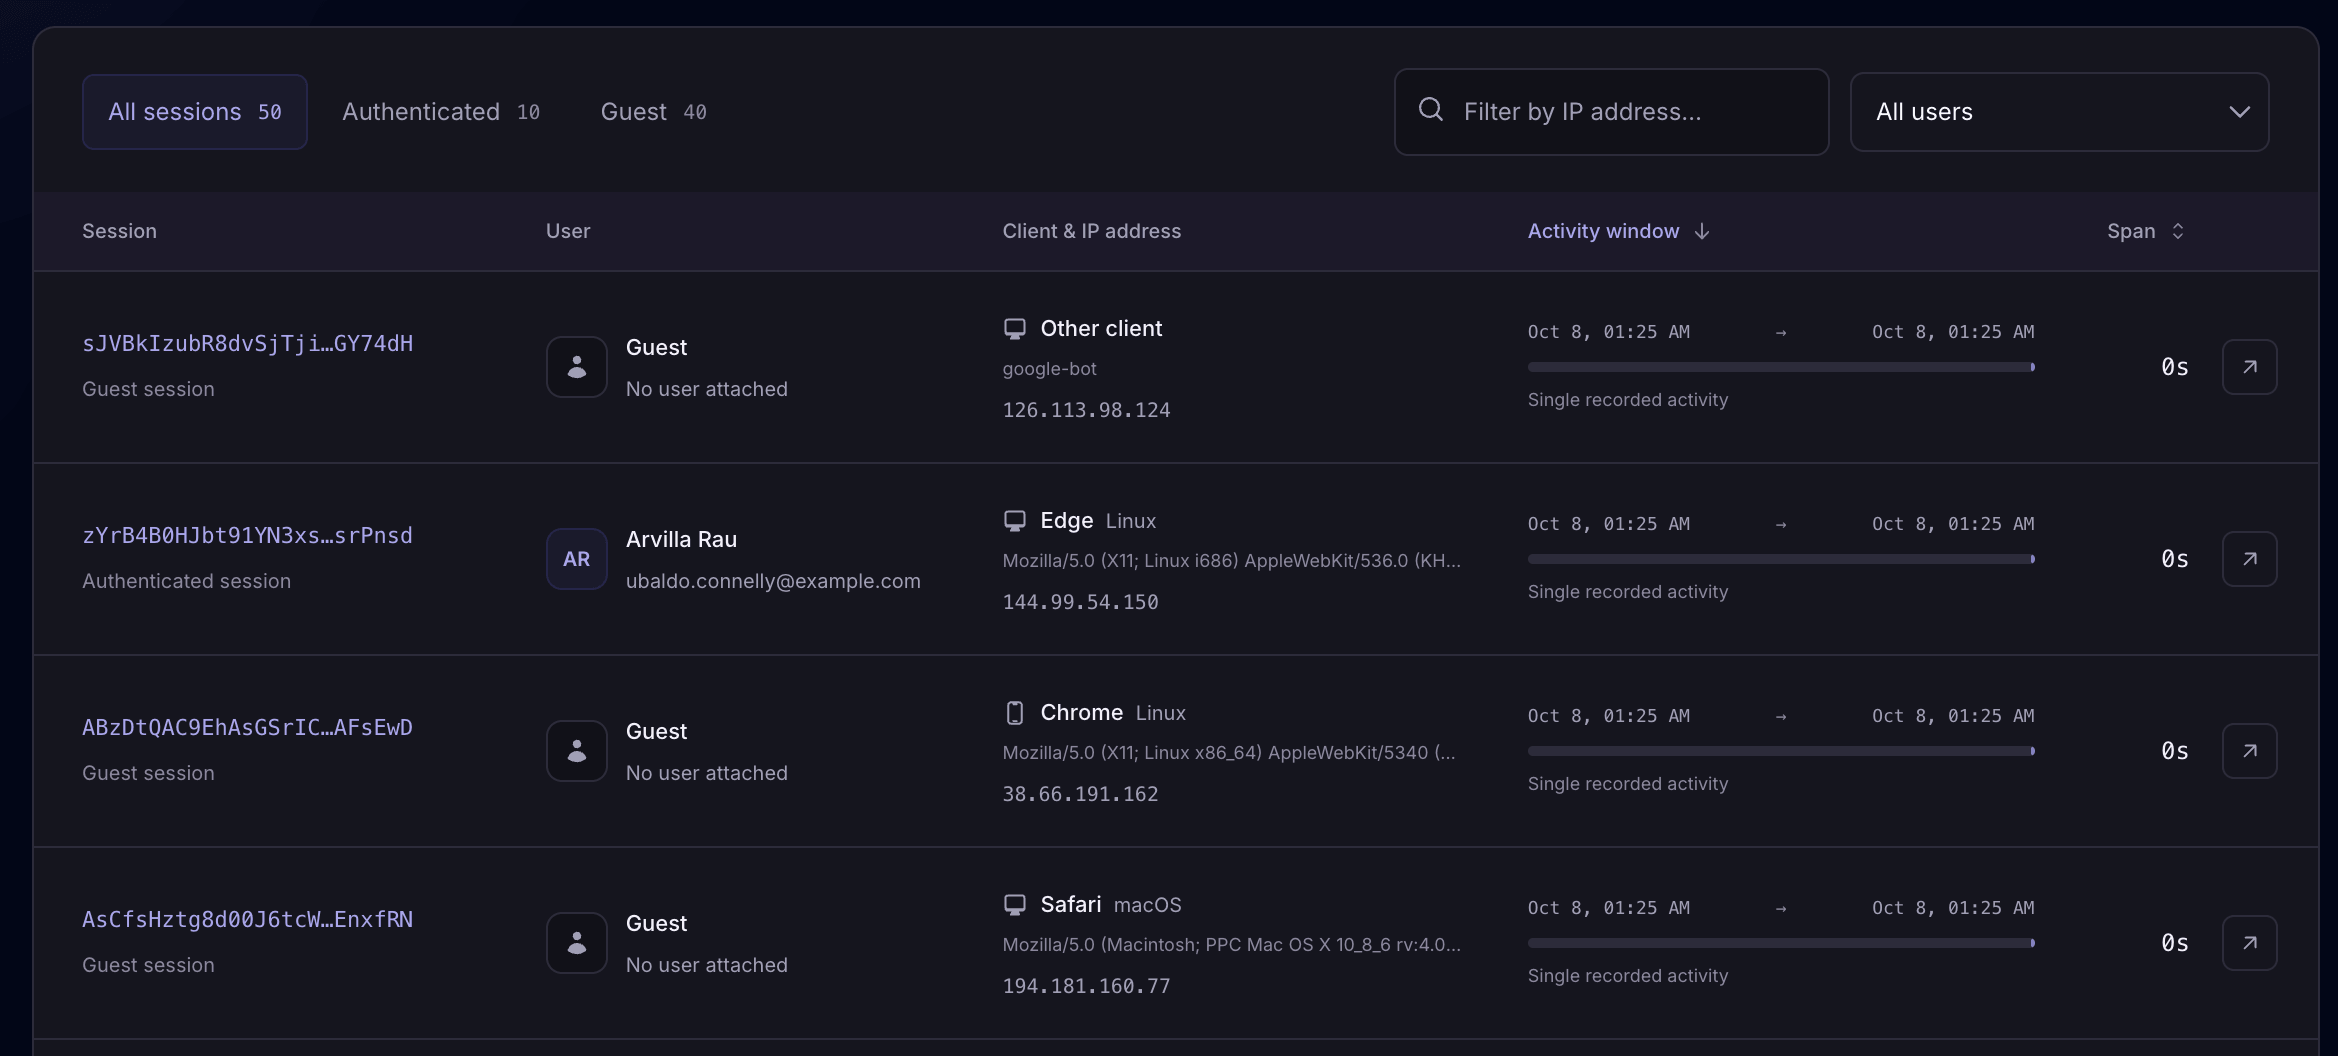
Authenticated means the recorded session has an identified user attached. Guest means no user is attached; the client and user-agent details can help you recognize automated traffic too.
Session entry, exit, and activity span
Open the entry and exit requests to inspect their URLs, methods, and response statuses. Use them as a starting point for understanding the activity Laritor captured.
If the final request failed, inspect its events and review earlier session requests for context. If only one request was captured, entry and exit can be the same.
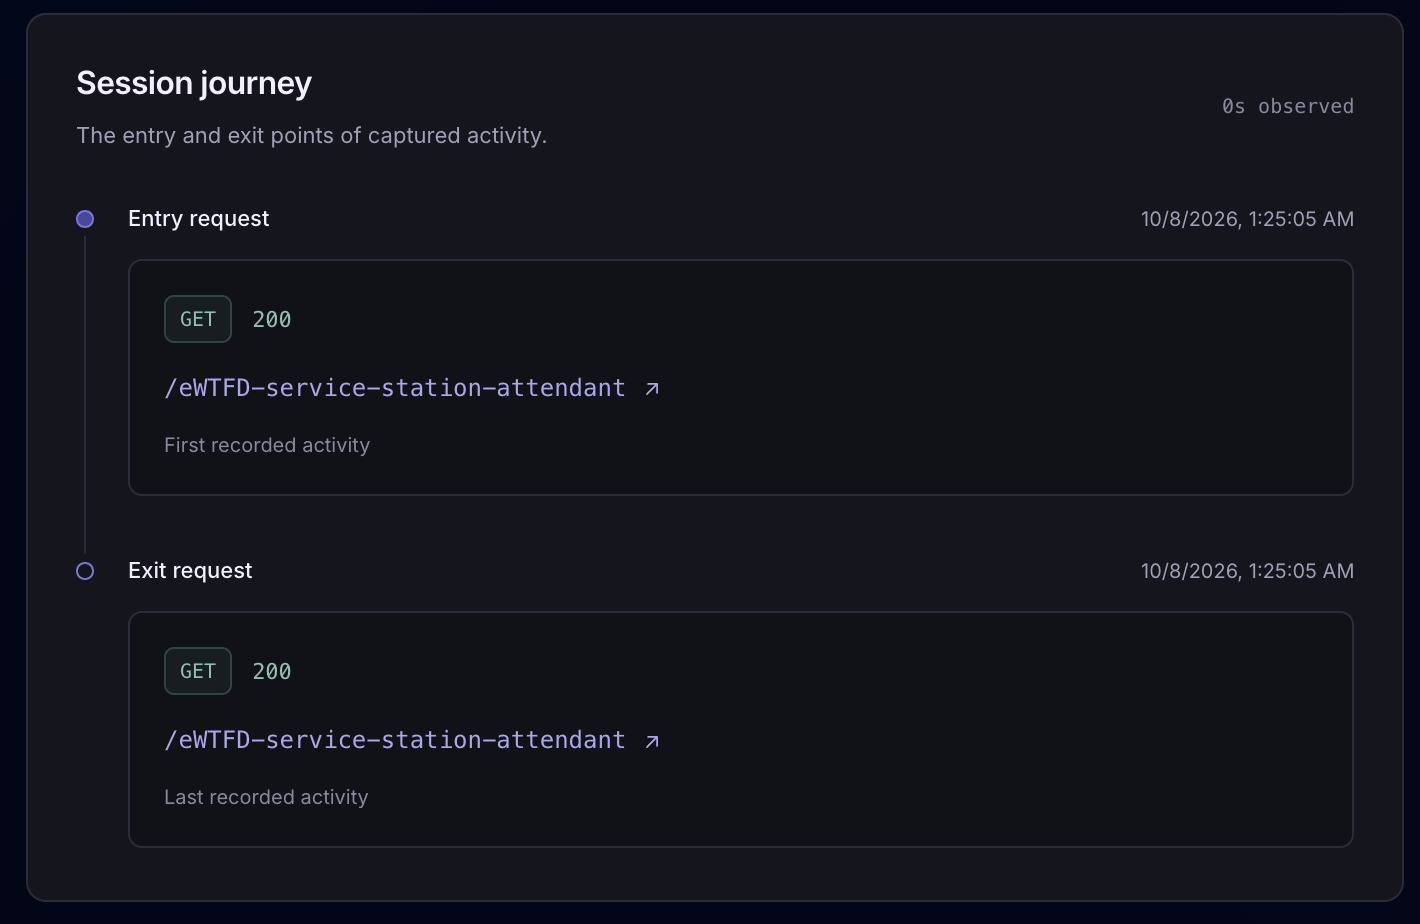
Open the first recorded request. See its URL, HTTP method, response status, and the point where the captured journey starts.
Open the last recorded request. Check whether it returned an error, then inspect its events to understand what happened.
See the time between the first and last recorded activity. A session with one recorded request can show a zero-second span.
Activity span measures the time between recorded requests. It does not measure time spent reading a page. Filters and retention can change the entry and exit points you see.
Requests and events associated with a session
Review recorded requests in the session’s activity view. Search by URL, filter by HTTP method, status, or duration, and inspect each request’s time, response, and memory use.
Switch to related resources to investigate database queries, API calls, exceptions, or other events associated with the session. Use Full session to return to its recorded activity window.
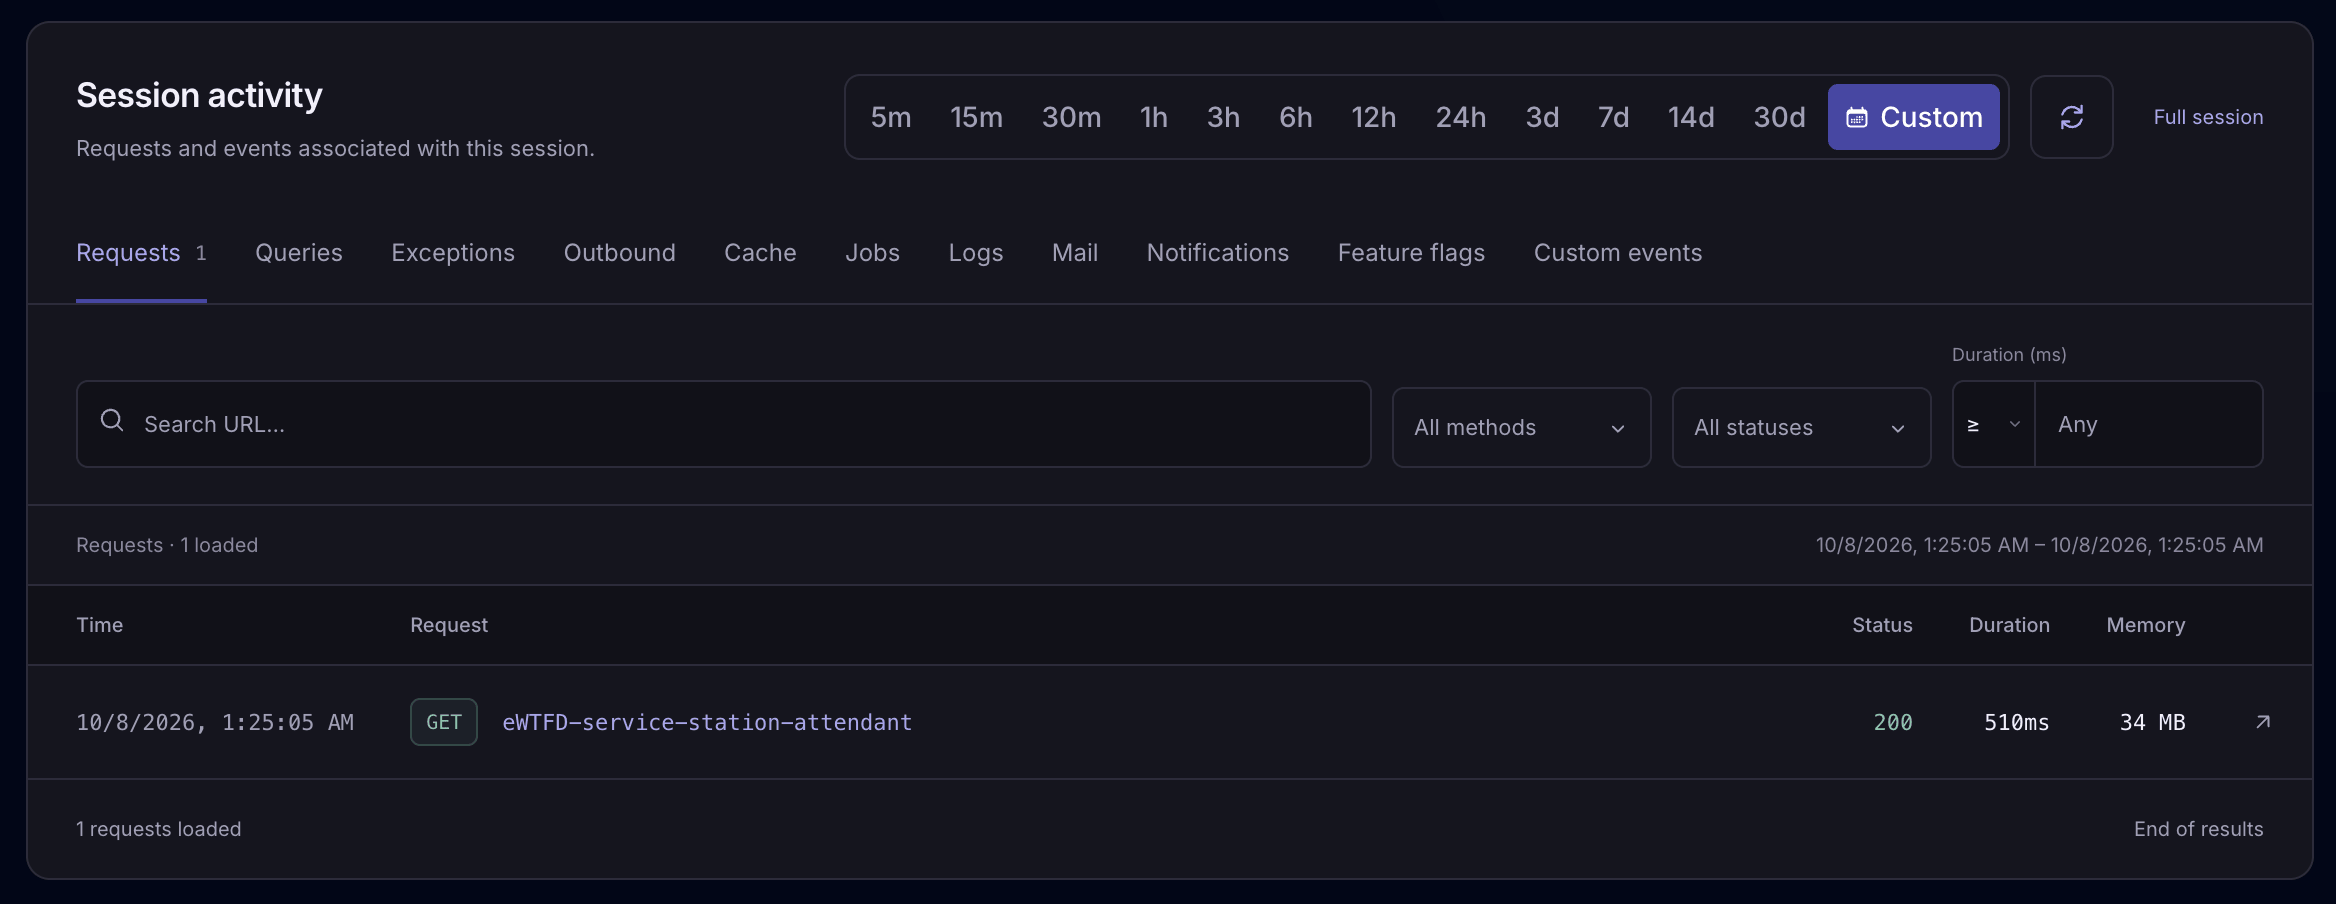
Related activity appears when its recorded context links it to the session. Background work is not automatically part of every user journey.
User and client context
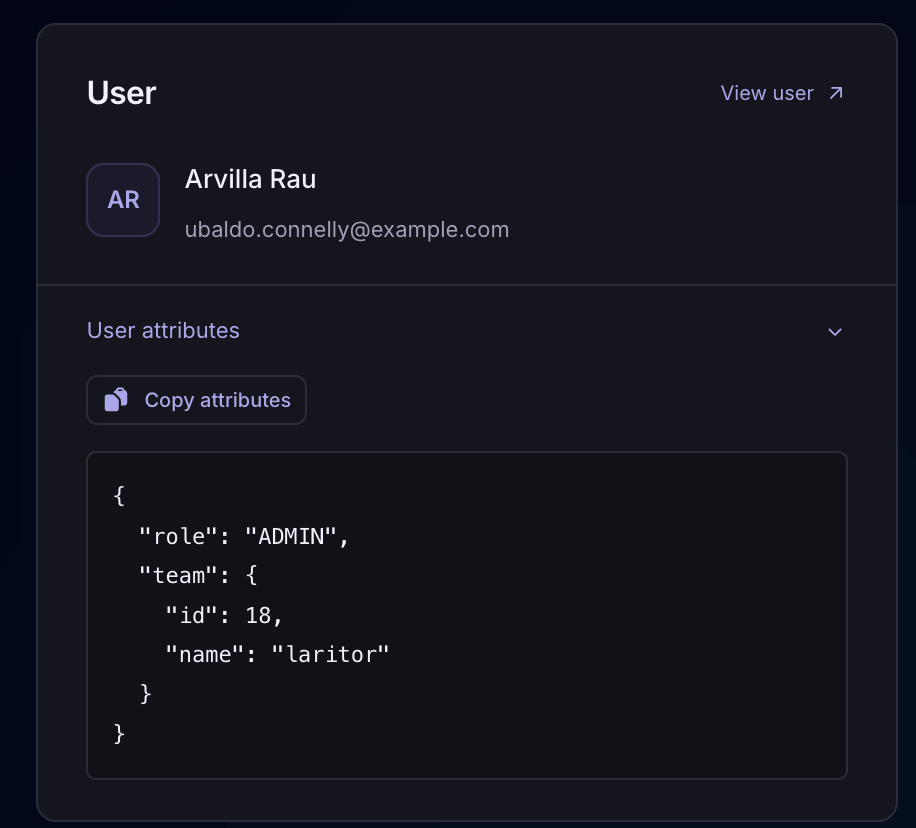
For an identified session, see the recorded user and open their profile to investigate activity across other sessions. Additional attributes such as role or team can help explain which users a problem affects.
Review the session’s browser, platform, IP address, and user-agent details when available. These values help you investigate differences between clients and recognize traffic patterns.
Customize redactAuthenticatedUser to include useful profile attributes alongside the required user ID, name, and email fields.
Custom events for meaningful actions
A URL alone may not tell you whether someone retried a payment or reached a checkout stage. Record a custom event when your server-side code reaches an action your team needs to understand.
Inspect the event’s metadata in session activity or open its request timeline to see the queries, API calls, and other work around that step.
Learn how to add custom eventsUse a stable event name and attach small pieces of useful context. Put the call where the action happens so its place in the execution is meaningful.
Custom events follow the recording mode for their request. Choose a mode that retains the steps you want to inspect.
Explore custom event trackinguse BinaryBuilds\LaritorClient\Laritor;
// In your request, when the payment retry starts:
Laritor::addCustomEvent('checkout.payment_retry', [
'payment_provider' => 'stripe',
]);Example: following a checkout problem through a session
From a support report to the request that caused it
If a user reports a slow page or an error during checkout, find the matching session and open the affected request. Inspect the execution timeline to see what happened before the response.
Look for expensive database queries, a slow external API, repeated work, or an exception. An HTTP error response can happen without an exception, so review the status and related events together.
Explore request timelines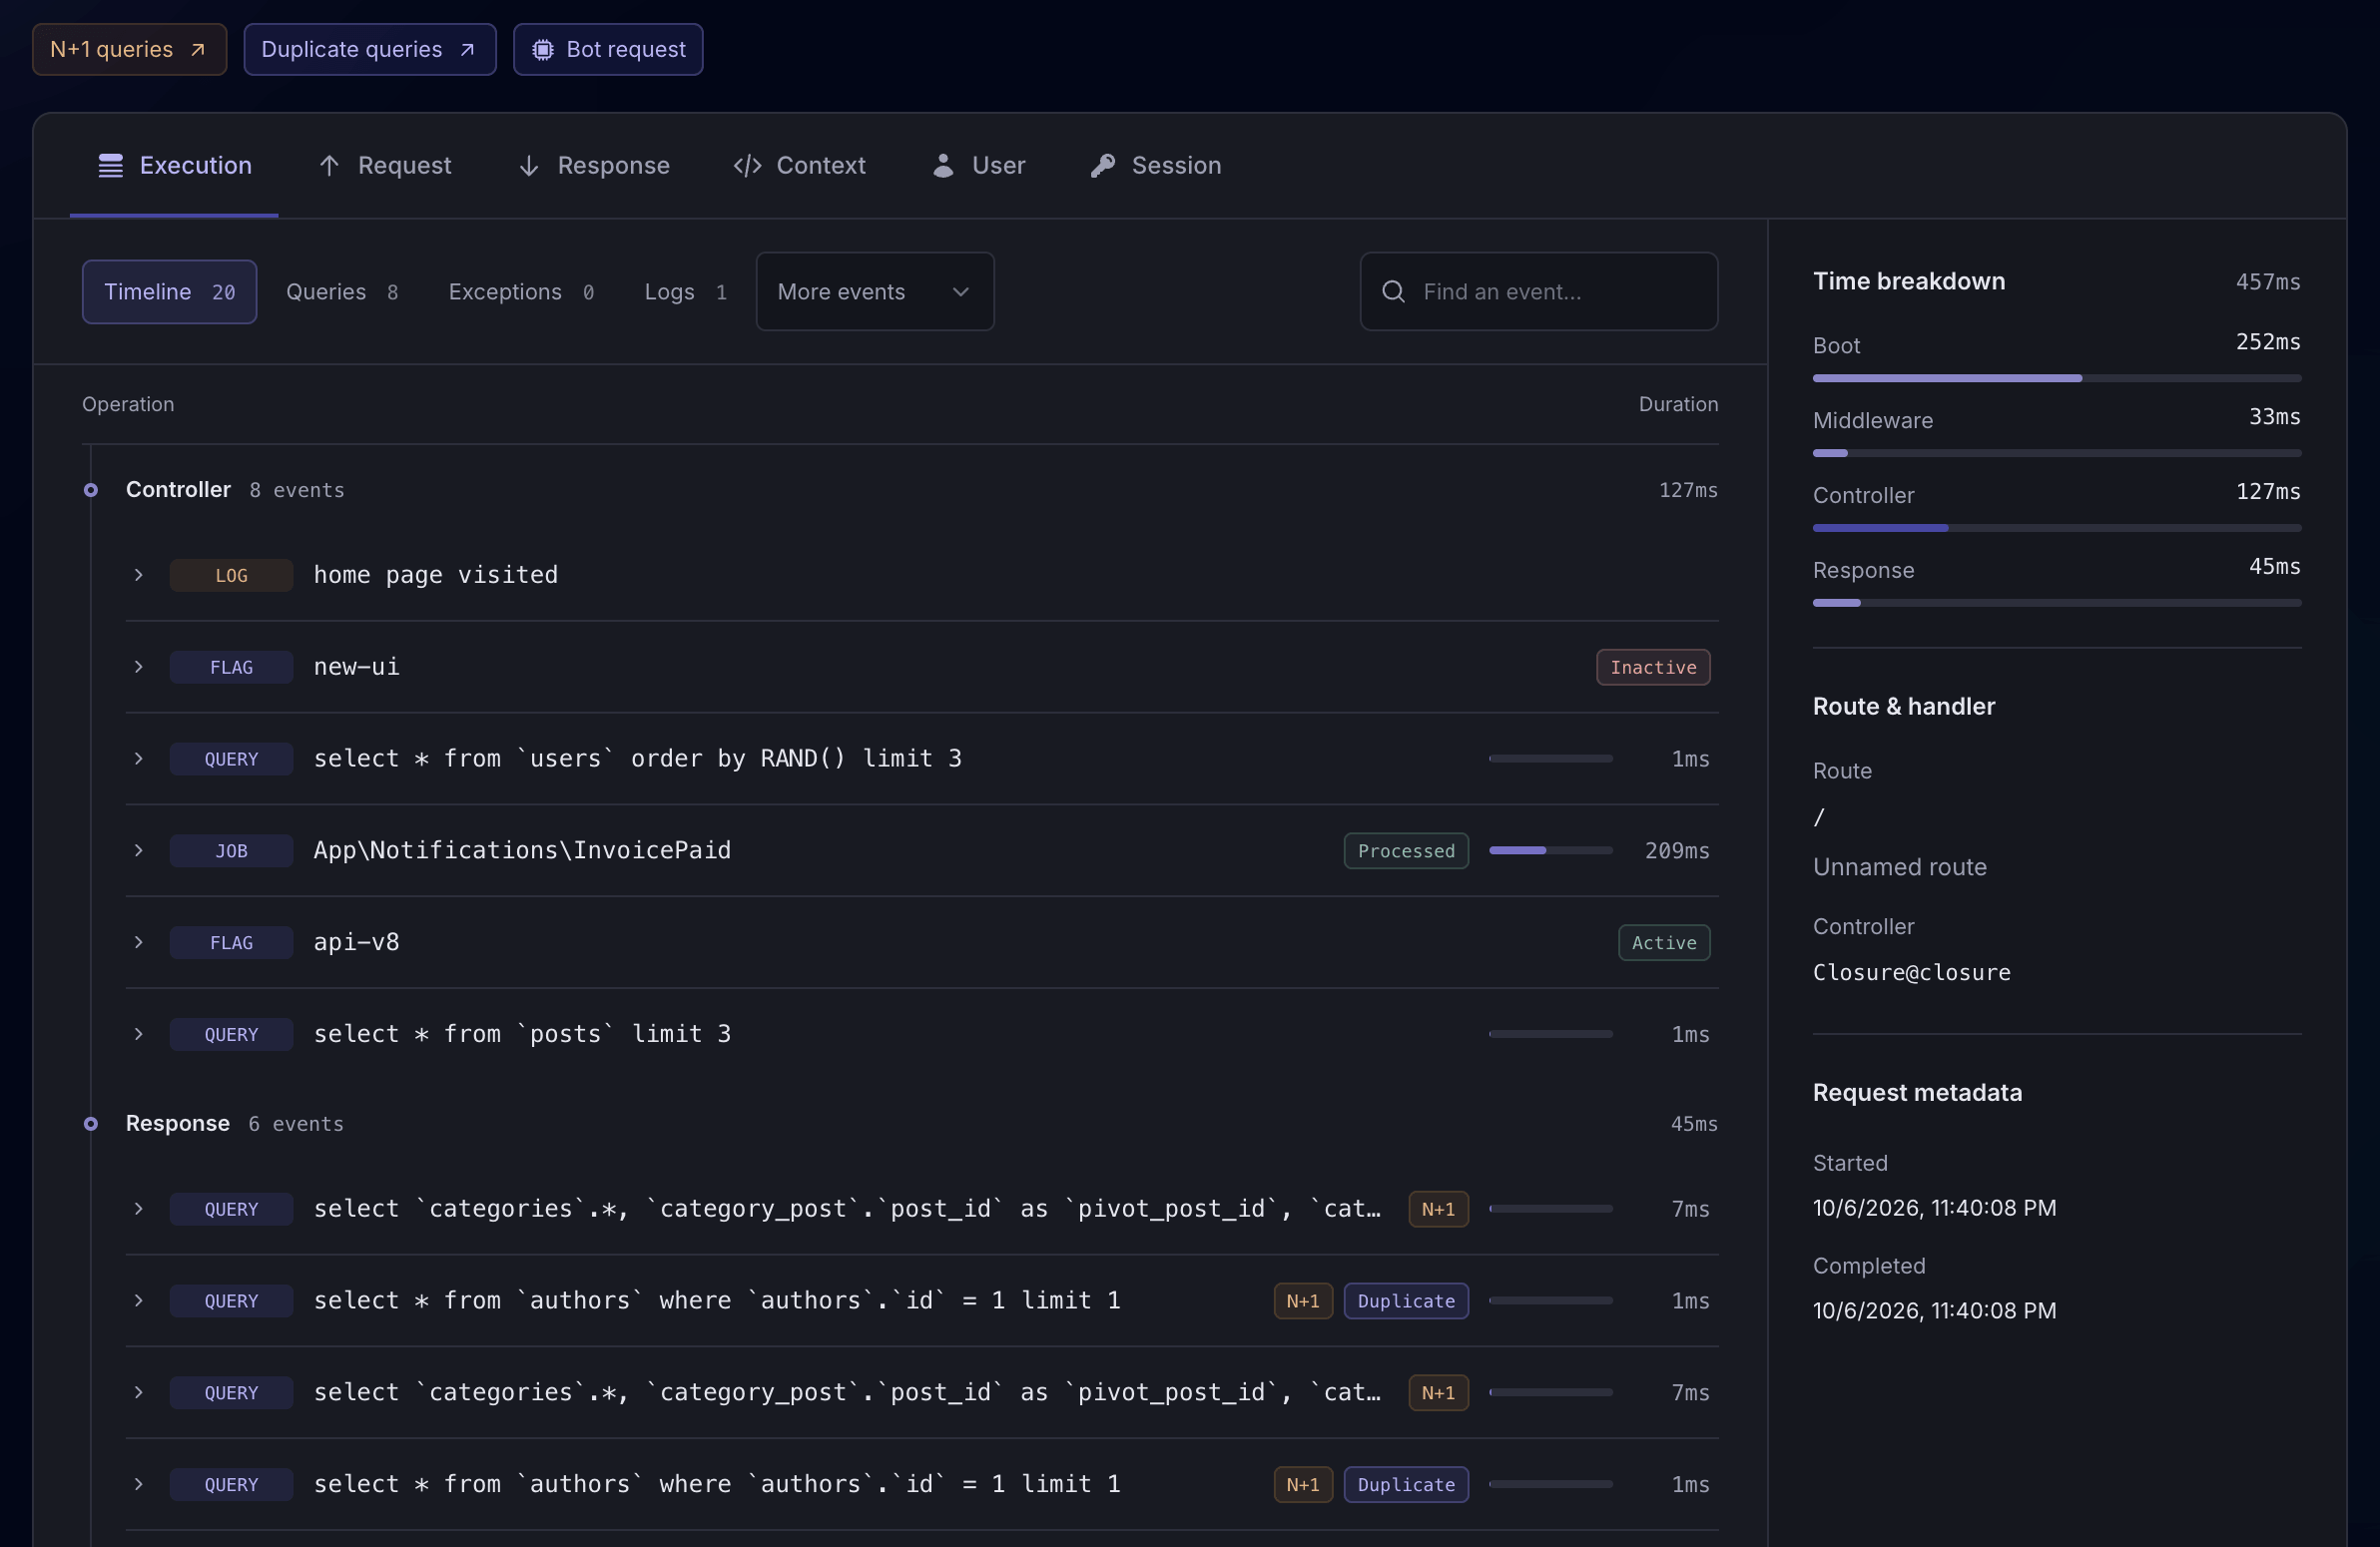
Use Laritor’s AI recommendations for the recorded request to help understand slow work and plan an optimization. Review the suggestion against your code and test the result.
Set up in-app AIConnect through Laritor MCP to retrieve the exception and its recorded execution timeline. Your coding agent can use that context with your repository to understand the failure and work on a fix.
Connect Laritor MCPSelect the time around the reported problem. Filter by user or IP address, then open a session to review its requests and recorded journey.
Filter session requests by URL, method, status, or duration. Inspect the slow response or error alongside its queries, API calls, logs, and exceptions.
Use the recorded evidence to change the code or configuration. Repeat the workflow and inspect new requests to check the result.
Use Laritor how you want
Record requests with exceptions, requests with detected issues, or successful activity too. Each retained request includes its related recorded events and available session context.
Filtered modes can leave gaps in successful activity. Full observability gives you a broader history for following the steps before and after a problem.
Keep requests that contain exceptions and their related events. Use session and user context to investigate the failures that were recorded.
Focus on the journey around an exception.
Keep requests with detected issues, such as slow or failed requests, together with their events. Follow the session activity that needs attention.
Investigate problems that affect users.
Record successful requests too. Follow a broader session history and compare the user’s earlier actions with a later failure or slow response.
Use this for broader user journey visibility.
Session counts, requests per session, and observed entry and exit points reflect retained data. Paid plans start at $20/month with 20M events included. Estimate your usage
Session data and privacy controls
Session values, profiles, and related events can contain personal or sensitive information. Laritor applies redaction before recorded data leaves your app, and you can customize what is sent.
Keep the context needed to investigate a journey while removing or anonymizing private values.
Explore privacy controlsSession values are recorded by default. Use recordSessionData to control the values attached to inbound requests. Disabling session values does not remove the session ID used to connect requests.
Use redactAuthenticatedUser and the email, IP-address, user-agent, string, and structured-value redactors to handle recorded information as your app requires.
Use recordRequest to exclude unwanted requests. Review related payload settings and custom event metadata so the journey contains useful debugging context.
Laravel session monitoring questions
Answers about guest activity, session requests, custom events, recording modes, and privacy.
Laravel session monitoring connects recorded requests and related events through a session so you can follow a user’s server-side activity. Laritor is a Laravel performance monitoring and issue tracking tool that shows guest and authenticated sessions, entry and exit requests, activity spans, user and client details, and associated requests and events for investigation.
Find the session around a reported problem and inspect its entry and exit requests. Review the recorded request history, response statuses, and duration, then open individual executions to inspect their queries, API calls, logs, and exceptions. Custom events can mark application-specific steps such as a payment retry or completed checkout stage.
Yes. Laritor distinguishes sessions with an identified user from guest sessions without an attached user. Both can be investigated through their recorded requests and client details. A guest session is not necessarily a unique human visitor; it can also contain automated client activity.
Select a time window in Sessions, filter by IP address or user, and choose All sessions, Authenticated, or Guest. Review client details, activity times, and spans, then open the relevant session. Use the activity view’s URL, method, status, and duration filters to narrow down its recorded requests.
The session overview summarizes the sessions currently loaded for your selected window and filters. Users counts distinct identified users in those sessions, and one user can have several sessions. Average requests per session uses recorded request counts for the loaded sessions in the selected window. Load more sessions to expand the summary; these values are not a complete website analytics report or a count of people currently online.
Entry and exit are the first and last recorded requests available for that session. Activity span is the time between first and last recorded activity, rather than the time someone actively spent looking at a page. With one captured request, both endpoints can be the same and the span can be zero. Recording modes, filters, and retention affect the observed journey.
Laritor follows recorded server-side requests and events. It does not replay the browser screen or automatically capture every click. Use session request history to investigate what the Laravel application handled, and add custom events where your server-side code reaches meaningful workflow steps.
Yes. Filter the session’s request activity by URL, method, response status, or duration and open the affected request. Inspect its timeline for database queries, outbound API calls, cache operations, logs, exceptions, and other recorded events. An HTTP 4xx or 5xx response does not necessarily mean an exception was thrown, so investigate the status and execution details together.
No. Exceptions-only and issue tracker modes retain session context for the requests they keep. Full observability also records successful activity, which gives you a broader history of the user’s journey. Filtered modes can leave gaps in successful activity, and session counts and entry or exit requests reflect the data retained rather than every visit or action.
Session context is captured with supported requests when a Laravel session is available. Stateless requests without session context may not appear as part of a session journey. Use recordSessionData to control the session values attached to requests; disabling those values does not remove the session ID used to connect requests. Customize profile, IP address, email, string, and structured-value redactors, and review request recording filters to control the data your app sends.
Install in under 1 minute
Add Laritor’s Laravel client, choose a recording mode, and follow session requests alongside the events that explain them.
Free trial: 300K events · Unlimited apps and users