
Users active in each interval
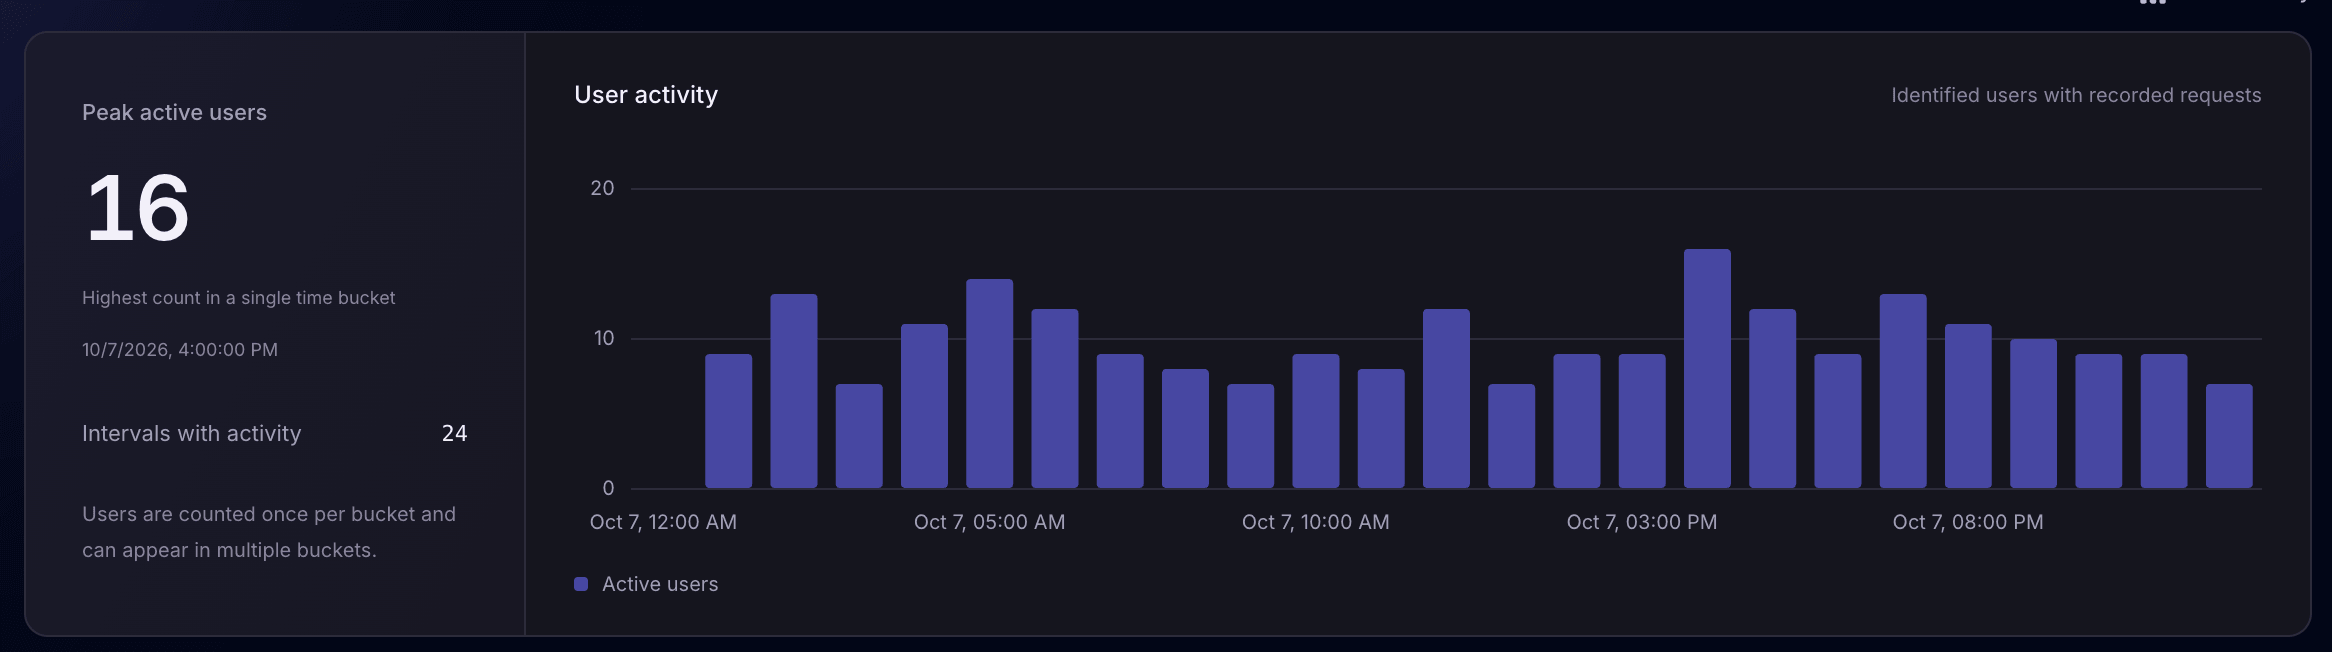
See identified users who made recorded requests in each time bucket. A user is counted once per bucket and can appear in several buckets.
Laravel user activity monitoring
Laritor is a performance monitoring and issue tracking tool for Laravel. Find a user, inspect their recorded requests and sessions, and follow the events behind slow responses or errors. Use profile context and custom events to understand the workflow they were using.
Free trial: 300K events · Unlimited apps and users
Find the affected userSearch recorded profiles by name, email, or ID.
Follow their recorded activityRequests, sessions, and related events.
Investigate the causeOpen the execution behind a problem.
See identified users who made recorded requests in each time bucket. A user is counted once per bucket and can appear in several buckets.
Find the largest count in a single interval. This is not a count of users online at the same moment.
Compare when recorded user activity occurred. The chart reflects the requests and user context your app sends.
Search your recorded user directory
Search by name, email, or user ID to find a recorded profile in the selected environment. Check their latest recorded activity, inspect available attributes, and open the user’s activity view.
The directory contains profiles your app has sent to Laritor. It is not a guaranteed export of every registered account. “Last active” means the latest recorded activity, not a live online status.
Explore the user directory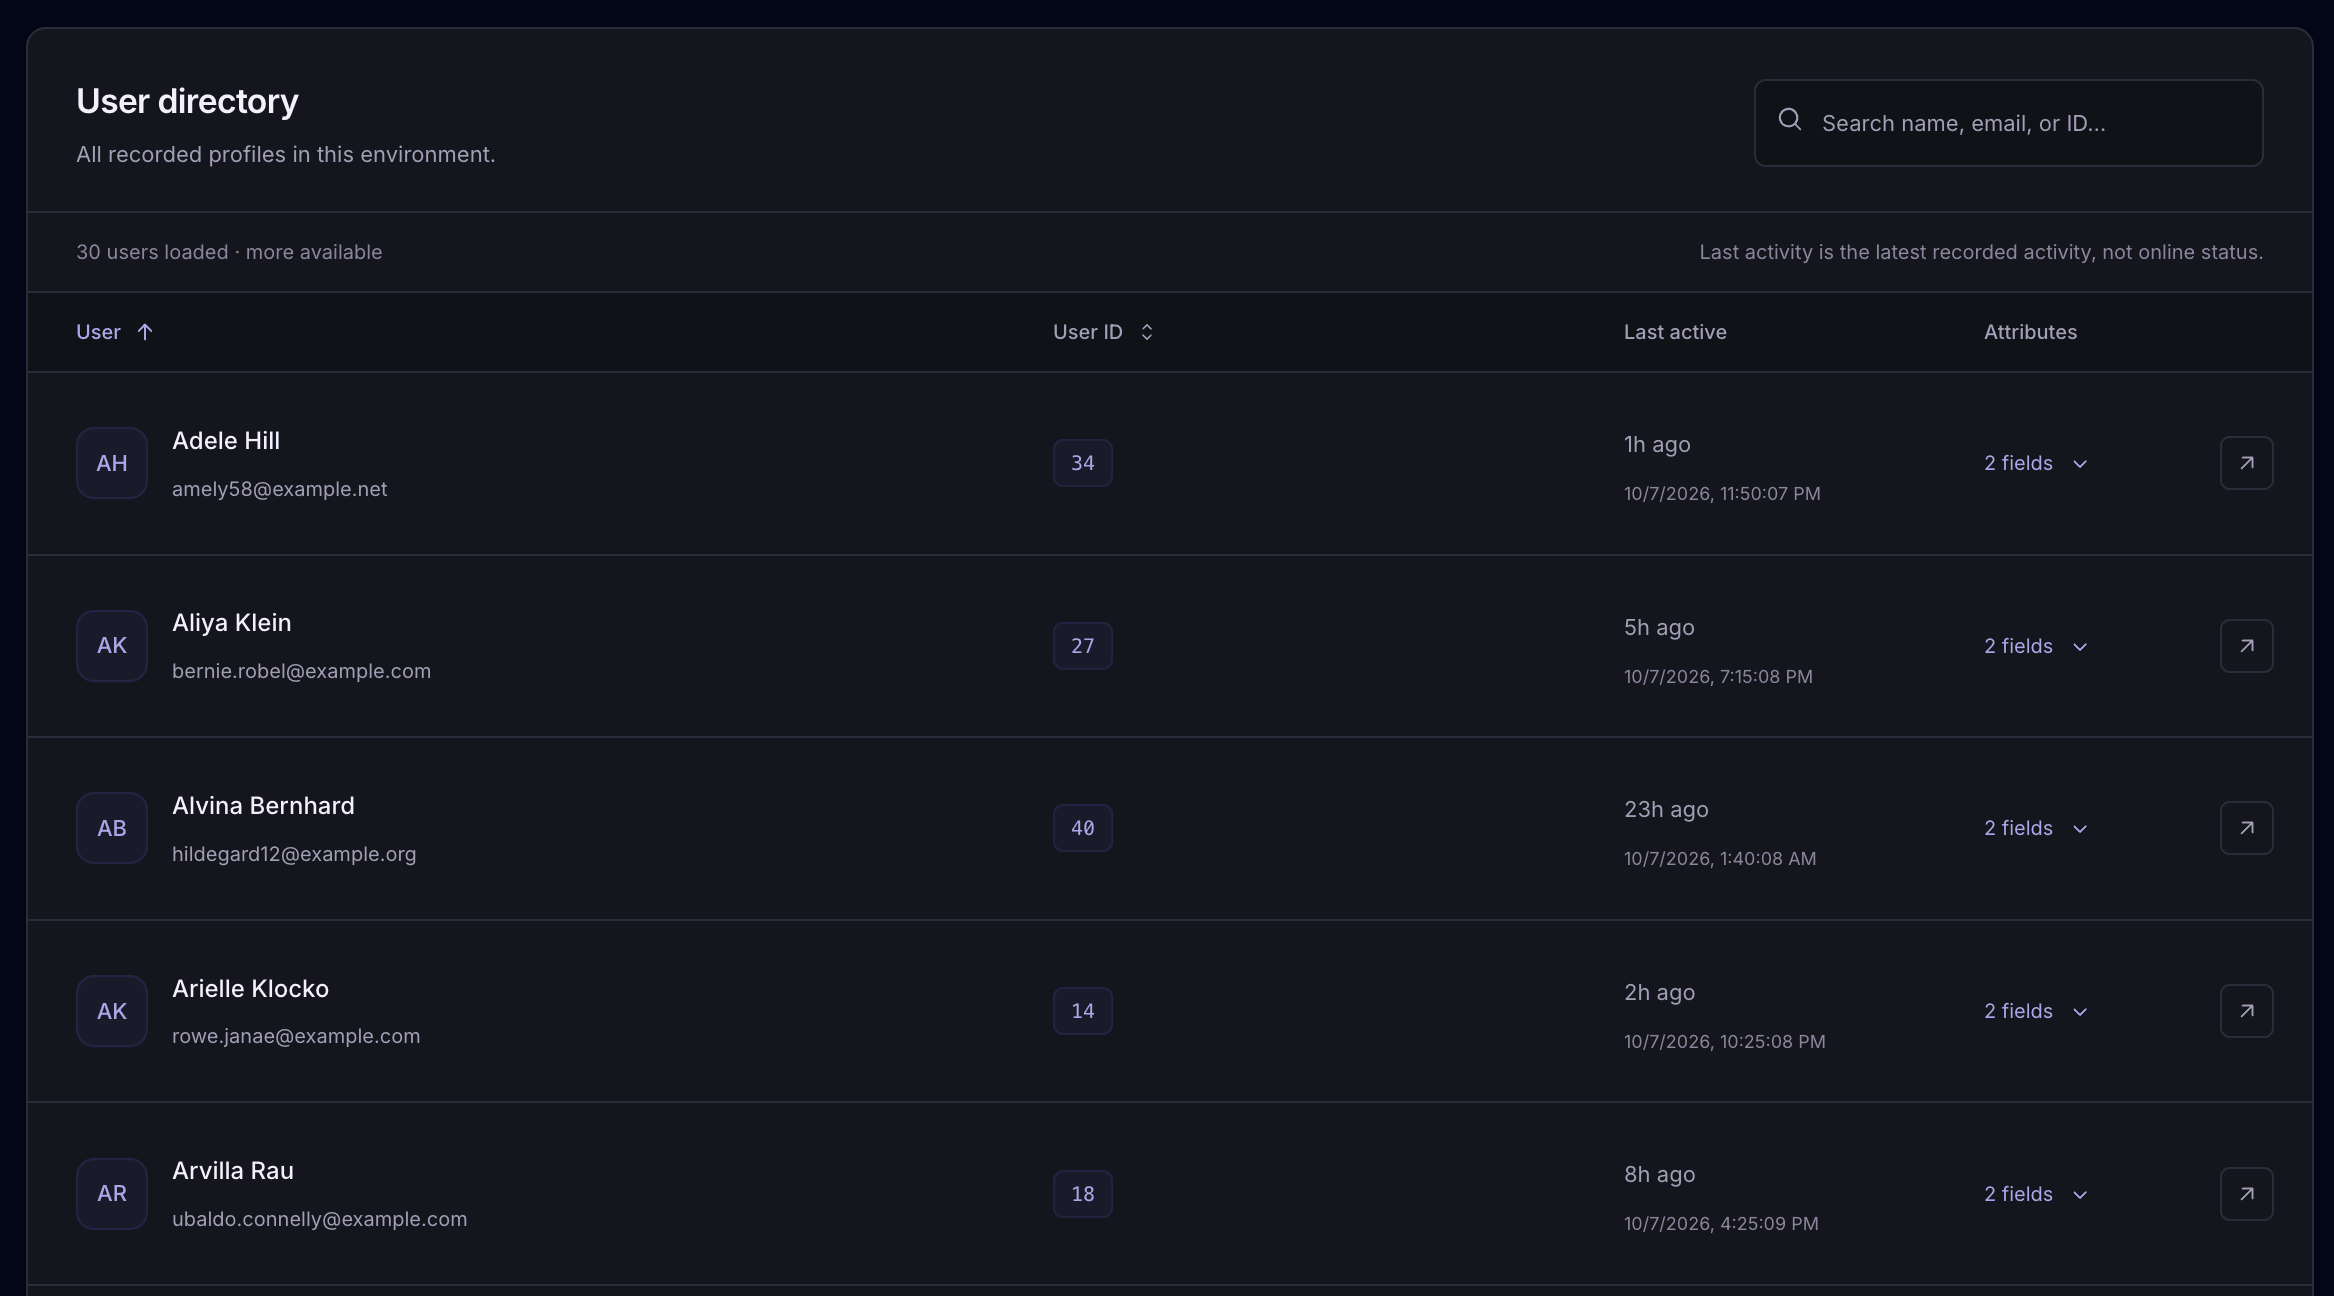
Requests and events associated with a user
Choose the time around the reported problem. Inspect the user’s recorded requests, filter by URL, method, status, or duration, and open the request that needs attention.
Use the activity tabs to inspect associated queries, exceptions, jobs, logs, and other events. Open the related execution to understand what happened around the failure.
Explore user activity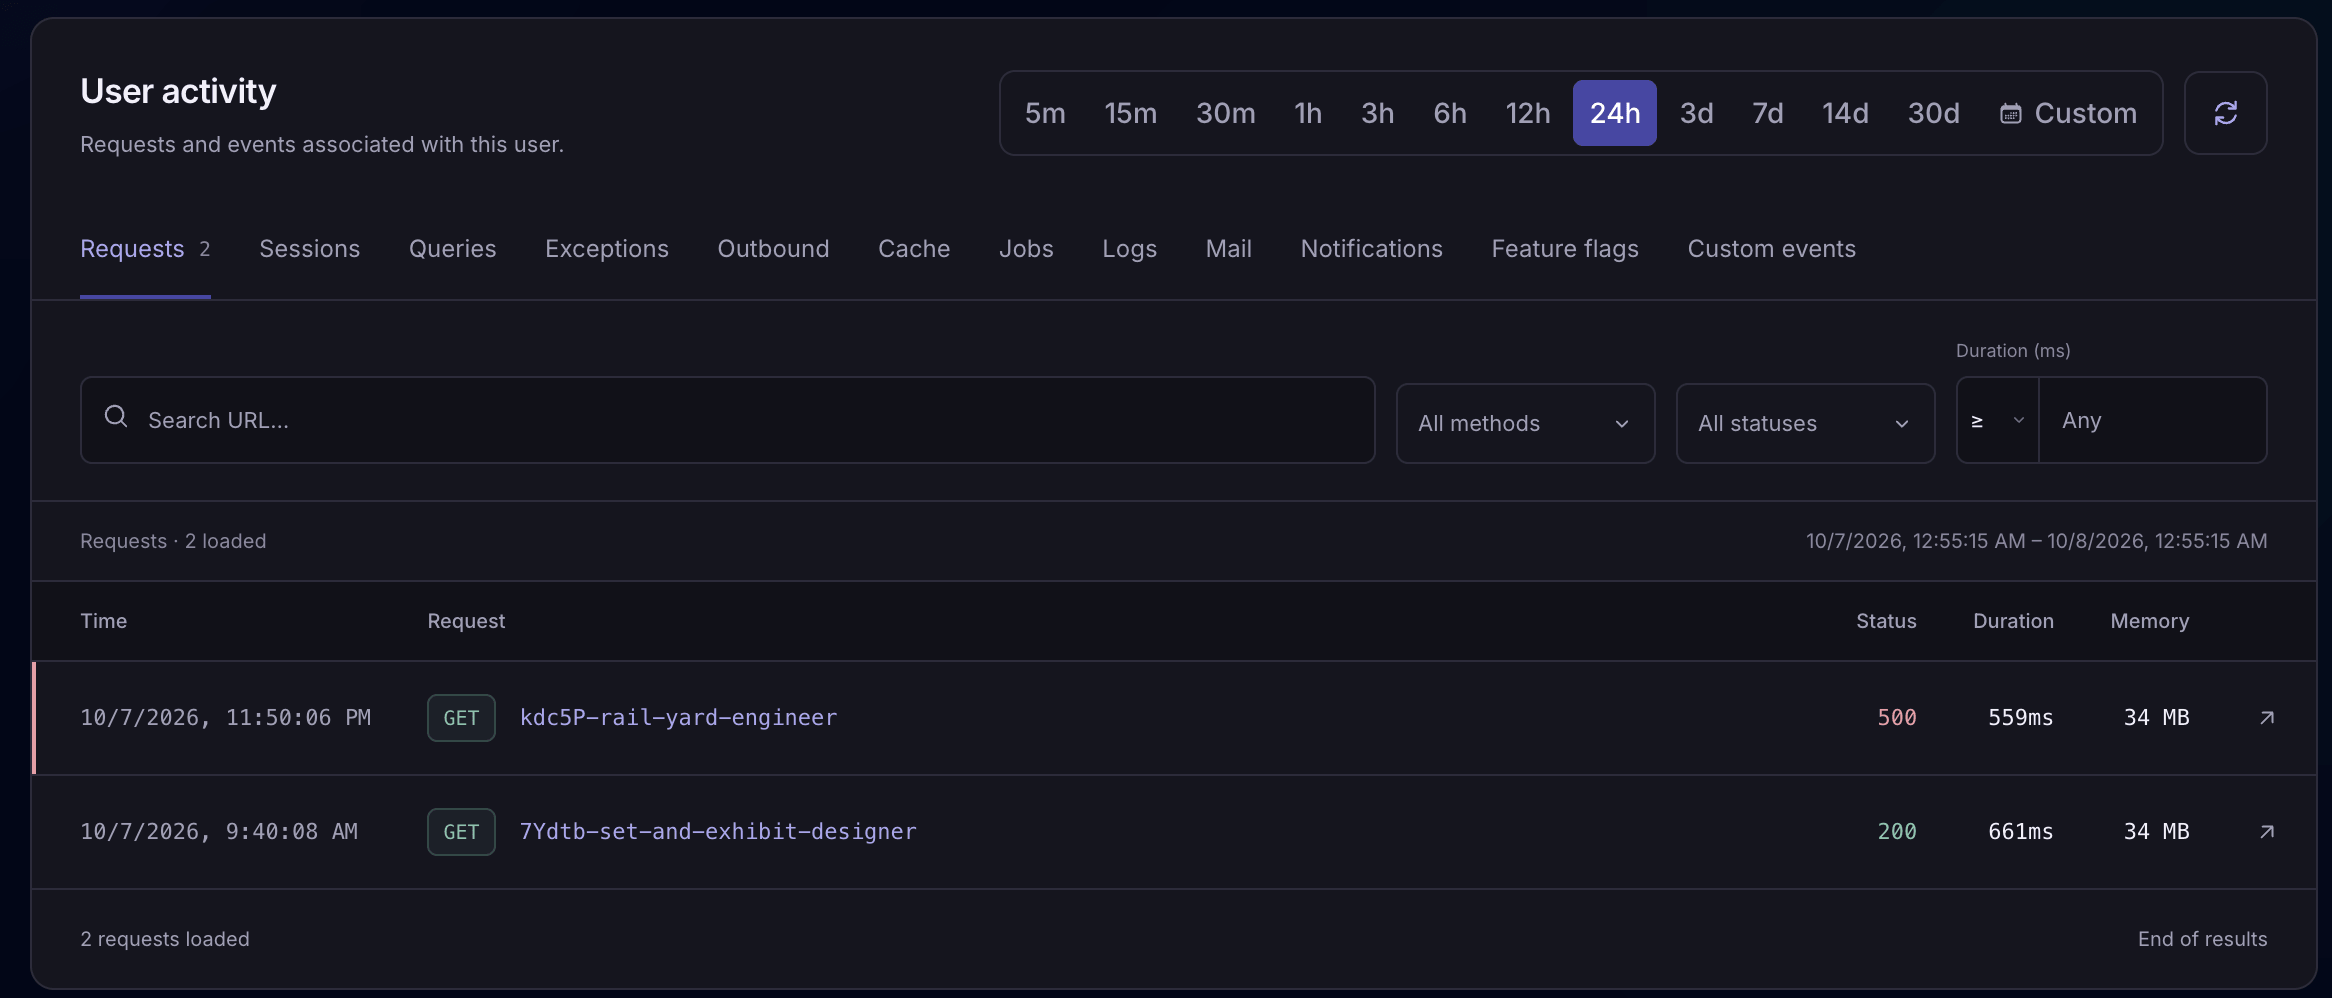
Activity appears when recorded context associates it with the user. A mail or notification entry describes an application send, rather than confirming delivery to that user.
Follow the recorded user journey
Open a session to follow its recorded requests. See the first and last recorded requests, the activity span, and available user and client details. Open a slow or failed request to inspect its events.
Add custom events for meaningful steps such as choosing a shipping option, submitting a payment, or retrying an action. Inspect them within the related execution to understand the workflow in more detail.
Learn how to add custom events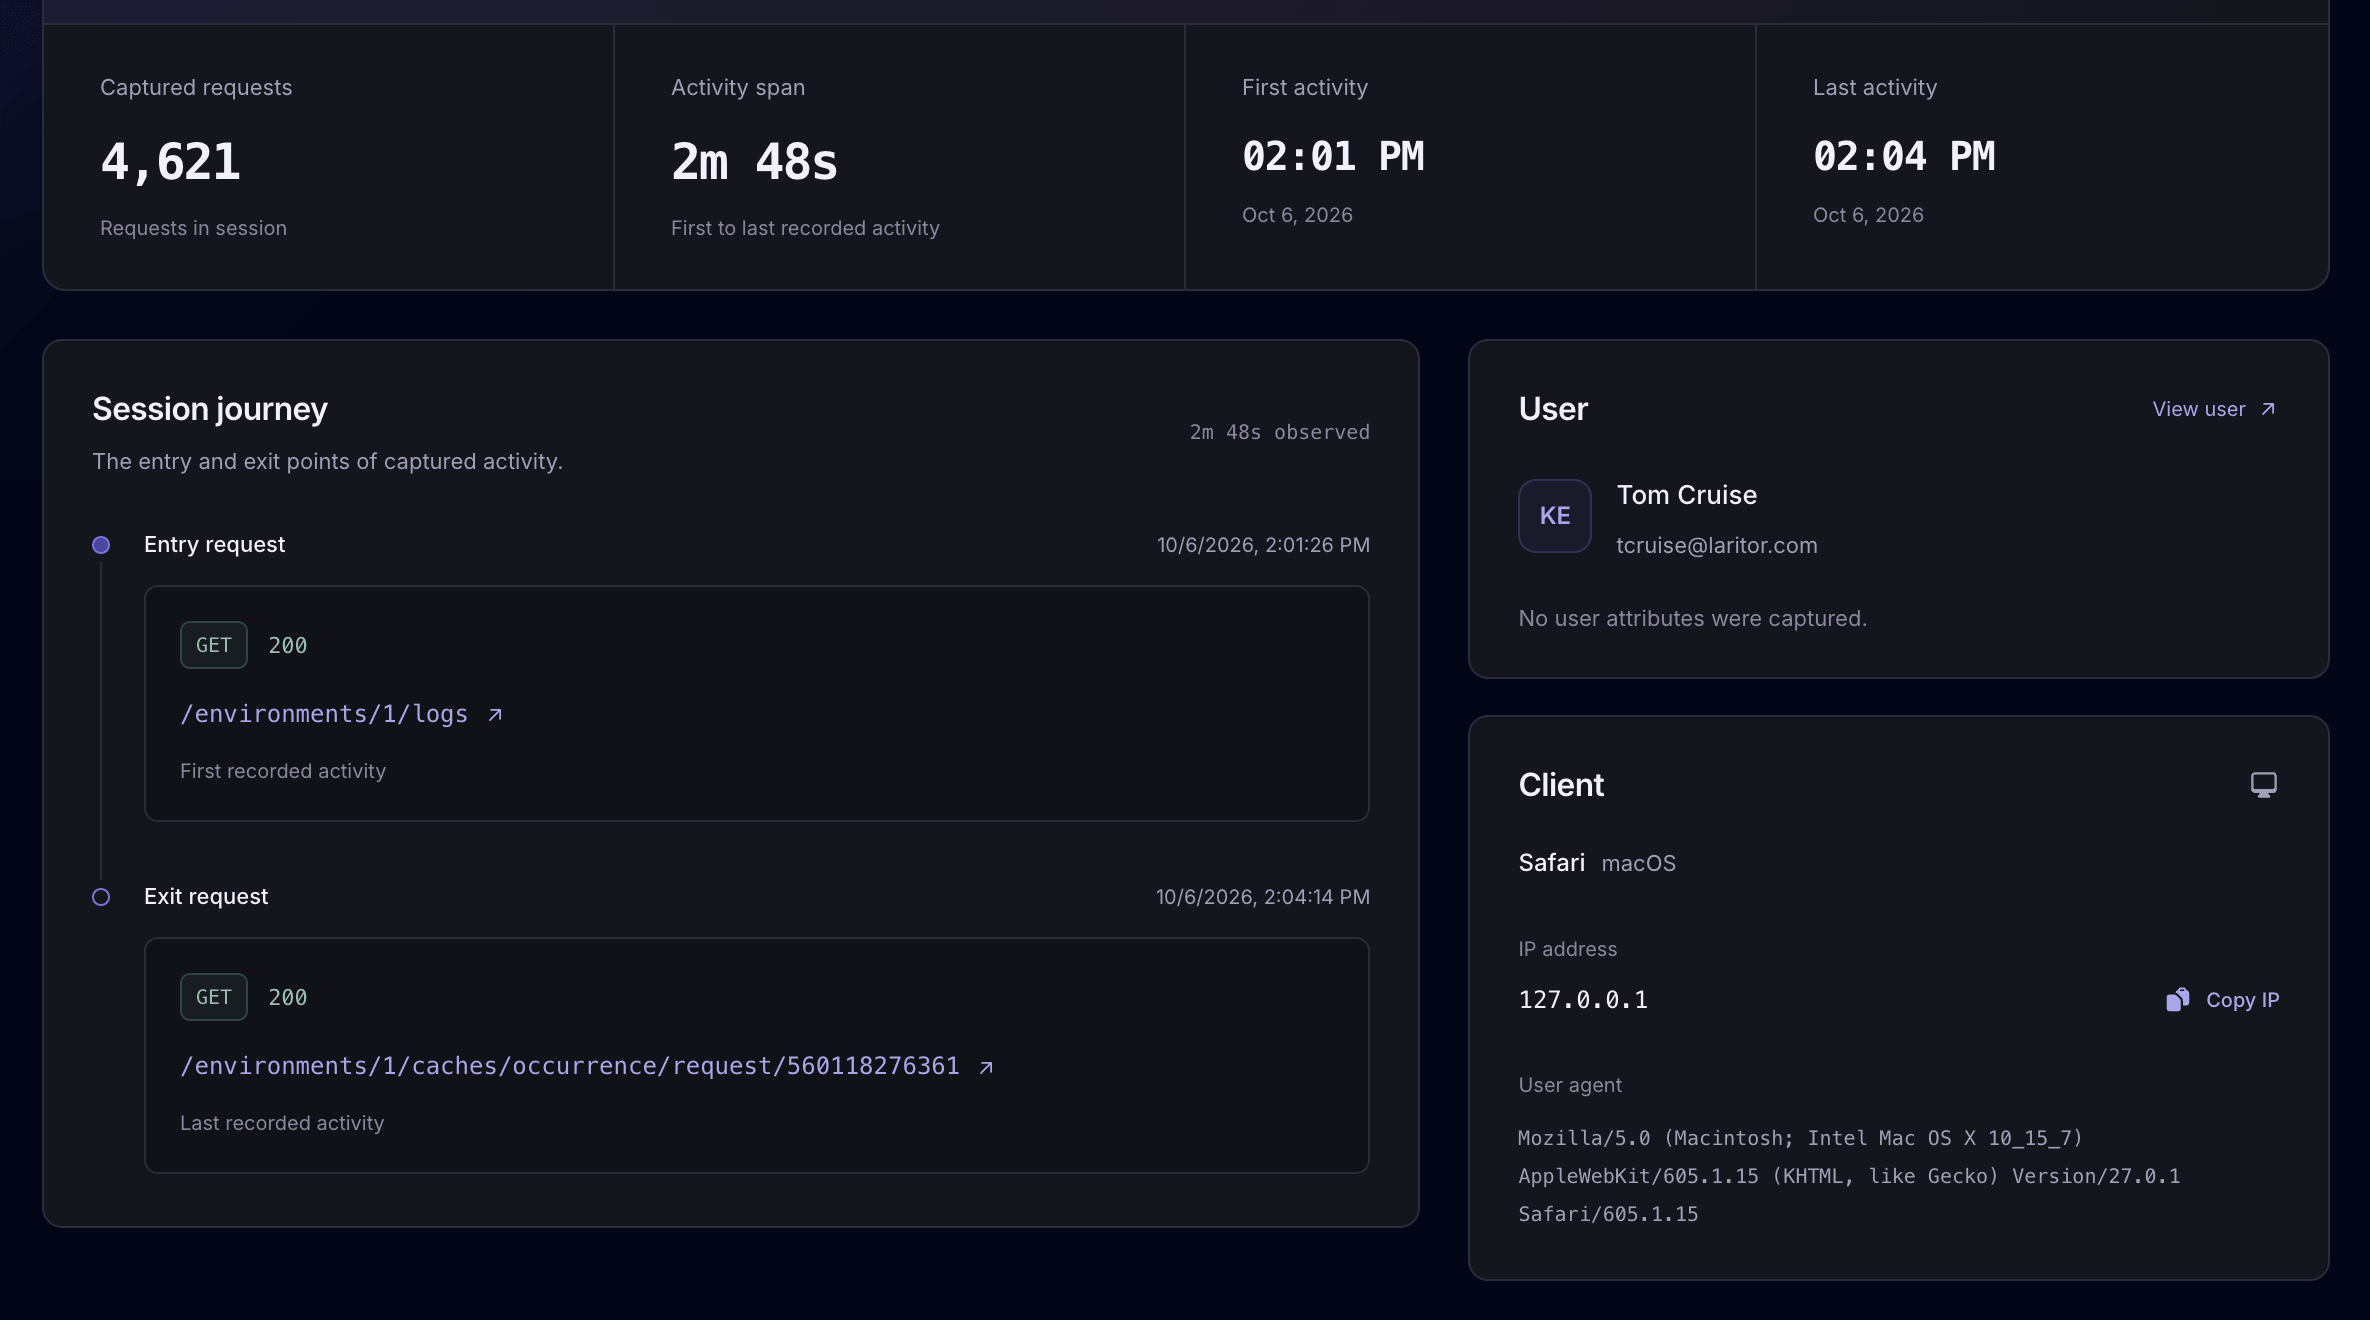
Example: investigating a checkout problem with requests and custom events
This view follows recorded server activity. It does not replay the browser screen. Recording modes and filters can leave gaps in the request history and affect the observed entry, exit, and activity span.
Custom authenticated user attributes
Sometimes an issue affects users with a particular role or belongs to one team’s workflow. Include the profile attributes your team needs to investigate those differences.
Customize the Laravel client’s redactAuthenticatedUser method to send attributes such as role and team, alongside the required user ID, name, and email fields.
Choose the information deliberately and preserve your redaction rules. The attributes shown are the values your app recorded.
Learn how to send user attributes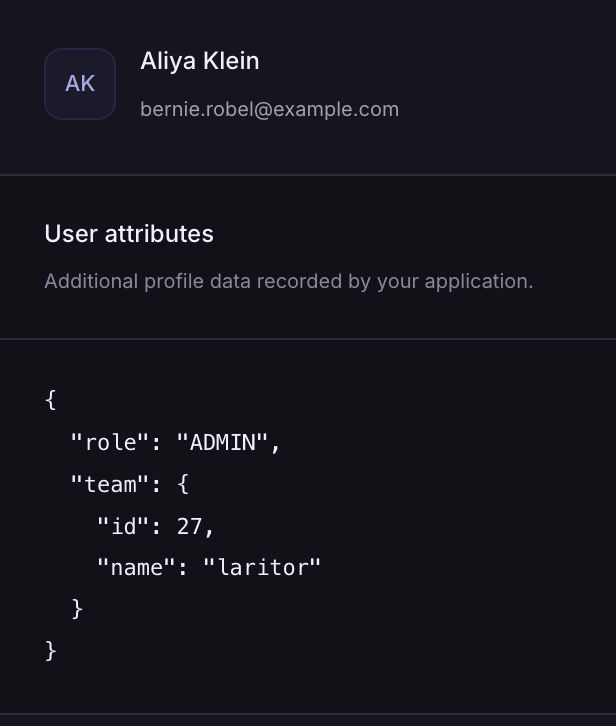
From a support report to a useful fix
Start with the user and the time they experienced a problem. Inspect the relevant request, session, or associated background work instead of relying only on the error message they saw.
Use the execution’s queries, API calls, logs, and exceptions to understand why the workflow slowed down or failed.
Search the recorded directory by name, email, or ID. Select the time around the reported problem and inspect that user’s activity.
Open the relevant request or session. Review response status and duration, then inspect related events to see where the work slowed down or failed.
Use the recorded evidence to change the code or configuration. Test the workflow again and inspect new activity to check the result.
Use Laritor how you want
Keep user context around exceptions, keep activity with detected issues, or record successful executions too.
Counts, last activity, and journeys reflect the events you send. Filtered modes can leave gaps in successful activity; full observability provides a broader request and session history.
Keep user context and related events when a request or other occurrence contains an exception. Investigate the user activity around that failure.
Useful for user-reported exceptions.
Record occurrences with detected issues, such as slow requests and failed jobs. Inspect associated user context and the related events.
Focus on application problems affecting users.
Record successful activity too. Follow a broader request and session history and compare routine user activity with failures.
Use this for a broader picture of user journeys.
Paid plans start at $20/month with 20M events included. Usage includes the requests and related events you send. Filter unnecessary activity to reduce event usage. Estimate your usage
Recording and privacy controls
Profiles, session data, and related events can contain personal or sensitive information. Laritor applies redaction before recorded data leaves your app, and you can customize what your application sends.
Keep useful identifiers and debugging context while anonymizing or removing private details your team does not need.
Explore privacy controlsUse redactAuthenticatedUser to customize or anonymize the required profile fields and any additional attributes you send.
Use recordSessionData to control session data attached to inbound requests. Review the available payload and context overrides.
Customize email-address, IP-address, string, and array-value redactors. Review the outgoing data to check that private information is handled as intended.
Laravel user activity monitoring questions
Answers about profiles, requests, sessions, activity counts, custom attributes, and privacy.
Laravel user activity monitoring connects recorded application activity to an identified user so you can investigate what they experienced. Laritor provides a searchable user directory, profile attributes, user activity views, requests and sessions, and links to related events such as queries, logs, jobs, and exceptions.
The user directory contains recorded profiles in the selected environment. It reflects the user information your application sends to Laritor, rather than a guaranteed complete export of every registered account. Recording modes, filters, authentication context, and redaction affect the data available.
Yes. The user directory includes search by name, email, or user ID. Open a recorded profile to inspect its associated activity and additional attributes. Searchable values depend on the information sent and how your redaction settings handle it.
Last active is the latest recorded activity for that user. It is not a live online status or proof that the user is currently using your app. The value reflects the activity retained by your recording settings.
The chart counts identified users with recorded requests once in each time bucket. The same user can appear in multiple buckets. Peak active users is the highest count in one bucket, not simultaneous online users. Adding bucket counts does not give the number of unique users across the whole period.
Yes. Laritor connects recorded requests within a session and shows the first and last recorded requests, activity span, and available user and client details. Open related requests to investigate slow responses or failures. Custom events can mark application-specific steps. This is recorded server activity rather than a video replay of the browser.
Yes. Choose a time window in the user activity view and inspect the relevant resource. Request filters include URL, method, status, and duration. Open recorded executions to inspect related events. Jobs and other resources appear when their recorded context associates them with the user; not every background operation is automatically attributed to a user.
Yes. Override redactAuthenticatedUser in the Laravel client and return the required id, name, and email fields with additional attributes you choose to send, such as role or team. Preserve your privacy rules when building that data. Laritor displays the recorded attributes alongside the user profile.
No. Exceptions-only and issue tracker modes retain user context and activity from occurrences that are kept. Full observability also records successful activity for broader request and session histories. User counts, last activity, and journeys reflect recorded data, so filtered modes can leave gaps in an otherwise successful journey.
Yes. Laritor applies redaction before recorded data leaves your app. Customize redactAuthenticatedUser and other redactors to anonymize profile fields, email addresses, IP addresses, and sensitive strings or structured values. You can also control session data with recordSessionData. Review outgoing data and keep only the context needed for investigation.
Install in under 1 minute
Add Laritor’s Laravel client, choose a recording mode, and inspect user activity alongside the events behind it.
Free trial: 300K events · Unlimited apps and users