
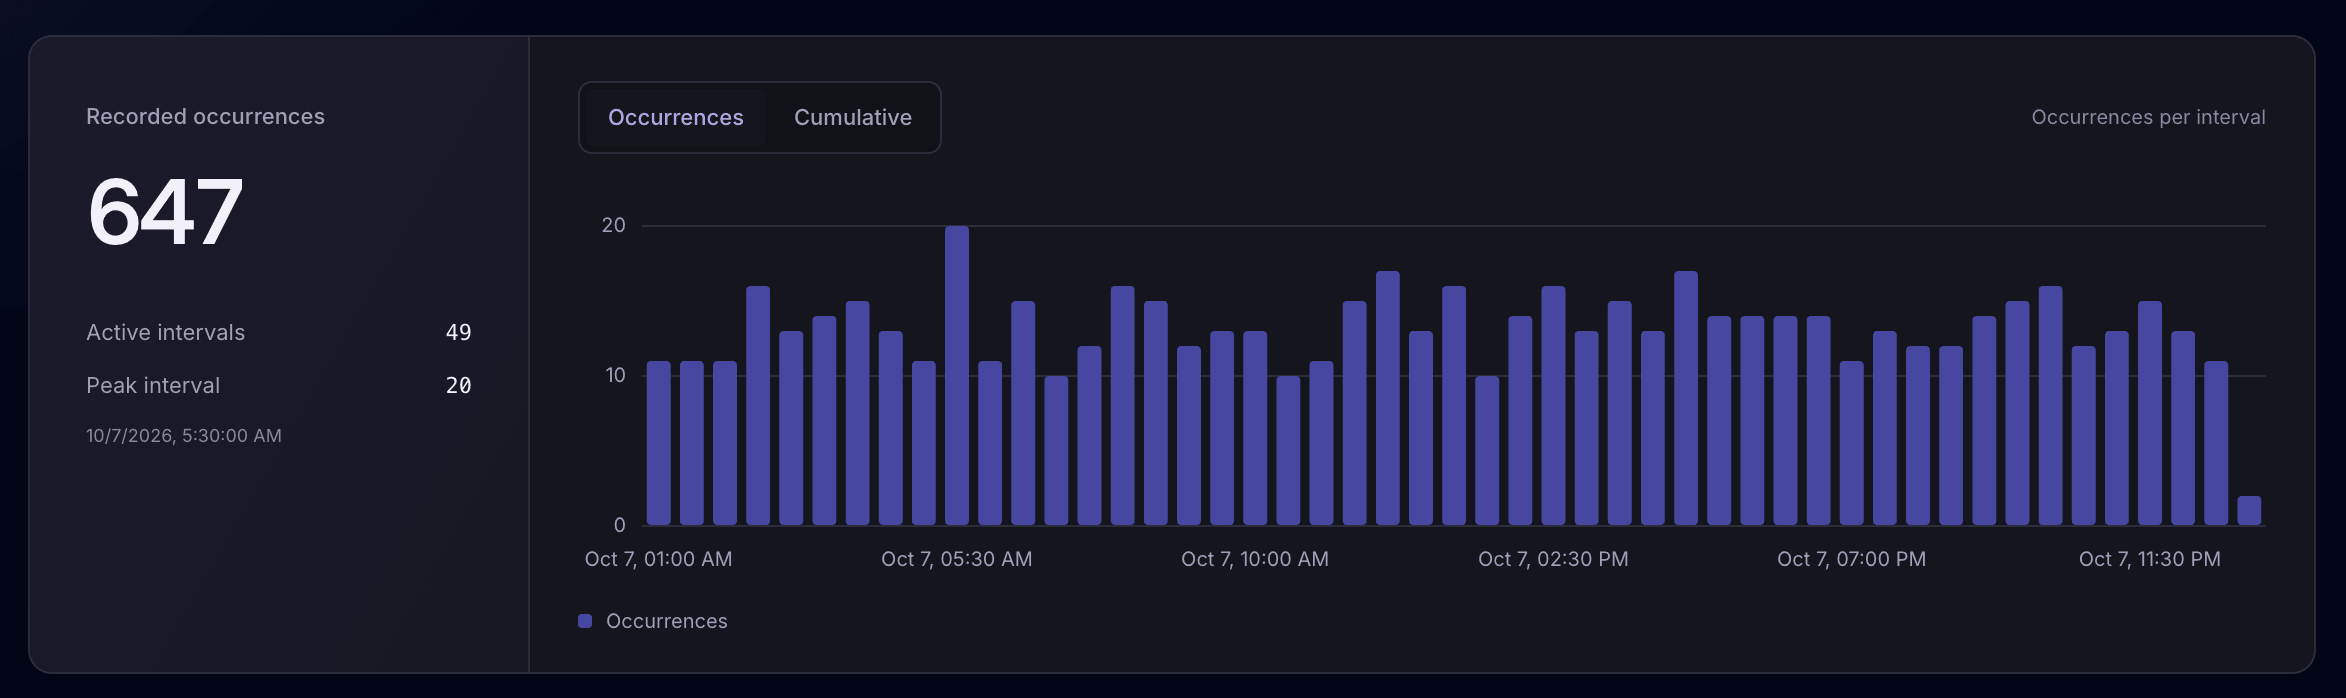
Recorded occurrences
See how many times the selected event was recorded during the chosen period. Each recorded event is an occurrence, even if one execution records it several times.
Laravel custom event tracking
Laritor is a performance monitoring and issue tracking tool for Laravel. Add named events for actions like checkout steps, payment retries, or completed job phases. See how often they happen, inspect the data attached to each event, and open the request or job behind it.
Free trial: 300K events · Unlimited apps and users
Record your app’s actionsA name and useful metadata.
Follow event activityOccurrence counts and history.
Inspect the related workOpen the execution timeline.
See how many times the selected event was recorded during the chosen period. Each recorded event is an occurrence, even if one execution records it several times.
See how many time intervals contain recorded occurrences. Use the chart to understand when the event happens most often.
Find the interval with the most recorded occurrences. Compare busy periods with changes in traffic or the work your app is doing.
The Occurrences view shows counts per interval. Cumulative shows the running total over the selected period. These are recorded event counts, rather than unique users or completed transactions.
From an event name to an occurrence
Open Custom Events in Laritor, select an event, and choose a time window. Review its frequency chart and occurrence history, then use the execution filter and sort order to focus your investigation.
Each history entry shows when the event occurred, where it was recorded, and the captured context. Expand its metadata or follow the origin to inspect the request, job, command, or scheduled task.
Explore custom event tracking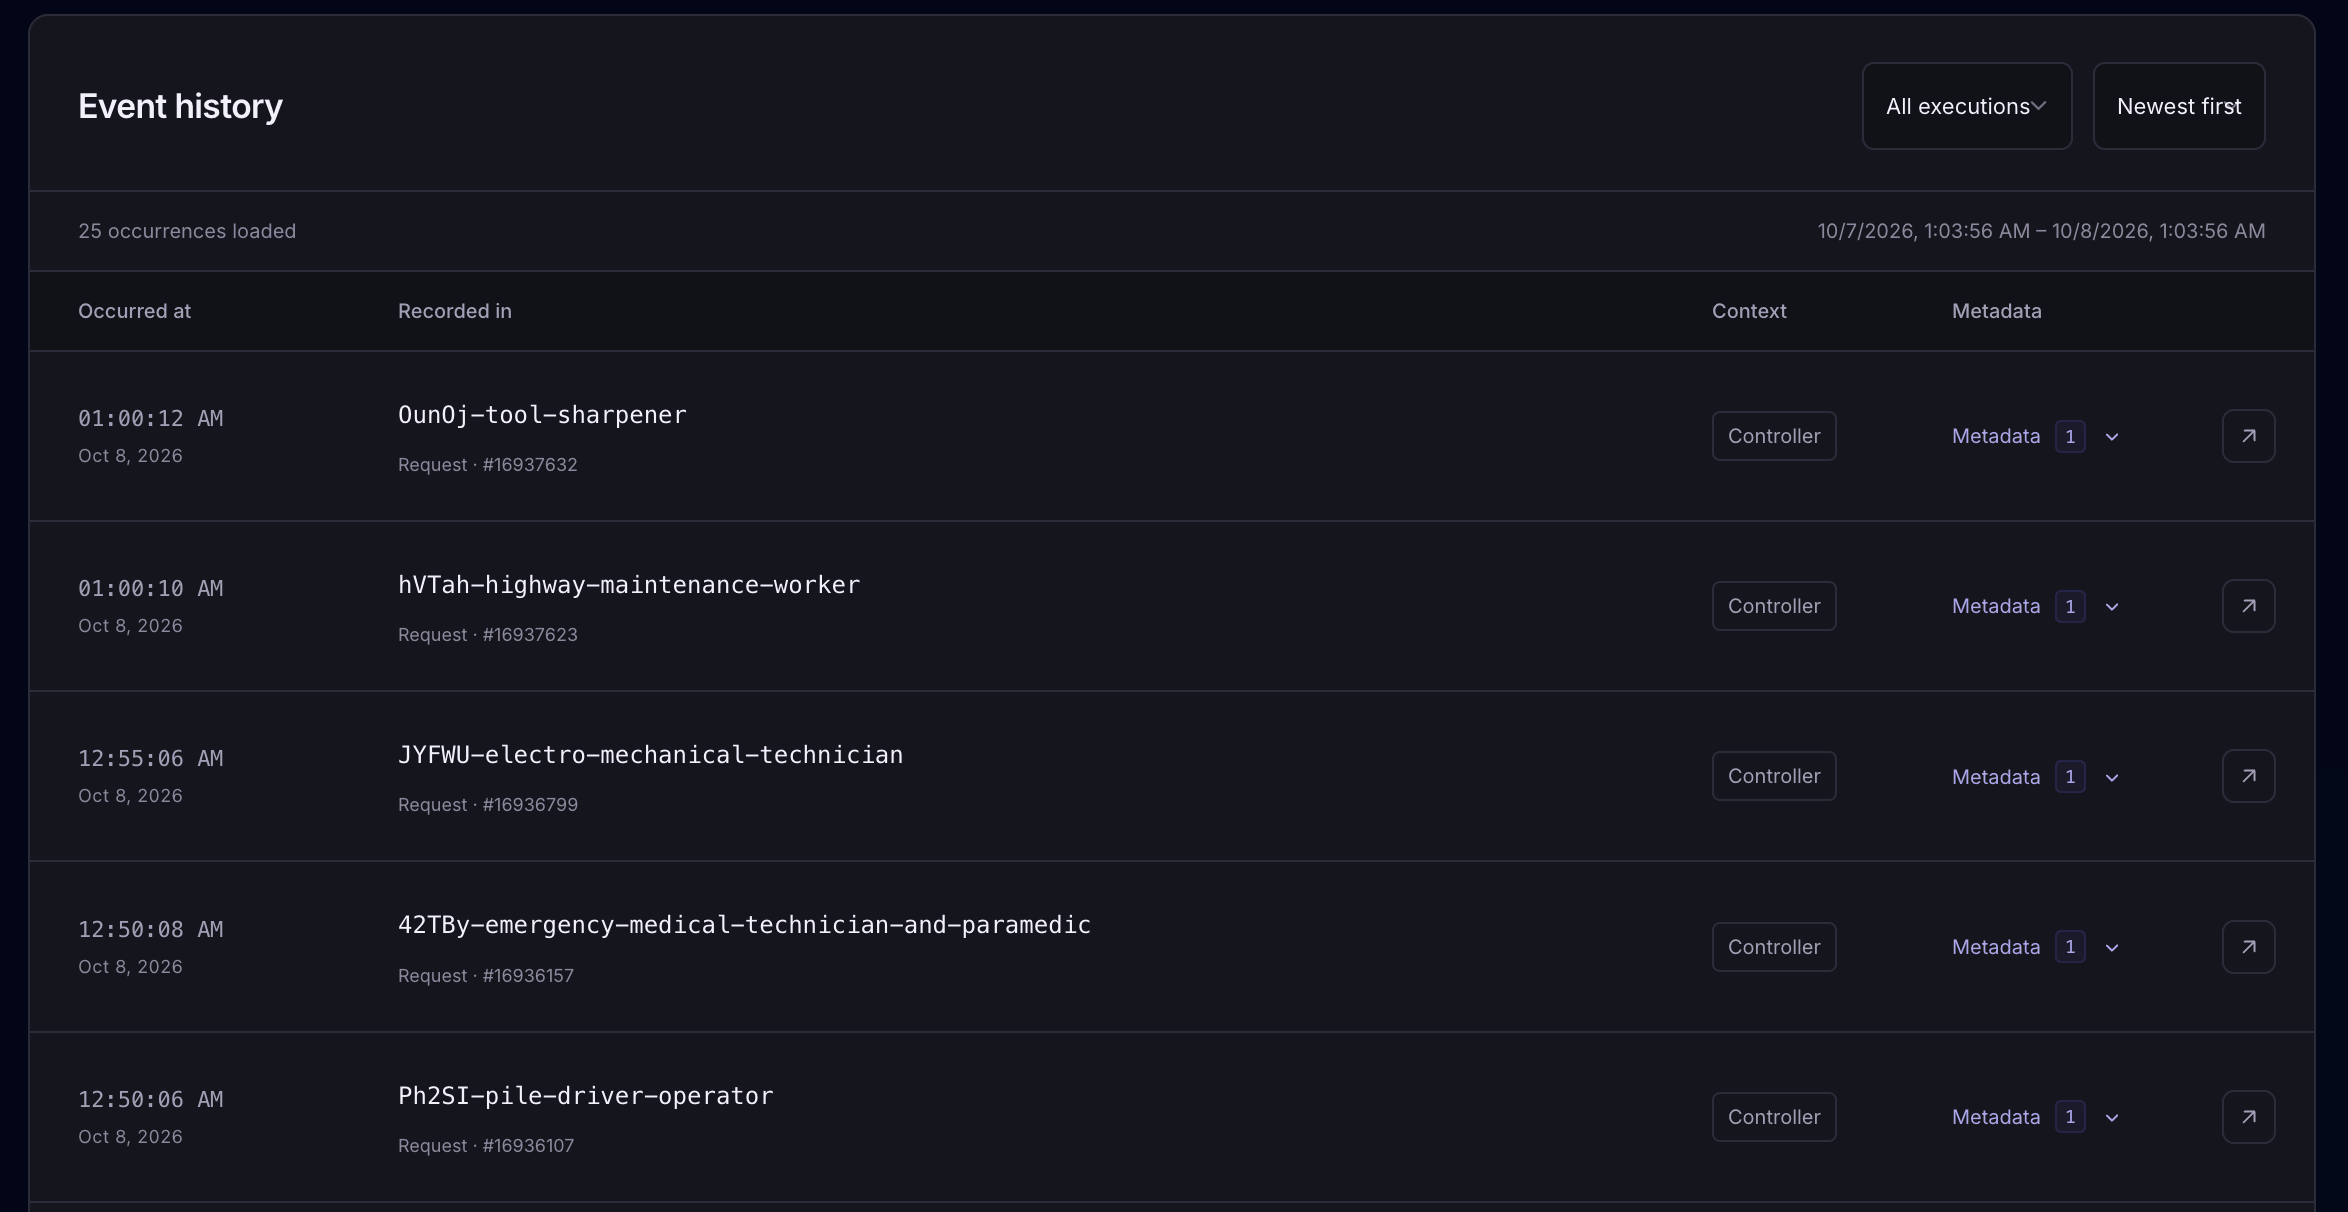
Check the occurrence timestamp and selected date range to find the event around a reported problem.
See the request, job, command, or scheduled task that recorded it. Follow the origin to inspect that execution.
Expand the metadata recorded with that occurrence. Use it to understand the action and its application context.
Context you choose to record
A name tells you what happened. Metadata helps explain that occurrence: which cart, which tenant, how many records, or which provider your code used.
Pass those details as the second argument to Laritor::addCustomEvent(). Open an occurrence to inspect the values recorded at that point, alongside its originating execution.
The metadata belongs to that occurrence. It is a snapshot of what your app sent, rather than a live view of the underlying model.
Learn how to attach metadata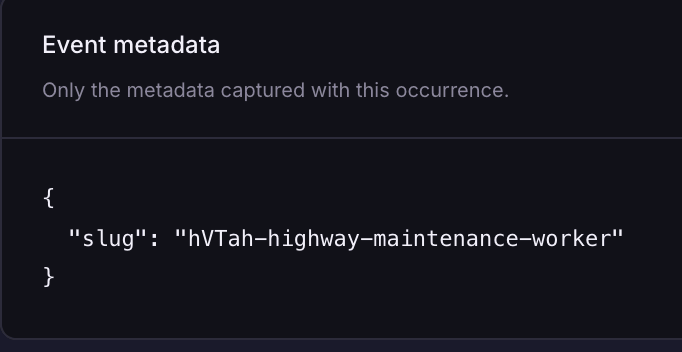
Record events from your Laravel code
Install and configure the Laravel client, then call Laritor::addCustomEvent('event-name', [/* metadata */]) inside the execution you want to inspect.
Use a stable name for each behavior and put changing values in metadata. Place completed-step markers after the step succeeds so the event describes what your code reached.
Install the Laravel clientRecord milestones when your code reaches them. Inspect a checkout request to see whether payment authorization followed checkout setup, and review the queries or API calls between those steps.
Place these calls at the corresponding steps in your existing checkout code. Repeated events or retries can create several occurrences for the same cart.
use BinaryBuilds\LaritorClient\Laritor;

Laritor::addCustomEvent('checkout.started', [
    'cart_id' => $cart->id,
    'items_count' => $cart->items()->count(),
]);

// After your payment code confirms authorization:
Laritor::addCustomEvent('checkout.payment_authorized', [
    'cart_id' => $cart->id,
    'payment_provider' => 'stripe',
]);Mark the start of a tenant sync, the end of its remote fetch, and the end of persistence. Use the job timeline to inspect what happened between milestones when a job is slow or fails.
These markers describe the points where your code records them. Inspect the work between those points to understand the phase’s timing.
use BinaryBuilds\LaritorClient\Laritor;

Laritor::addCustomEvent('tenant-sync.started', [
    'tenant_id' => $tenant->id,
]);

// After your remote fetch completes:
Laritor::addCustomEvent('tenant-sync.remote-fetch.completed', [
    'records_received' => $recordsCount,
]);

// After your persistence step completes:
Laritor::addCustomEvent('tenant-sync.persist.completed', [
    'records_written' => $writtenCount,
]);Record when a command or scheduled task uses an expensive fallback. Compare its frequency over time, then open an occurrence to inspect the cache operations, queries, or external calls around it.
Choose a stable event name for each behavior, and attach small pieces of useful metadata rather than entire models or responses.
use BinaryBuilds\LaritorClient\Laritor;

// When your report code enters its fallback path:
Laritor::addCustomEvent('reports.cache-miss-fallback', [
    'report' => 'monthly-revenue',
    'environment' => app()->environment(),
]);
Custom events in the execution timeline
A custom event is more useful when you can see what happened before and after it. Laritor places your markers in the recorded execution timeline, alongside queries, outbound requests, logs, exceptions, and other events.
Use that order to investigate whether a fallback preceded a failed API call or where a job slowed down between phases. Inspect the related work before deciding what to fix.
Example: following a recorded checkout request that fails during payment authorization
Understand your users’ workflows
Use user activity and sessions to follow recorded requests in a journey. Add custom events for meaningful server-side actions such as choosing a shipping option, submitting payment, or scheduling a retry.
Open the relevant request to inspect those markers and the events around them. Recording modes and filters determine which steps are available.
Explore user activity and sessionsA small amount of useful instrumentation
Start with a workflow that is hard to investigate today. A few well-placed events can show where it starts, which path it takes, and which steps complete.
Keep event names consistent and metadata small. The examples are markers to add to your existing code; they do not perform the payment, sync, or fallback operation.
Choose a stable name for a useful action, such as checkout.started or inventory.sync.completed. Keep changing IDs in metadata so occurrences stay grouped under the same name.
Call Laritor::addCustomEvent() where the action happens. Mark a completed step after it succeeds, and attach the IDs, counts, or provider names needed to investigate it.
Open the event in Laritor, select a period, and review its occurrences. Follow an occurrence to the request or job timeline to understand the related work.
Use Laritor how you want
Custom events within a request, job, command, or scheduled task follow whether that occurrence is retained. Choose how much application activity you want to keep.
Counts reflect recorded events. Filtered modes can leave gaps in successful workflows, and repeated calls can produce several occurrences for one action. Adding a custom event does not by itself make an occurrence an issue.
Keep custom events and related activity from occurrences that contain an exception. Use your markers to understand what happened before the failure.
Add application context to exception debugging.
Keep custom events from occurrences with detected issues, such as slow requests and failed jobs. Use milestones to inspect the affected workflow.
Focus on the application work that needs attention.
Record successful activity too. Follow routine workflows and compare event frequency across successful and problematic executions.
Use this for broader workflow and event trends.
Paid plans start at $20/month with 20M events included. Custom events contribute to the events you send. Mark useful transitions to keep recording focused. Estimate your usage
Choose metadata and protect sensitive information
Choose the metadata you send. Keep useful debugging details while avoiding passwords, API tokens, payment details, or personal information your team does not need.
Laritor applies redaction before recorded data leaves your app. Customize the rules to handle your application’s sensitive values, and review outgoing event data.
Explore privacy controlsPrefer an ID, count, provider name, or mode over a full model or raw response. The metadata array should explain this occurrence.
Use redactArrayValue to handle sensitive key-value pairs and redactString for private string values.
Review profile, email-address, and IP-address redactors as well as the queries, logs, and other events attached to the same execution.
Laravel custom event tracking questions
Answers about instrumentation, metadata, occurrence counts, timelines, user journeys, and recording modes.
Custom event tracking records named actions from your own application code, such as a checkout step, payment retry, or completed job phase. Laritor is a Laravel performance monitoring and issue tracking tool that shows these events with their metadata, occurrence counts, and the recorded requests, jobs, commands, or scheduled tasks where they happened.
Install and configure the Laritor Laravel client, import BinaryBuilds\LaritorClient\Laritor, and call Laritor::addCustomEvent() at the point you want to record. Pass an event name as the first argument and an array of useful metadata as the second. Place the call inside the request, job, command, or scheduled task you want to inspect.
Custom events appear on the timeline of the recorded request, job, command, or scheduled task. They also appear in the Custom Events view, where you can select an event, inspect its occurrence chart and history, open attached metadata, and follow each occurrence to its originating execution.
Include small pieces of debugging context such as a cart ID, tenant ID, record count, provider name, or selected path. Laritor stores the metadata captured with that occurrence. Choose fields your team needs, avoid secrets and unnecessary personal information, and review your redaction settings before sending production data.
No. Recorded occurrences count how many times the selected event was recorded. One user, cart, or execution can produce multiple occurrences, including retries. Active intervals count time intervals containing recorded occurrences, and peak interval is the largest count in one interval. Use relevant identifiers and execution context to investigate individual workflows.
Yes. Add custom events where your server-side code reaches meaningful actions, such as starting checkout or confirming payment authorization. Inspect those markers within the related requests and use user activity and sessions to follow the recorded journey. The calls record application actions; they do not automatically capture every browser click or provide a screen replay.
Yes. Add milestones around job phases such as remote fetch, transformation, and persistence. Open the recorded job timeline to inspect queries, outbound requests, logs, exceptions, and the markers between phases. Recording a named event does not automatically measure a whole phase; use its placement and the execution timeline to understand the work.
Custom events in a request, job, command, or scheduled task follow whether that occurrence is retained. Exceptions-only mode keeps occurrences with exceptions, issues-only keeps occurrences with detected issues, and full observability also records successful activity. Filters and limits affect the events available. Adding a custom event does not by itself make the occurrence an issue.
Yes, for the activity Laritor records. The occurrence chart shows counts over time, and the cumulative view shows the running total over the selected period. Recording modes, filters, limits, missing instrumentation, and repeated calls affect those totals. Filtered counts do not represent every successful action in your application or a deduplicated conversion rate.
Use stable, descriptive names such as checkout.started, checkout.payment_authorized, tenant-sync.persist.completed, or reports.cache-miss-fallback. Keep the same name for the same behavior and put changing IDs or counts in metadata. Place markers around meaningful transitions so timelines stay useful and event usage stays focused.
Install in under 1 minute
Add Laritor’s Laravel client, choose a recording mode, and record custom events at the steps you want to understand.
Free trial: 300K events · Unlimited apps and users