
Search messages and context
Look for a message, keyword, or value your app included in the log context. Find the entries related to the problem you are investigating.
Laravel log monitoring
Laritor is a performance monitoring and issue tracking tool for Laravel. Search your application logs, read their full messages and context, and open the request or job that produced them. Understand what your app was doing when a problem occurred.
Free trial: 300K events · Unlimited apps and users
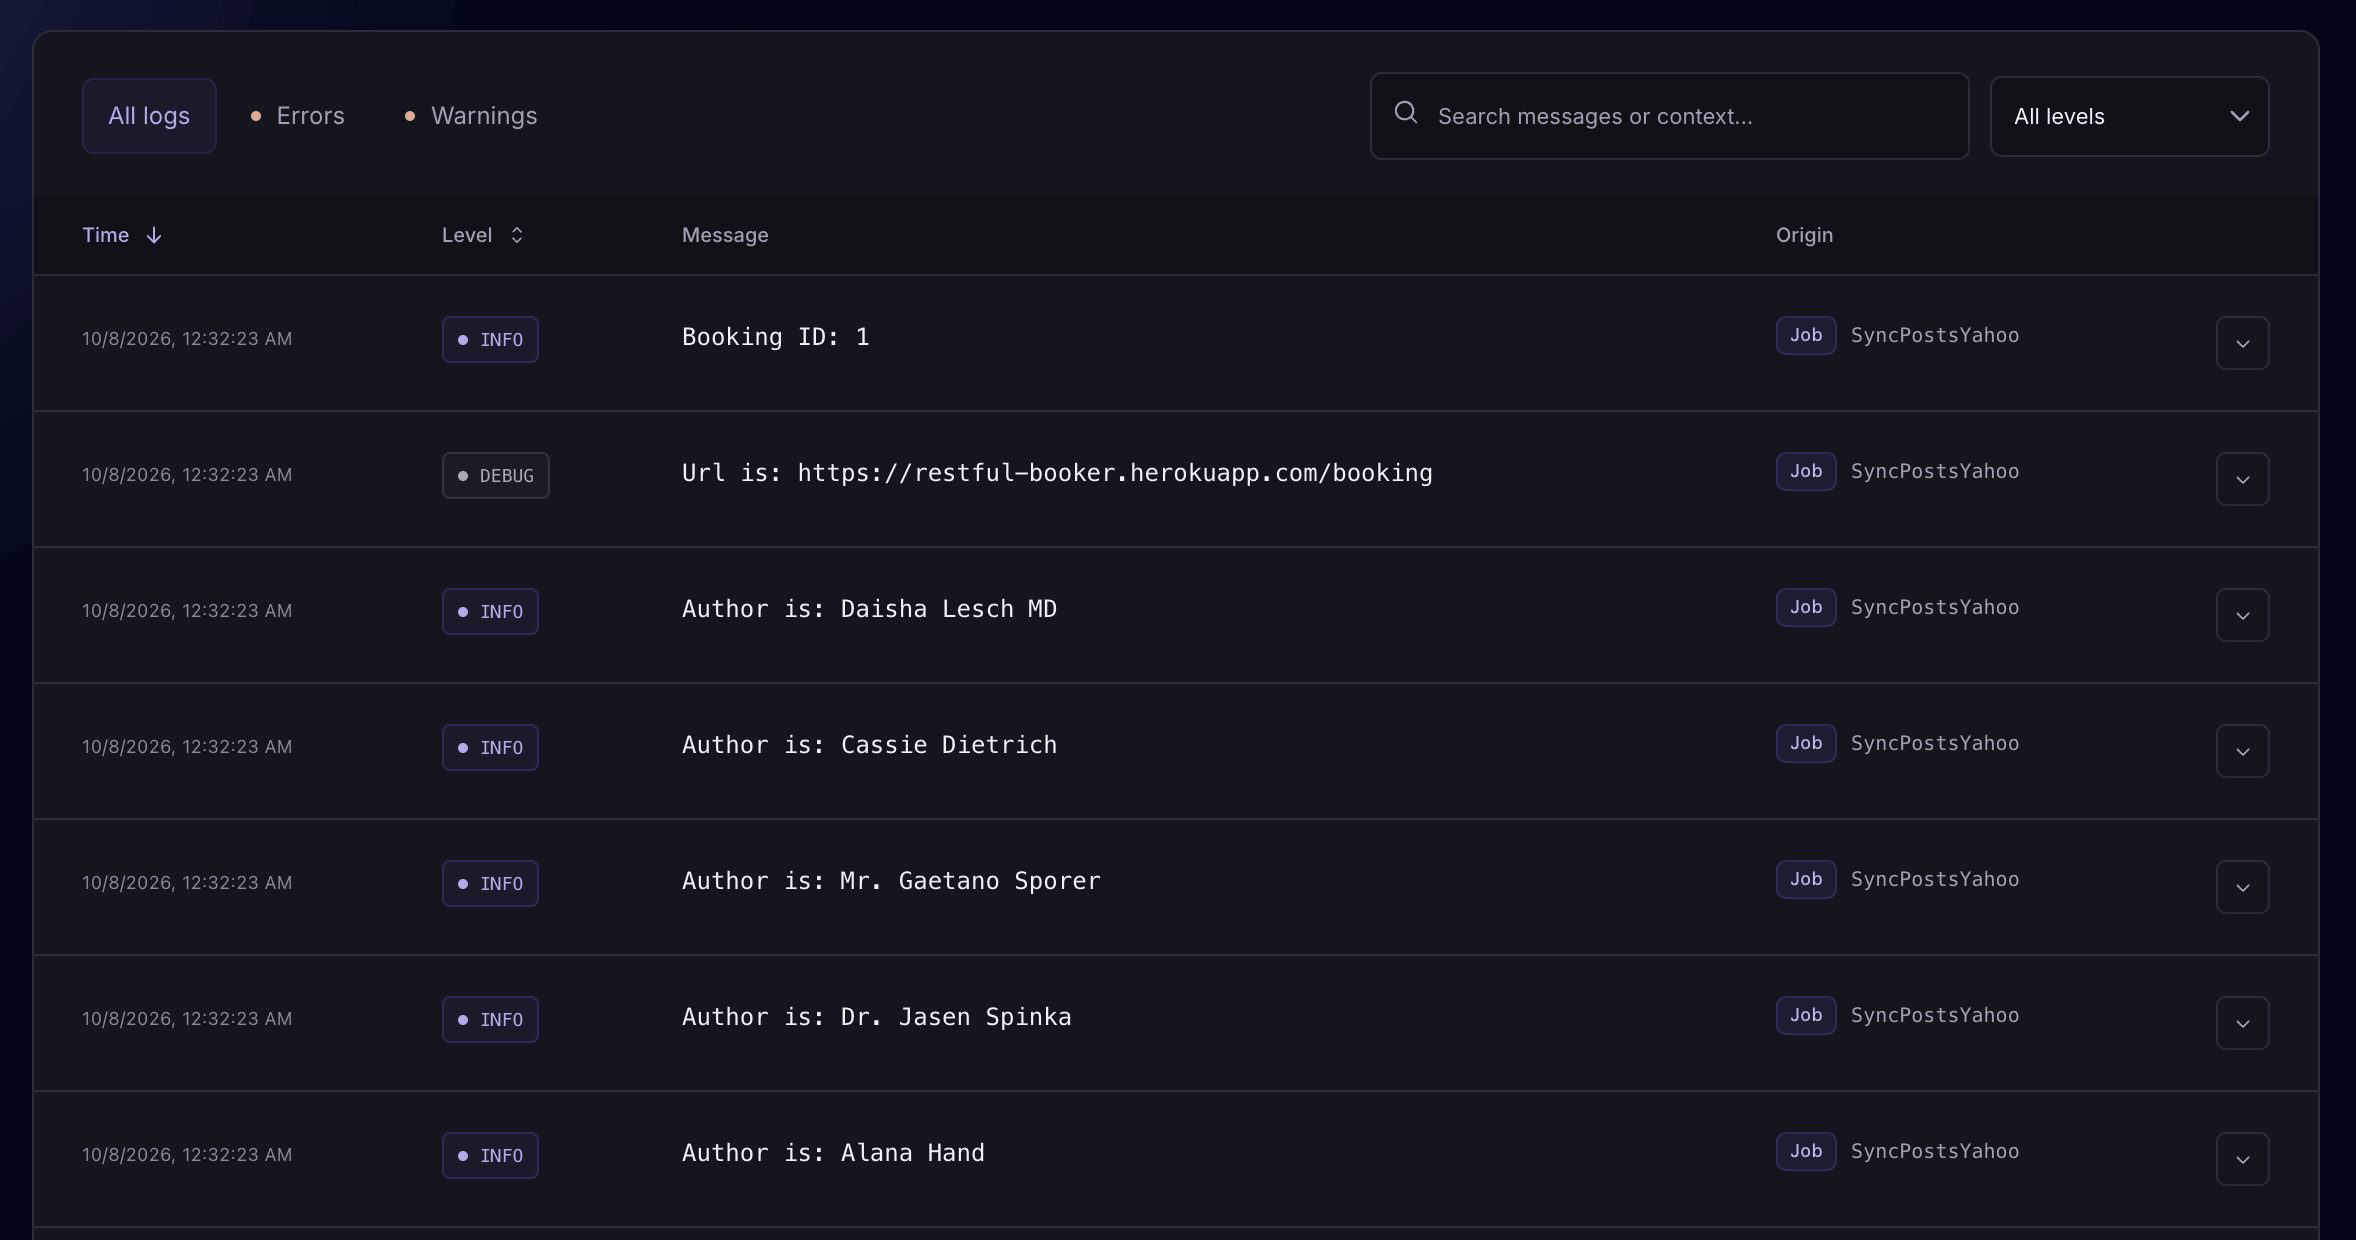
Find relevant entriesSearch messages and recorded context.
Read the detailsFull messages, levels, and JSON context.
Follow the originOpen the request, job, command, or task.
Search and filter Laravel logs
Look for a message, keyword, or value your app included in the log context. Find the entries related to the problem you are investigating.
Use the Errors or Warnings view, or choose the levels you want to inspect. Narrow the date range to the time a problem occurred.
Expand a row to see the complete message and recorded context. Copy the message or JSON when you need to share details with a teammate.
Keep using Laravel’s logger. Laritor captures application log entries according to your recording settings.
Explore log filters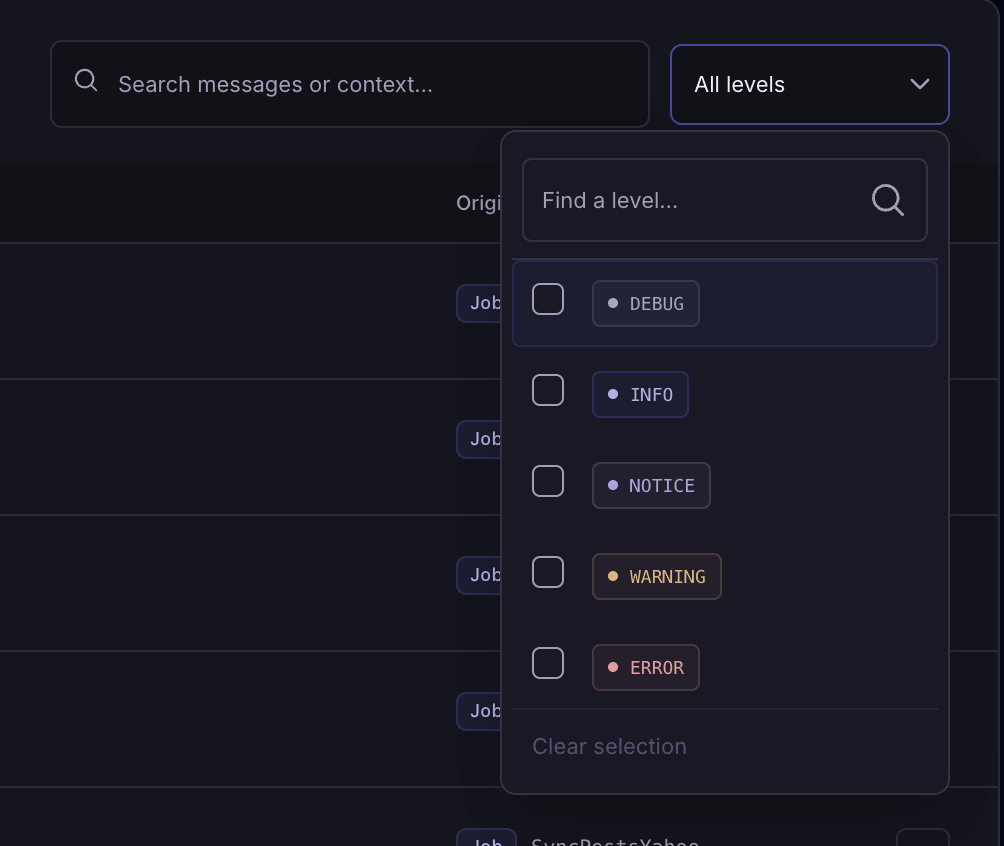
Full messages and structured context
Expand an entry to read its full message and recorded JSON context. See the details your code attached, such as the URL it called or the job it was running.
Then follow the origin link to inspect the related execution. Read the log alongside queries, outbound requests, cache activity, exceptions, and other recorded events.
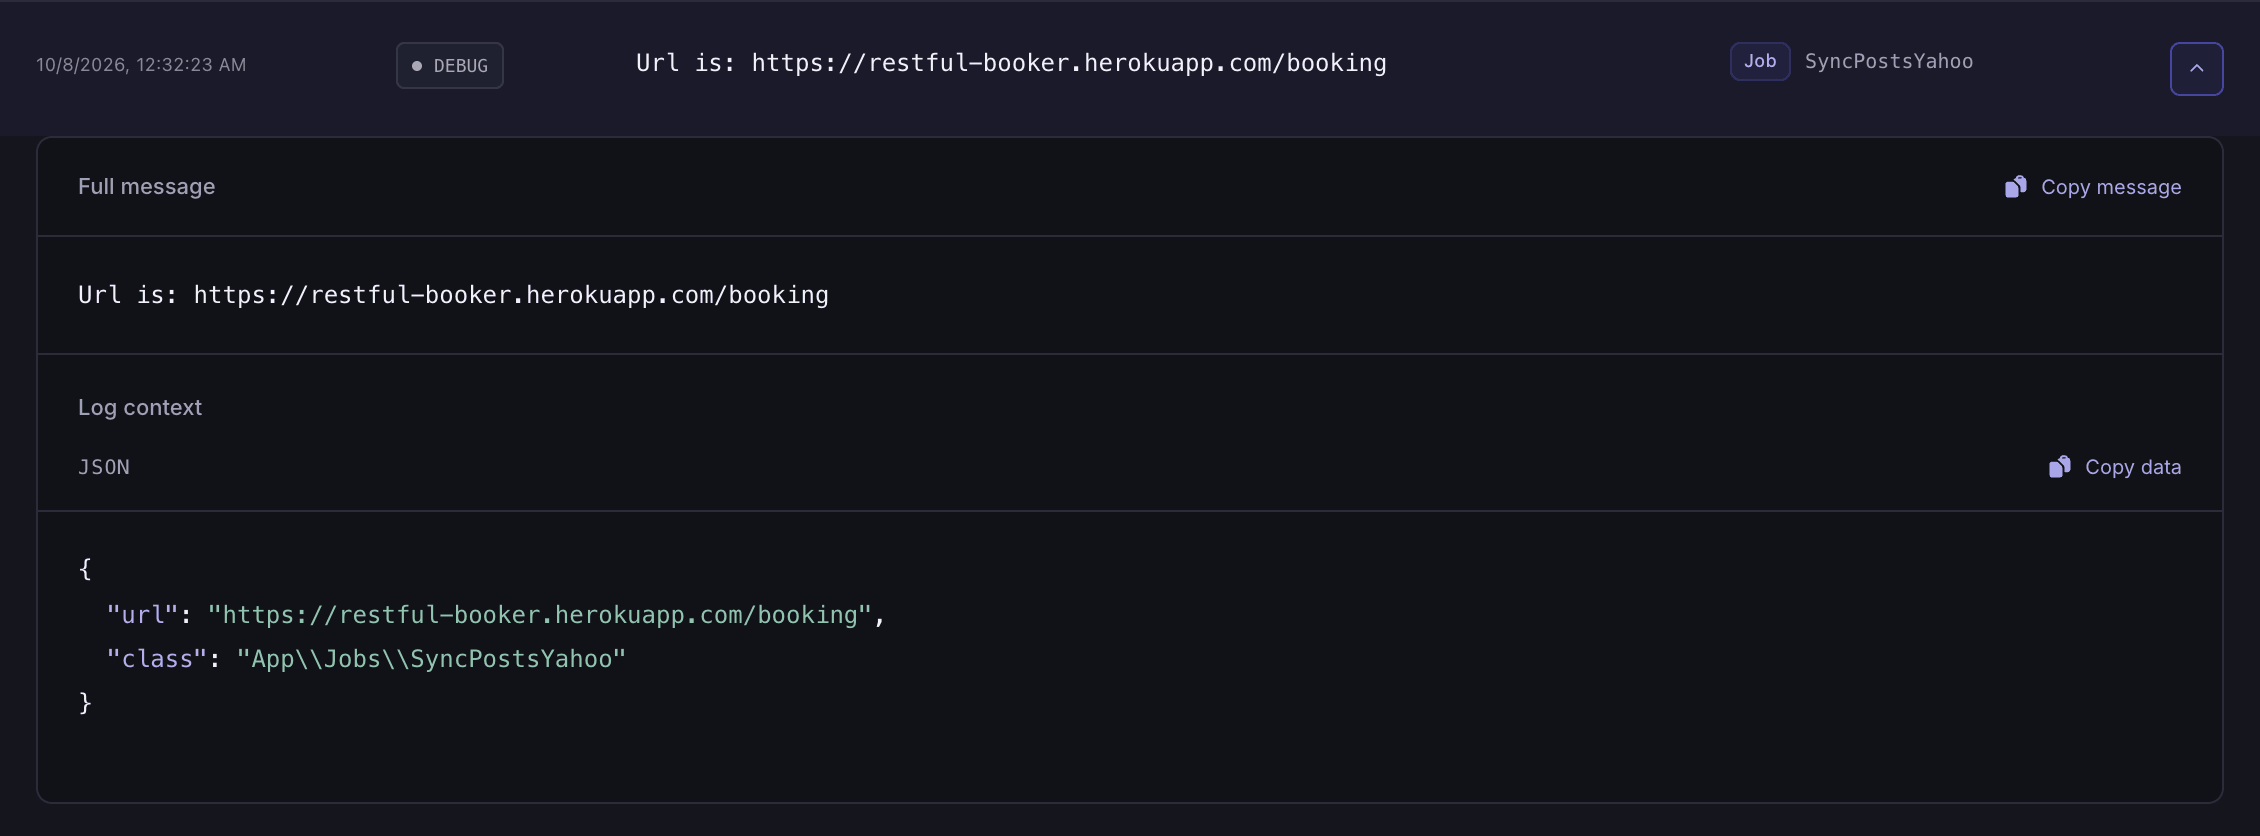
Read the complete message instead of guessing from a shortened table row.
Inspect structured context such as an order reference, API URL, or workflow step, when your code includes it.
Follow the origin link to inspect the recorded request, job, command, or scheduled task.
Example: investigating a warning during checkout
A log entry gives you the message your code wrote. An exception adds failure details such as a stack trace. Use the recorded API calls and queries to investigate what happened around either one.
Custom audit and activity logs
Already storing audit records in a database or activity logs in another system? Send them to Laritor alongside your application logs.
Write a routine that reads your records and adds each one with a type, level, message, context, and original timestamp. Send them in a batch. You can run the routine from a scheduled task.
The client gives you the API; you choose which records to collect and when to send them.
Learn how to send custom logsExample: sending one custom audit record
use BinaryBuilds\LaritorClient\Laritor;

$laritor = new Laritor();

$laritor->addCustomLog(
    'db-audit',
    'INFO',
    'Order status changed',
    ['order_id' => 123, 'status' => 'paid'],
    now()
);

$laritor->sendEvents();Send important changes from your audit tables with a clear message and the data needed to understand the change.
Bring records from your own activity tables or an activity logging package into the same place.
Collect webhook or vendor callback logs stored elsewhere and keep their original timestamps and relevant context.
From a log entry to a useful fix
A warning or error message is a starting point. Use the recorded context to work out whether it points to a code bug, a configuration problem, or an external service failure.
Look at what happened before and after the entry, then verify the affected workflow after making a change.
Search for the message or context value you know, choose a level, and set the time window around the problem.
Read the full message and context. Open the originating execution and compare the log with related queries, API calls, and exceptions.
Use that evidence to change your code or configuration. Test the affected workflow, then inspect new activity to see whether the problem returns.
Use Laritor how you want
Choose how much application activity to send. Keep the logs around exceptions, keep activity with detected issues, or record successful executions too.
The log history you see reflects the occurrences and events retained by your settings. Custom logs sent through the dedicated API use a separate sending workflow.
Keep logs and related events when a request, job, command, or task contains an exception. Read the messages that led up to the failure.
An error-level log is not necessarily an exception.
Record occurrences with detected issues, such as a failed job or slow request. Inspect their logs alongside the other activity.
Useful when investigating application problems.
Record successful activity too. Search routine messages, warnings, and errors across the executions your app sends.
Use this for broader application log visibility.
Paid plans start at $20/month with 20M events included. Usage includes recorded logs and the other events you send. Filtering unnecessary entries can reduce event usage. Estimate your usage
Control the data you send
Messages and context can contain personal data or secrets. Laritor applies redaction before recorded data leaves your app, and lets you customize what is recorded and how sensitive values are handled.
Review your logging calls and outgoing data. Keep the information you need to debug while removing private details your team does not need.
Explore privacy controlsUse recordLog($level, $message, $context) to skip entries you do not need, such as noisy routine messages.
Use recordLogContext to control whether attached Laravel context is included. Include useful details deliberately in your logging calls.
Customize redactString and redactArrayValue to mask or remove sensitive text and context fields before sending.
Laravel log monitoring questions
Answers about application logs, structured context, custom records, and recording settings.
Laravel log monitoring helps you find and understand the messages your application writes while it runs. Laritor collects recorded Laravel logs in a searchable view with severity levels, timestamps, full messages, structured context, and links to the requests, jobs, commands, or scheduled tasks that produced them.
Laritor’s Laravel client automatically captures application logs written through Laravel’s logger and Monolog channels. You can keep using your existing logging calls. The entries sent to Laritor depend on your recording mode, log filters, and context settings.
Yes. The Logs view includes message and context search. Use it to find a keyword or value your application recorded, then combine it with severity filters and a date range to narrow the results.
Laritor supports DEBUG, INFO, NOTICE, WARNING, ERROR, CRITICAL, ALERT, and EMERGENCY. Use the Errors or Warnings view for a starting point, or select the levels you want to inspect. Severity describes the log entry; it does not by itself prove an exception occurred.
Yes. When a log belongs to a recorded execution, its origin links to the request, queued job, Artisan command, or scheduled task. Open that execution to inspect related queries, outbound requests, cache operations, exceptions, and other recorded events.
Yes. Expand a log row to view the full message and recorded JSON context. You can copy the message and context data. The context available depends on what your code included and what your recording and redaction settings allow.
Yes. Use the Laravel client’s addCustomLog method to provide a type, level, message, structured context, and original timestamp, then send the batch with sendEvents. This lets you send database audit records, activity logs, and integration logs that do not go through Laravel’s logger. You write the routine that reads and sends those records.
No. Exceptions-only and issue tracker modes keep logs from retained occurrences so you can investigate those problems. Full observability also records successful activity for broader log visibility. An error-level log alone is not necessarily an exception, so exceptions-only mode does not mean every error log is sent. Custom logs sent through the dedicated API are a separate workflow.
Yes. Use recordLog to choose which entries are recorded and recordLogContext to control attached Laravel context. Laritor applies redaction before data leaves your app, and you can customize string and array-value redactors for your messages and context. Review the data your code logs and avoid putting passwords, tokens, or unnecessary personal information in it.
Yes. Through Laritor MCP, a connected coding agent can retrieve an exception and its recorded execution timeline, including related logs when available. It can use those messages and events with your repository to investigate the failure and work on a fix.
Install in under 1 minute
Add Laritor’s Laravel client, choose a recording mode, and start inspecting the messages and events your app sends.
Free trial: 300K events · Unlimited apps and users