
See the surrounding code
Read the lines around the failure. Check whether the code expected a value, an array key, or a successful response that was missing.
Laravel exception tracker
Laritor tracks exceptions and monitors performance in your Laravel app. Get an alert when an exception occurs, see the failing code, and follow the request or job’s events to understand why it happened.
Record only occurrences with exceptions, or monitor other issues and all application activity. Debug with in-app AI or connect your coding agent through Laritor MCP.
Free trial: 300K events · Unlimited apps and users
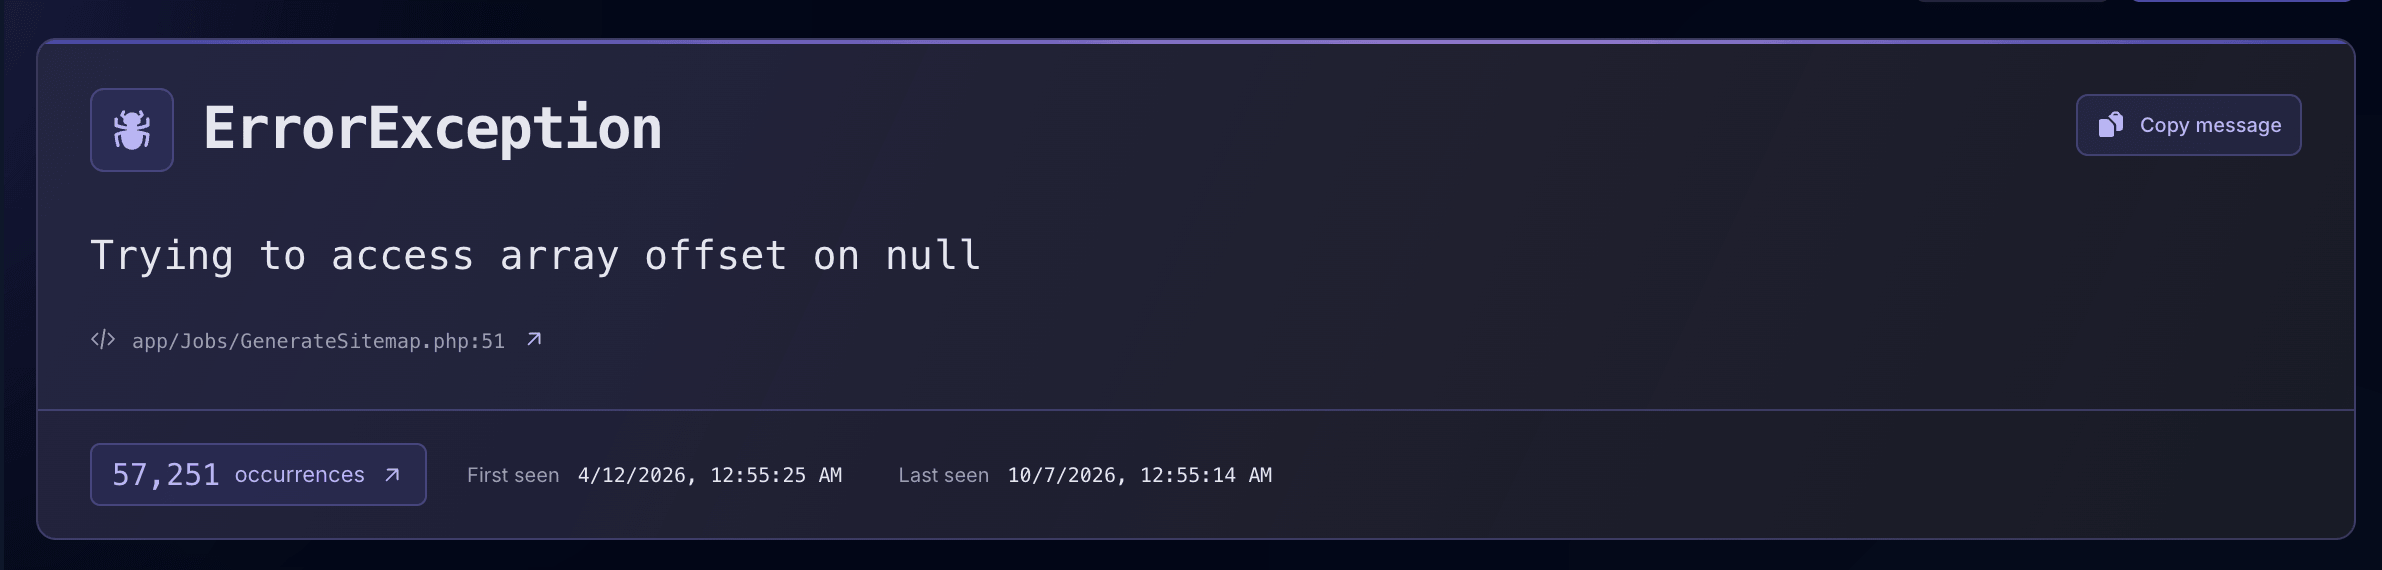
Know when something failsAlerts in the tools your team uses.
Understand the causeStack traces and the events behind them.
Work on a fix fasterIn-app AI and context for your coding agent.
Laravel error monitoring
A Laravel exception tracker gives you a place to investigate errors reported by your app. Laritor shows the exception message, full stack trace, exact file and line, and previous occurrences. It also connects the error to the request, job, command, or scheduled task where it happened.
Laravel’s error logs are a useful starting point. With Laritor, you can follow the recorded queries, logs, and outbound requests around an exception, get notified through your team’s tools, and use that context to work on a fix.
Read the exception tracking guideFrom alert to investigation
Start with the alert. Follow the code and recorded events. Give your AI agent the details it needs to help.
Learn when an exception occurs in your Laravel app. Open the alert to see what failed.
Explore this stepSee the exact file and line, surrounding code, and full stack trace.
Explore this stepInspect the recorded queries, logs, and API calls that led to the exception.
Explore this stepUse in-app recommendations, or give your coding agent the context through Laritor MCP.
Explore this stepException alerts
Know when your app throws an exception without keeping a dashboard open. Send alerts to a team channel, an inbox, or your issue tracker, then open the exception in Laritor to investigate.
Choose the applications, environments, and channels that matter. Configure production alerts separately from development activity.
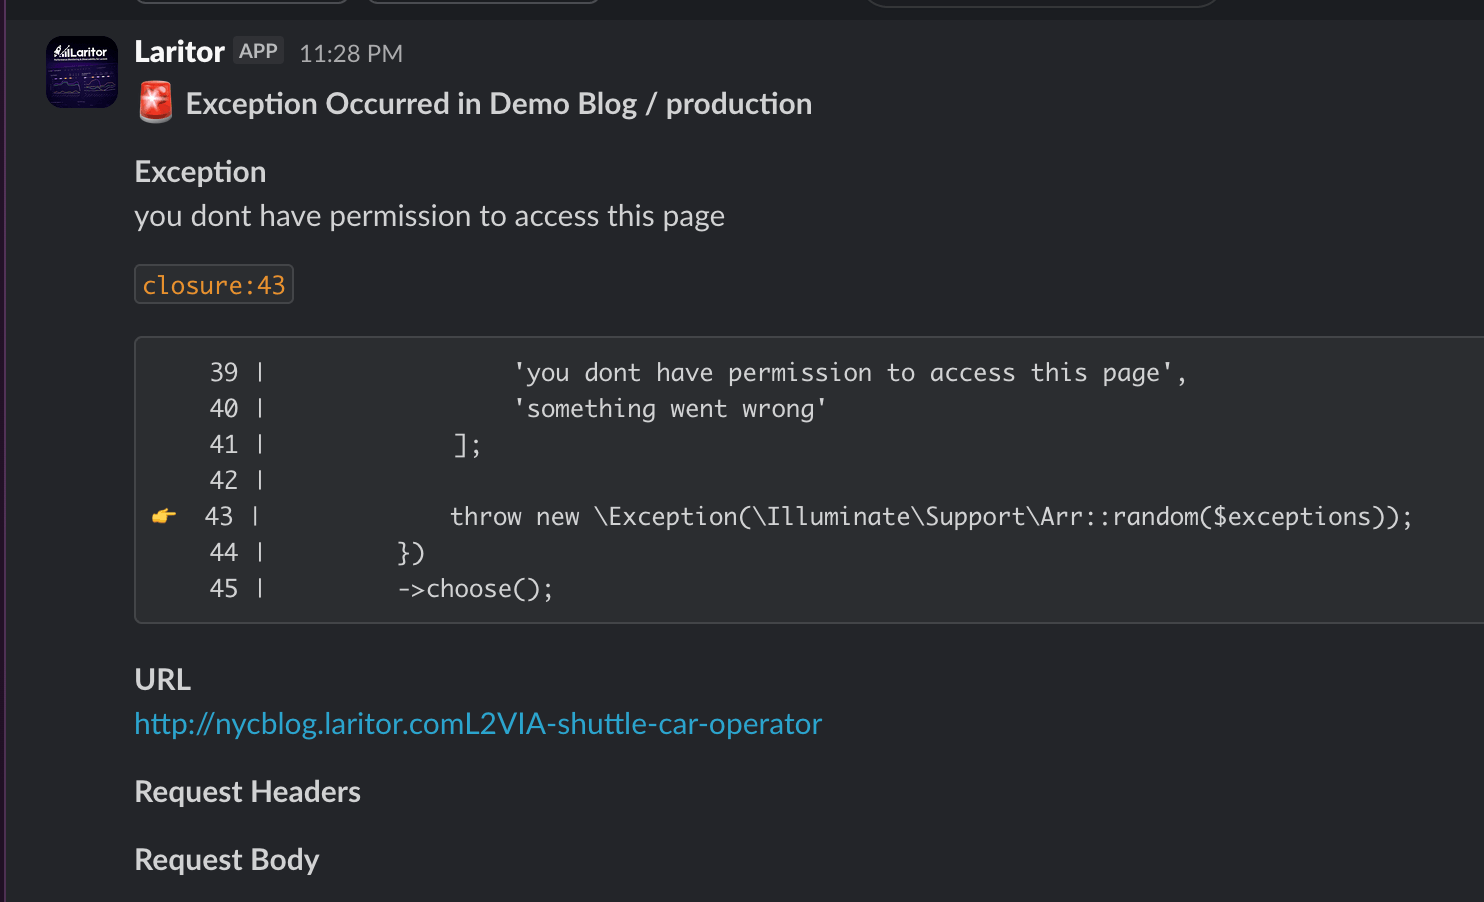
Set up exception alertsSend an exception alert to Slack with its class, message, application, environment, and failing file. Follow the link to investigate the full occurrence in Laritor.
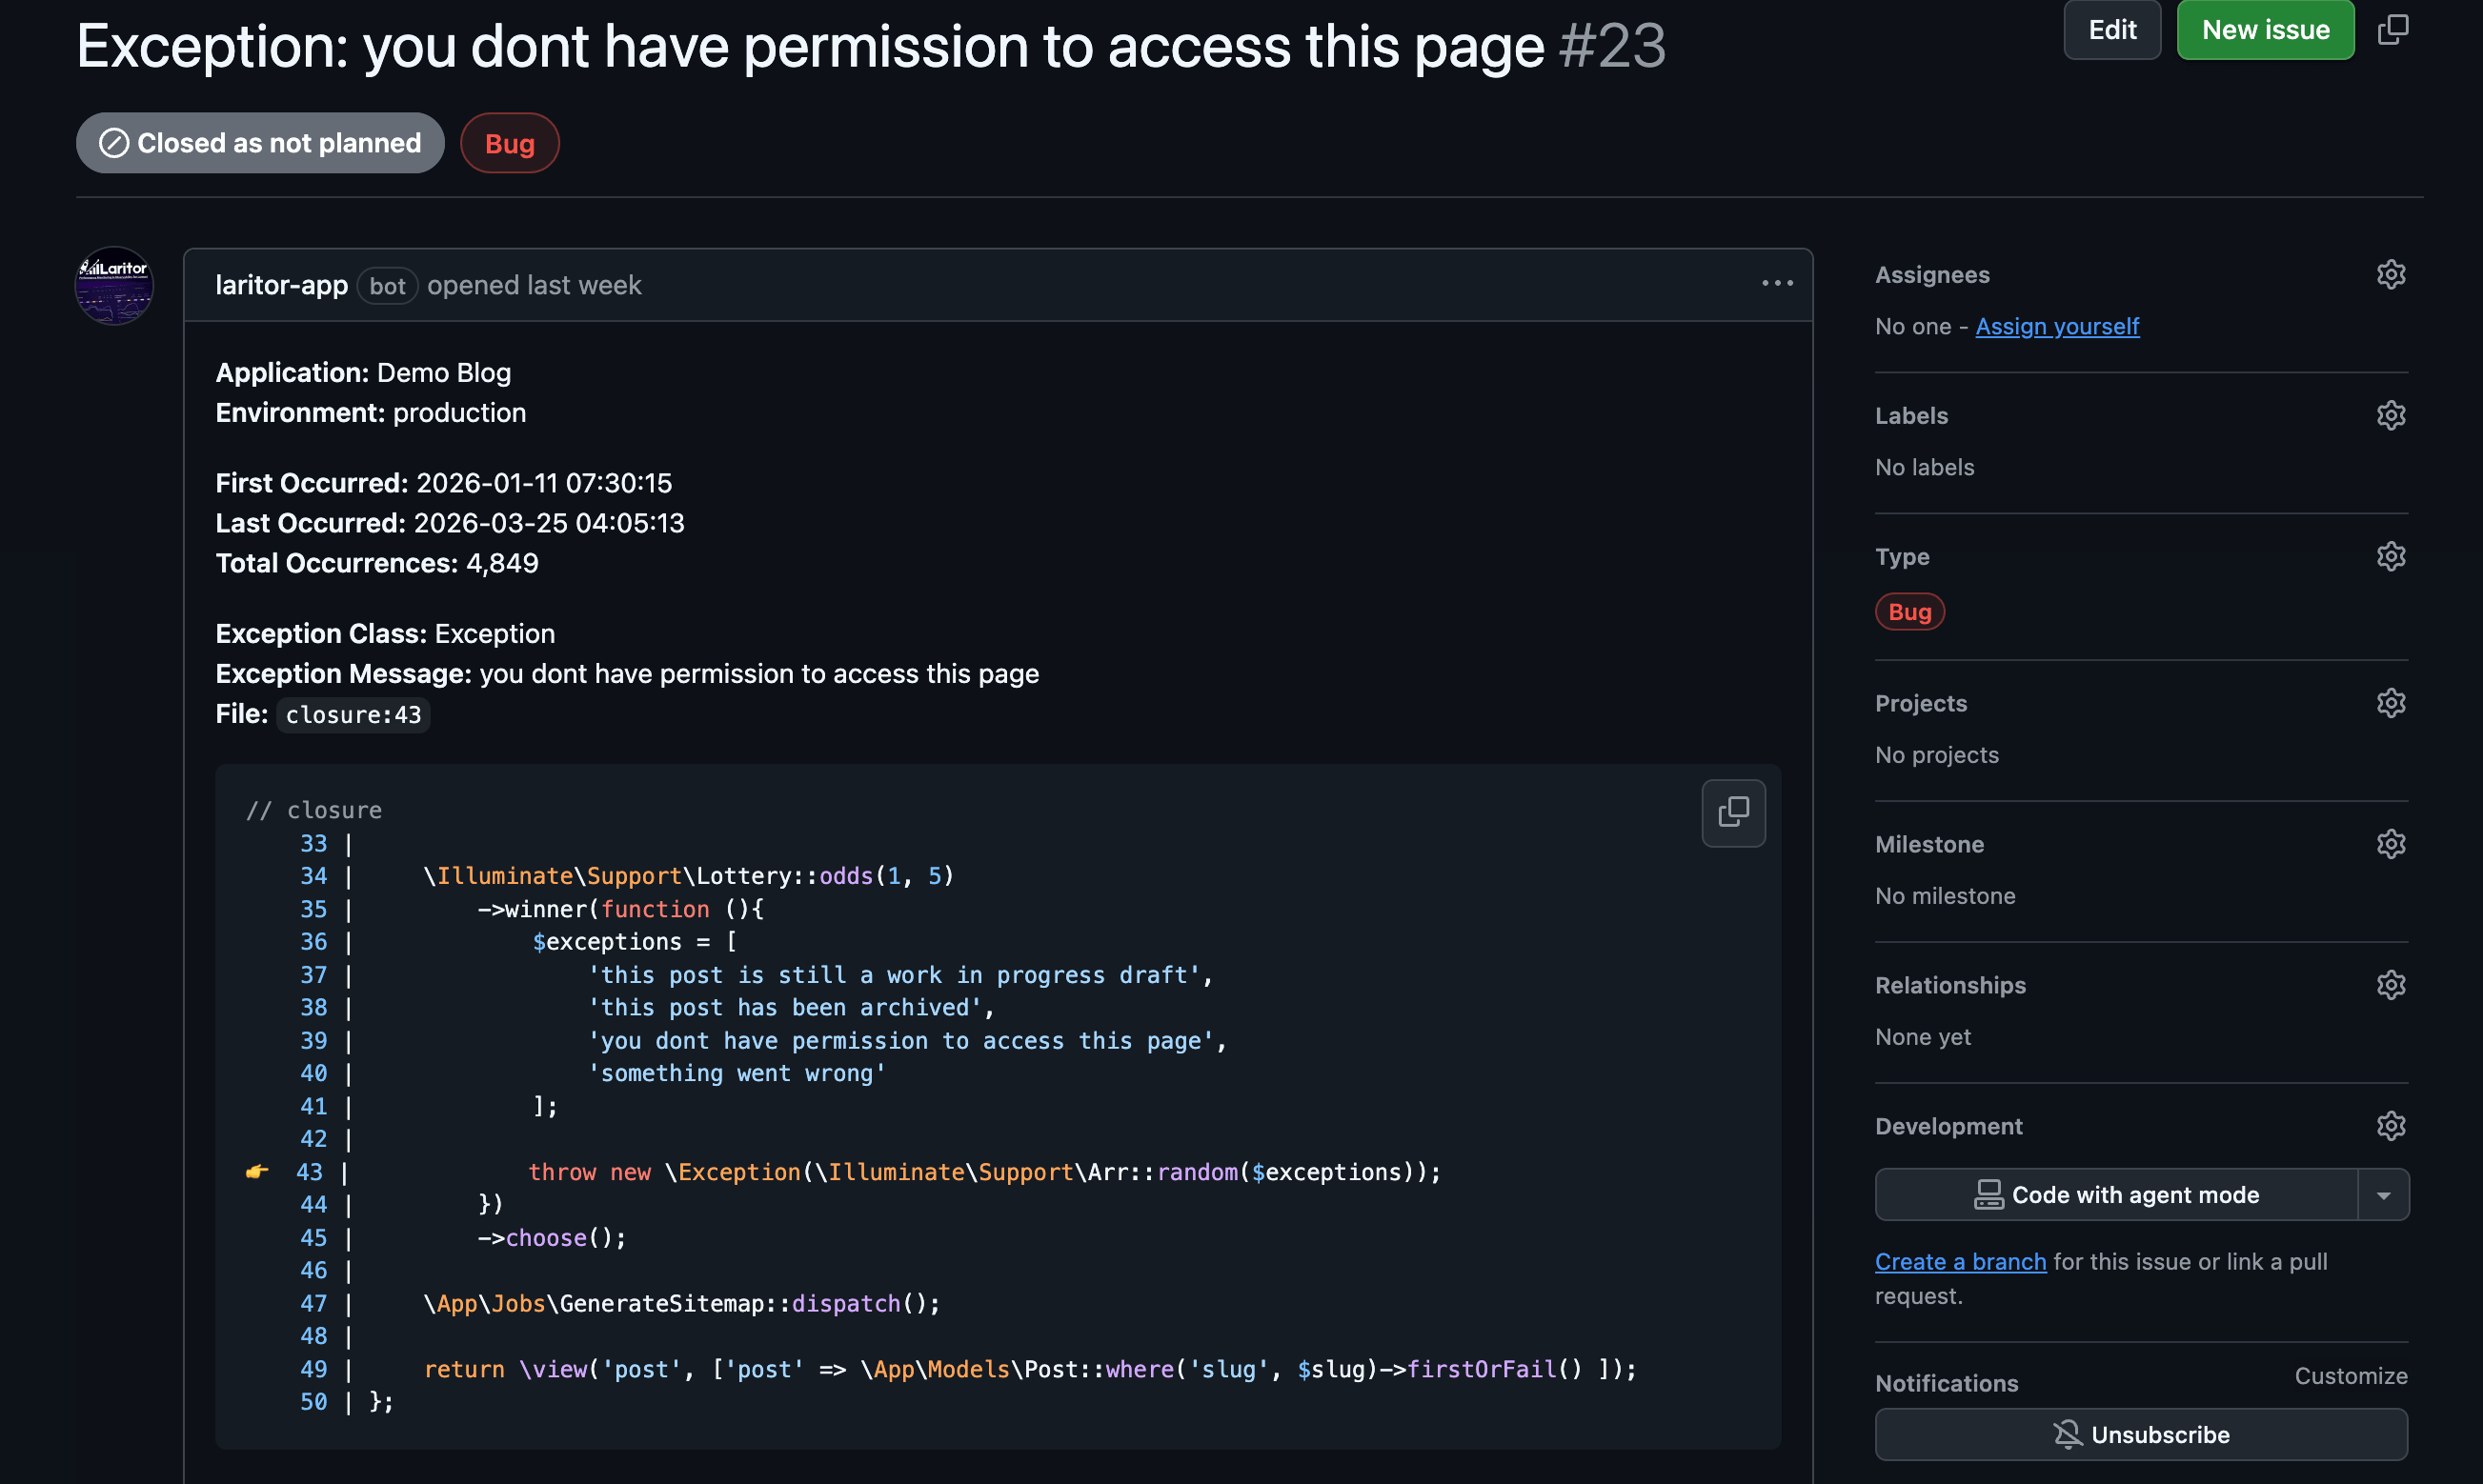
Send exception alerts to GitHub so your team can work from an issue containing the error message, location, occurrence details, and a link back to Laritor.
Create a Linear issue from an exception alert. Keep the application, environment, error details, and Laritor link with the work your team needs to investigate.
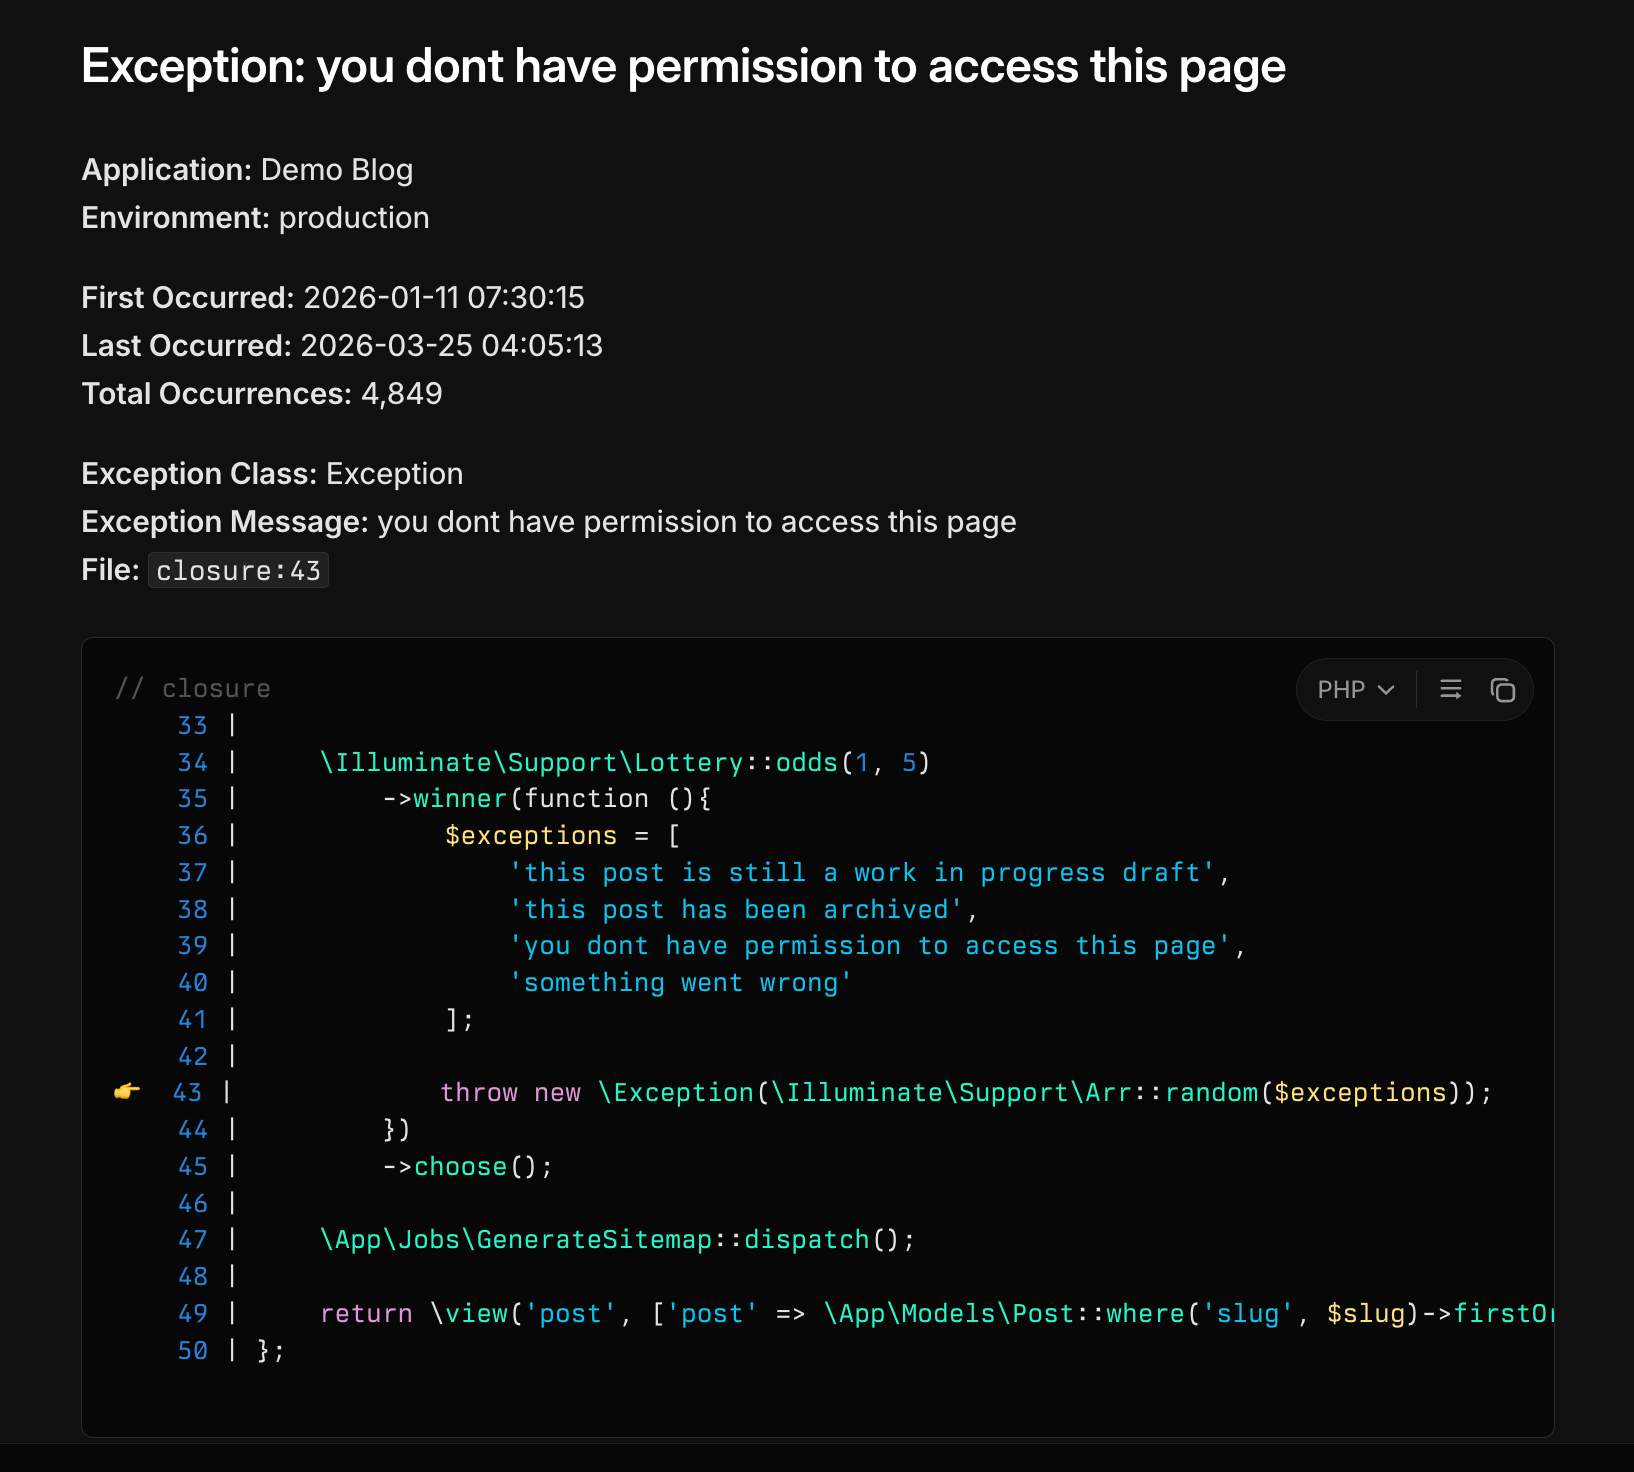
Stack traces and code previews
Read the exception class and message, then inspect the exact file and line where it occurred. Laritor shows the surrounding code and full stack trace so you can follow the calls that reached the failing operation.
Explore exception details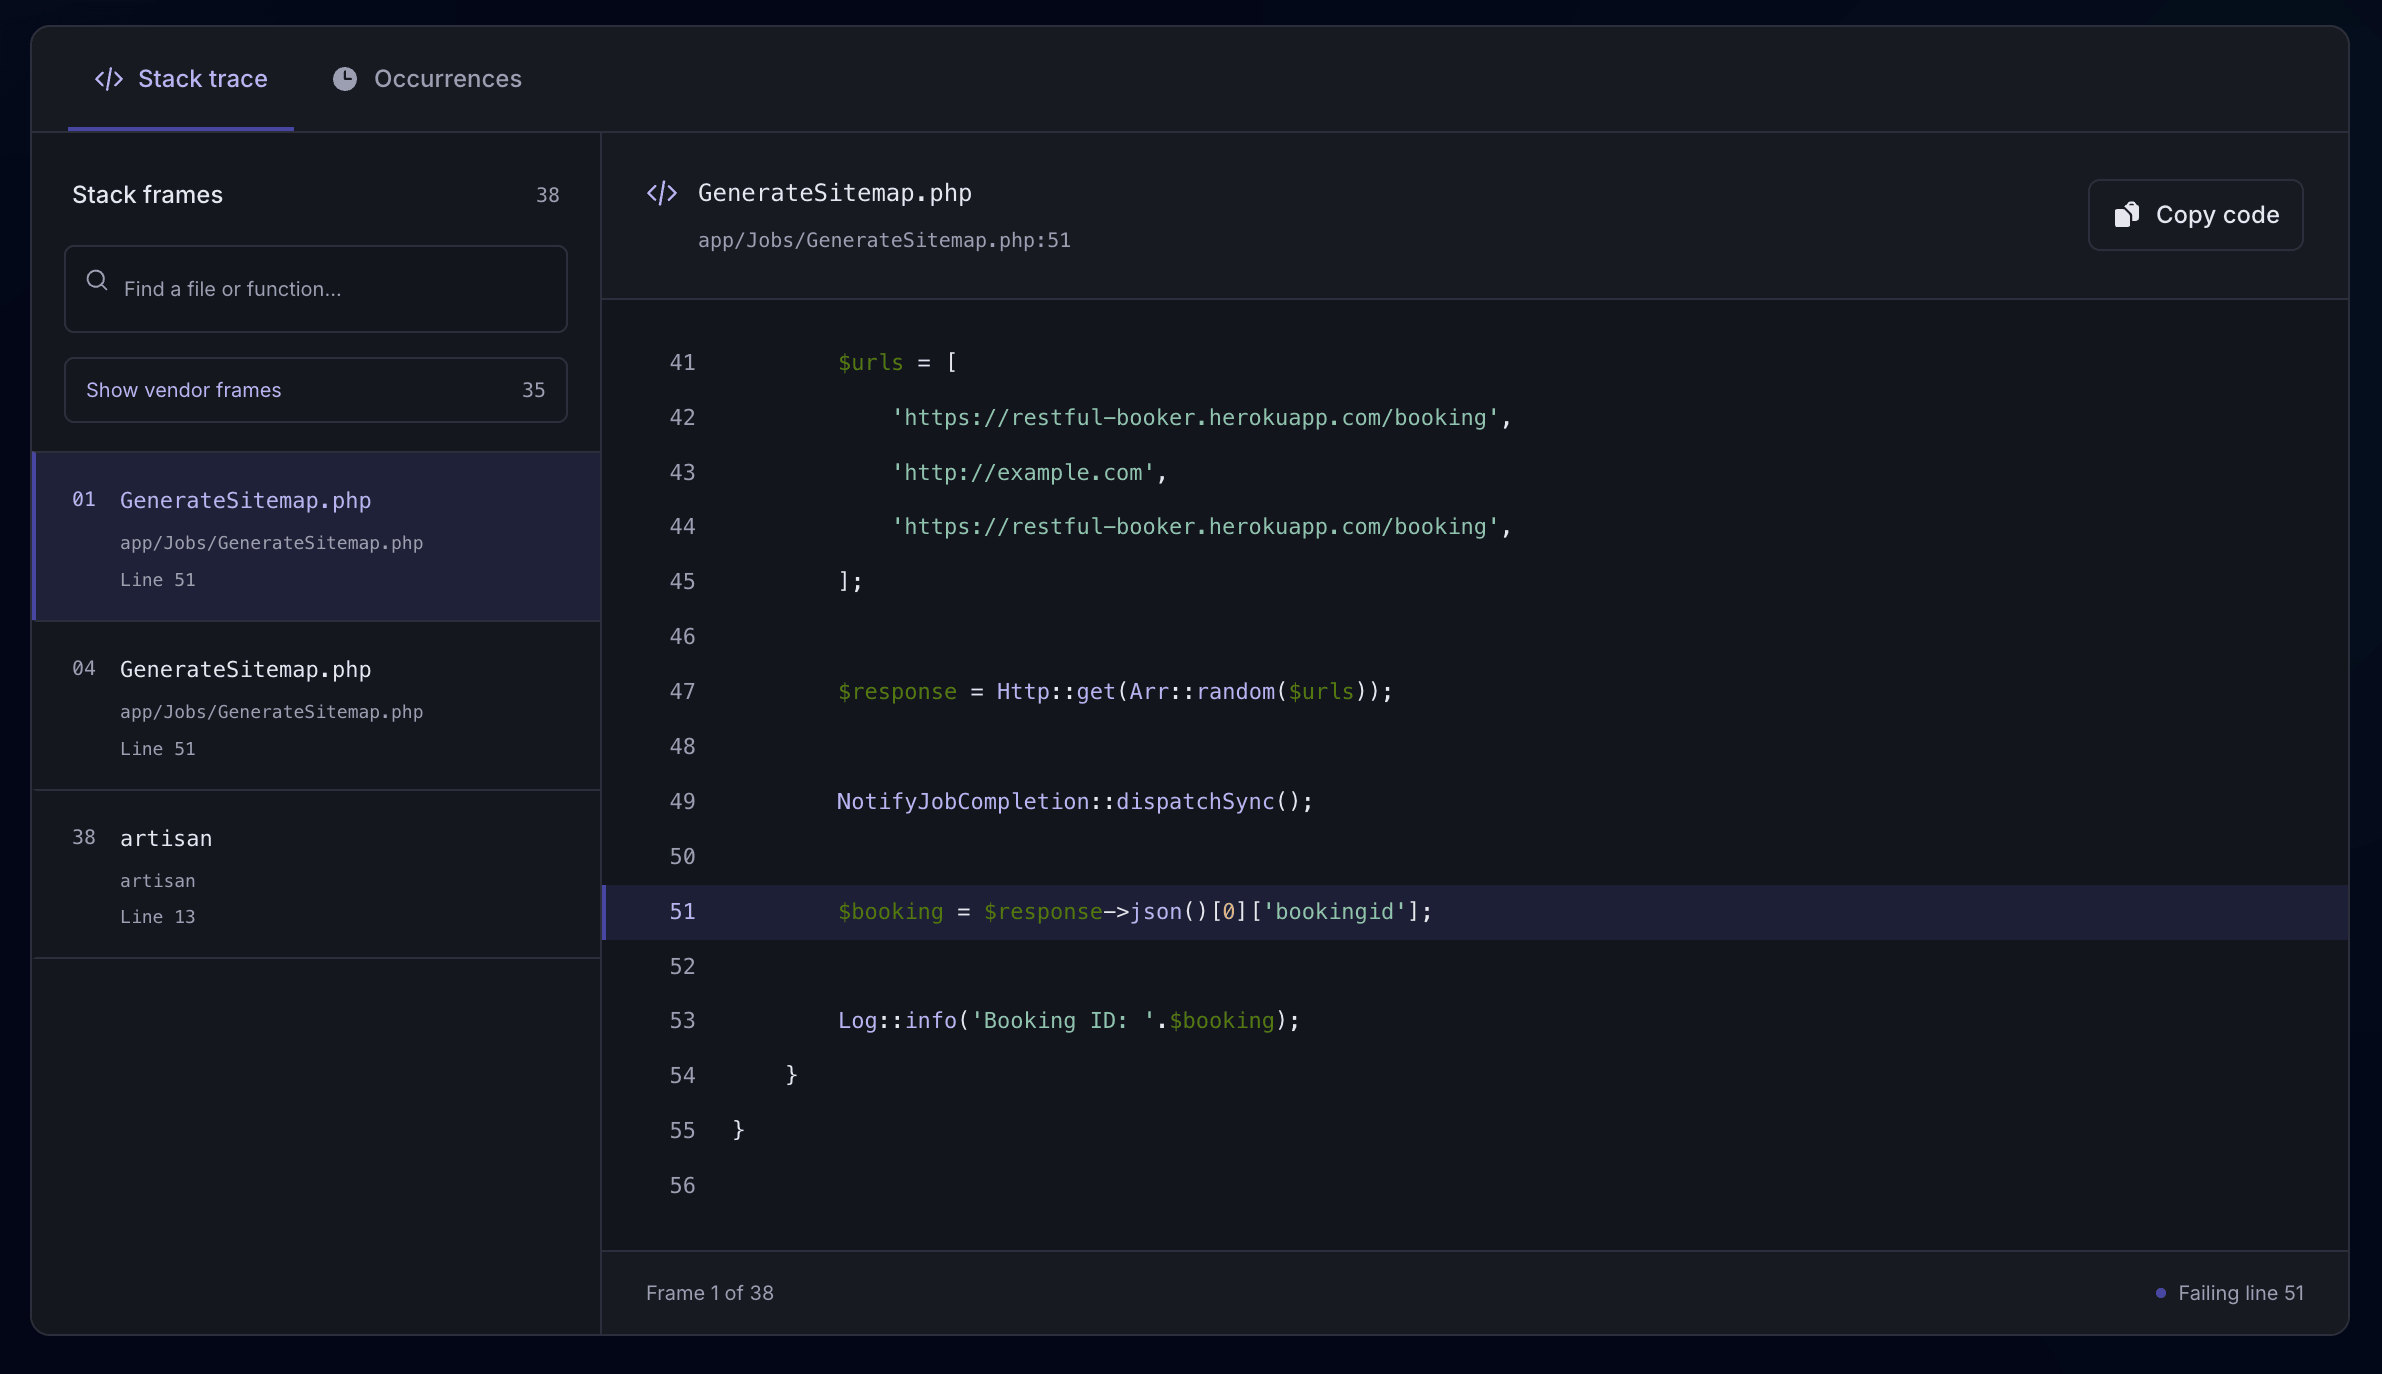
Read the lines around the failure. Check whether the code expected a value, an array key, or a successful response that was missing.
Search stack frames and inspect application or vendor code. Understand how execution reached the exception, rather than stopping at its message.
Open an occurrence to inspect the specific request or job. The same exception can happen under different conditions, so investigate the run that matters.
The events behind an exception
A stack trace shows where code failed. The recorded event timeline helps explain what happened beforehand. Inspect queries, logs, API calls, and other related events in order, with their timings and available details.
For example, an unexpected API response can leave a value empty. Follow the outbound request and the code that used its response to understand the error at the failing line.
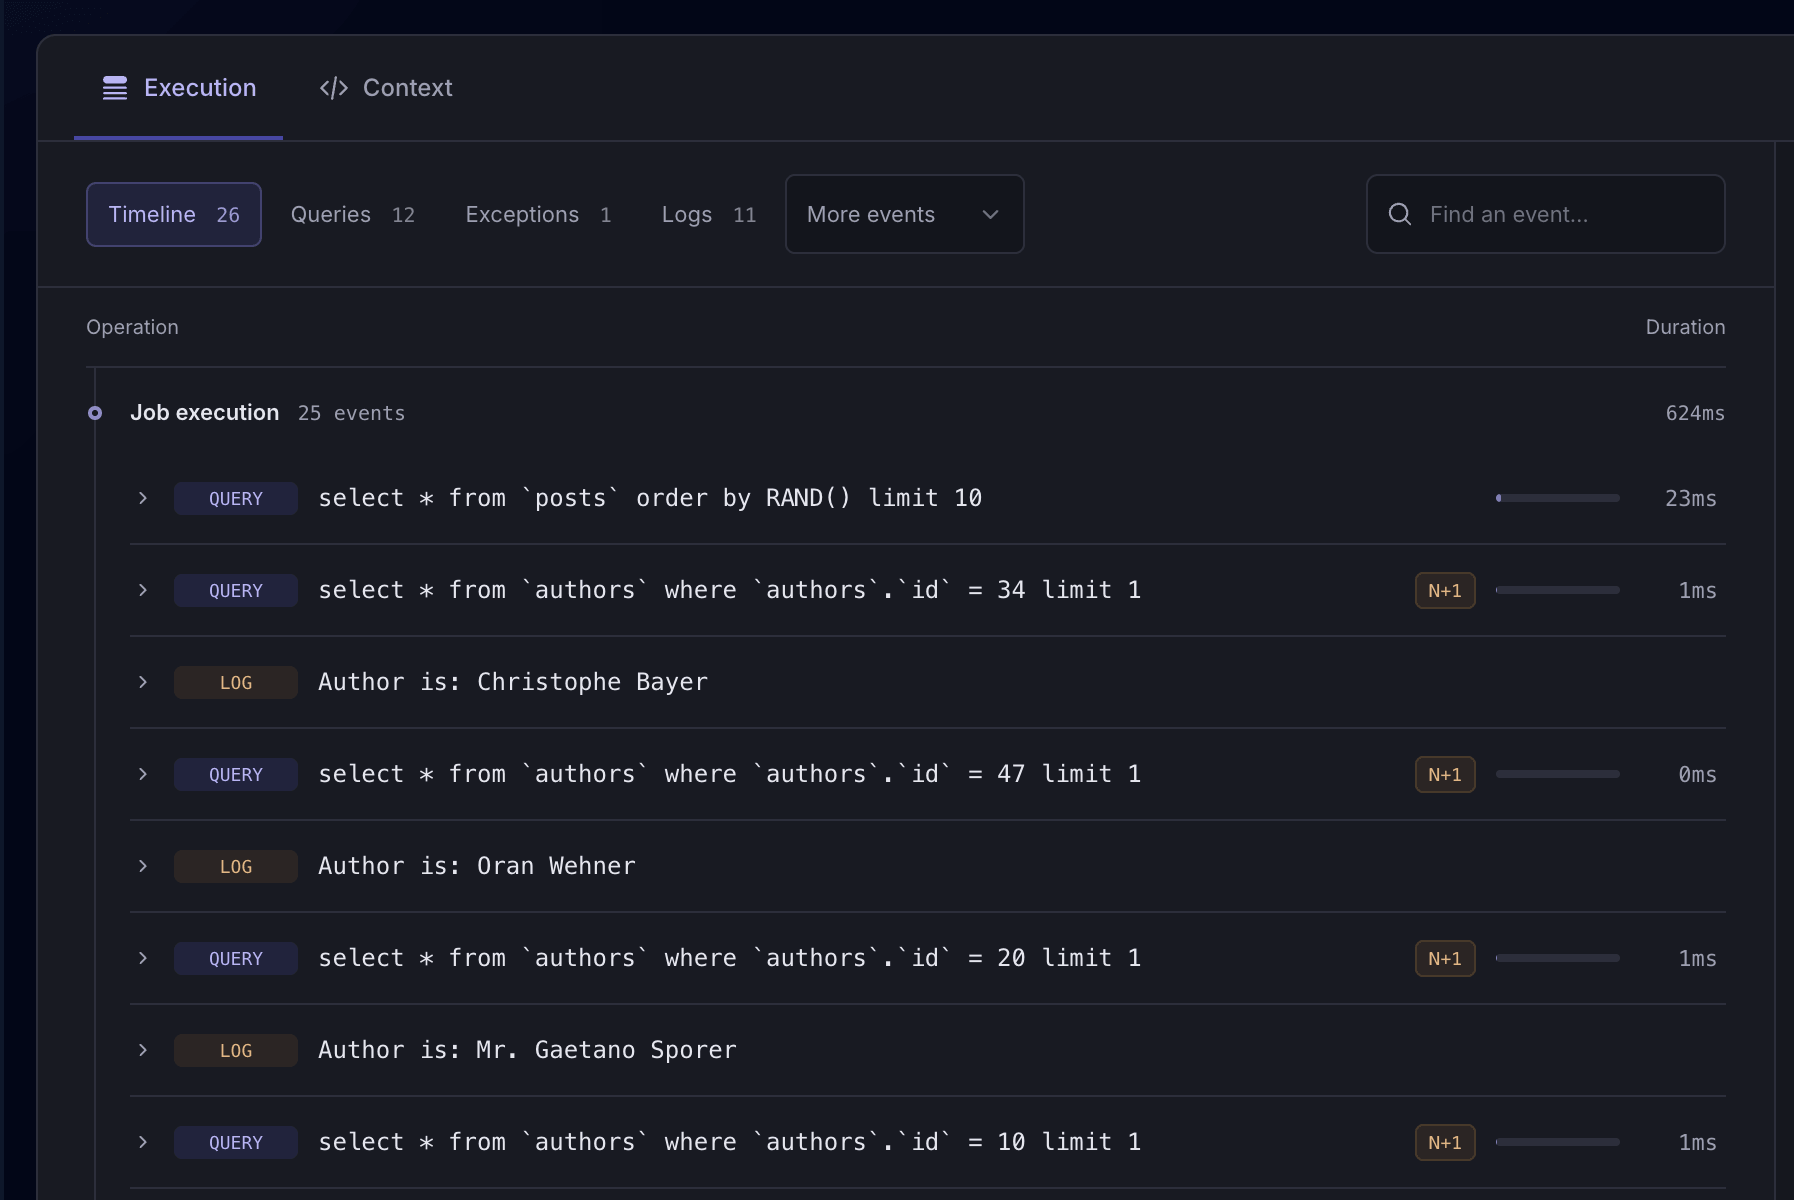
Inspect the queries around a failure. Find the operation behind a database exception or an unexpected result used later in your code.
Review recorded outbound requests when your app depends on a payment provider or another service. Use the available response details to investigate failures.
Record custom events for steps such as validating an order or importing a batch. Add the application details that make a failure easier to understand.
Record custom eventsContext follows your recording and privacy settings. Exceptions-only mode keeps related events for occurrences with exceptions; it does not send all successful activity.
Web requests and background work
Failures happen beyond the browser. Use the same exception tracker to investigate reported errors from web requests, queue workers, console commands, and recurring tasks.
Investigate errors behind a broken page, checkout, or API response. Open the recorded request and follow its events.
Explore request monitoringFind the exception behind an unsuccessful import, email, or report. Inspect the job execution and its related events.
Explore job monitoringTrace exceptions in console commands, maintenance scripts, and other work that runs outside a web request.
Explore command monitoringInvestigate exceptions in recurring background work. Open the recorded task run to see what happened.
Explore scheduled task monitoringOccurrence history and error trends
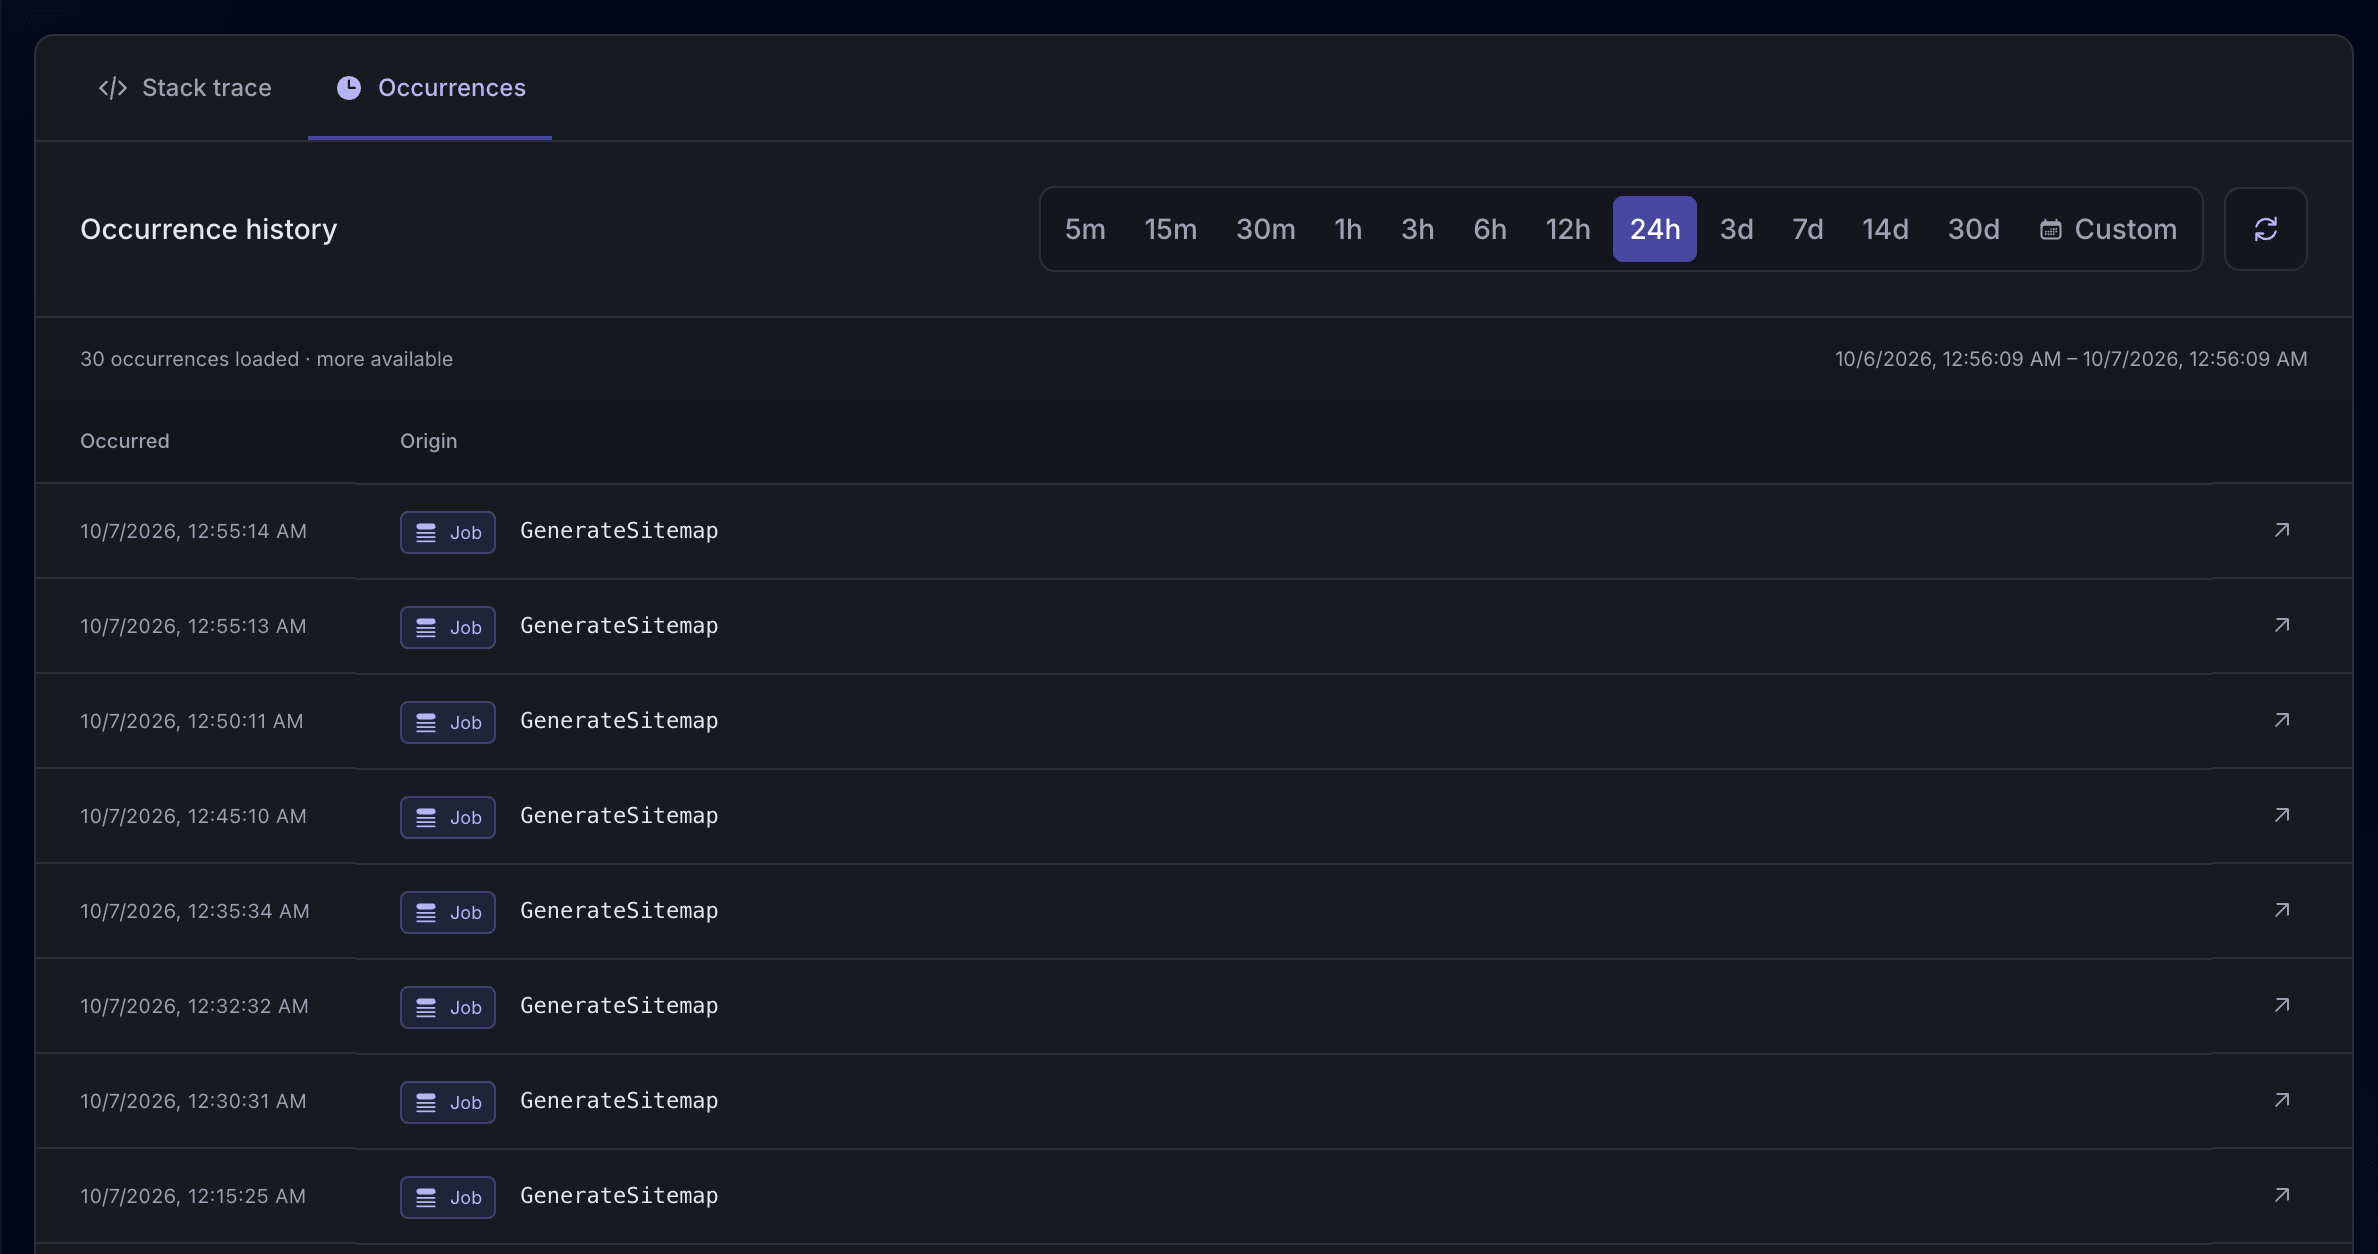
See how often an exception occurs and when it was first and last seen. Filter by date, exception class, or message to find relevant errors and decide what to investigate first.
After deploying a change, check for new occurrences when the affected code runs again. Open any remaining failures to see whether the cause has changed.
See the exception’s first and last occurrence and how often it has happened. Open an individual occurrence to investigate the request, command, scheduled task, or job behind it.
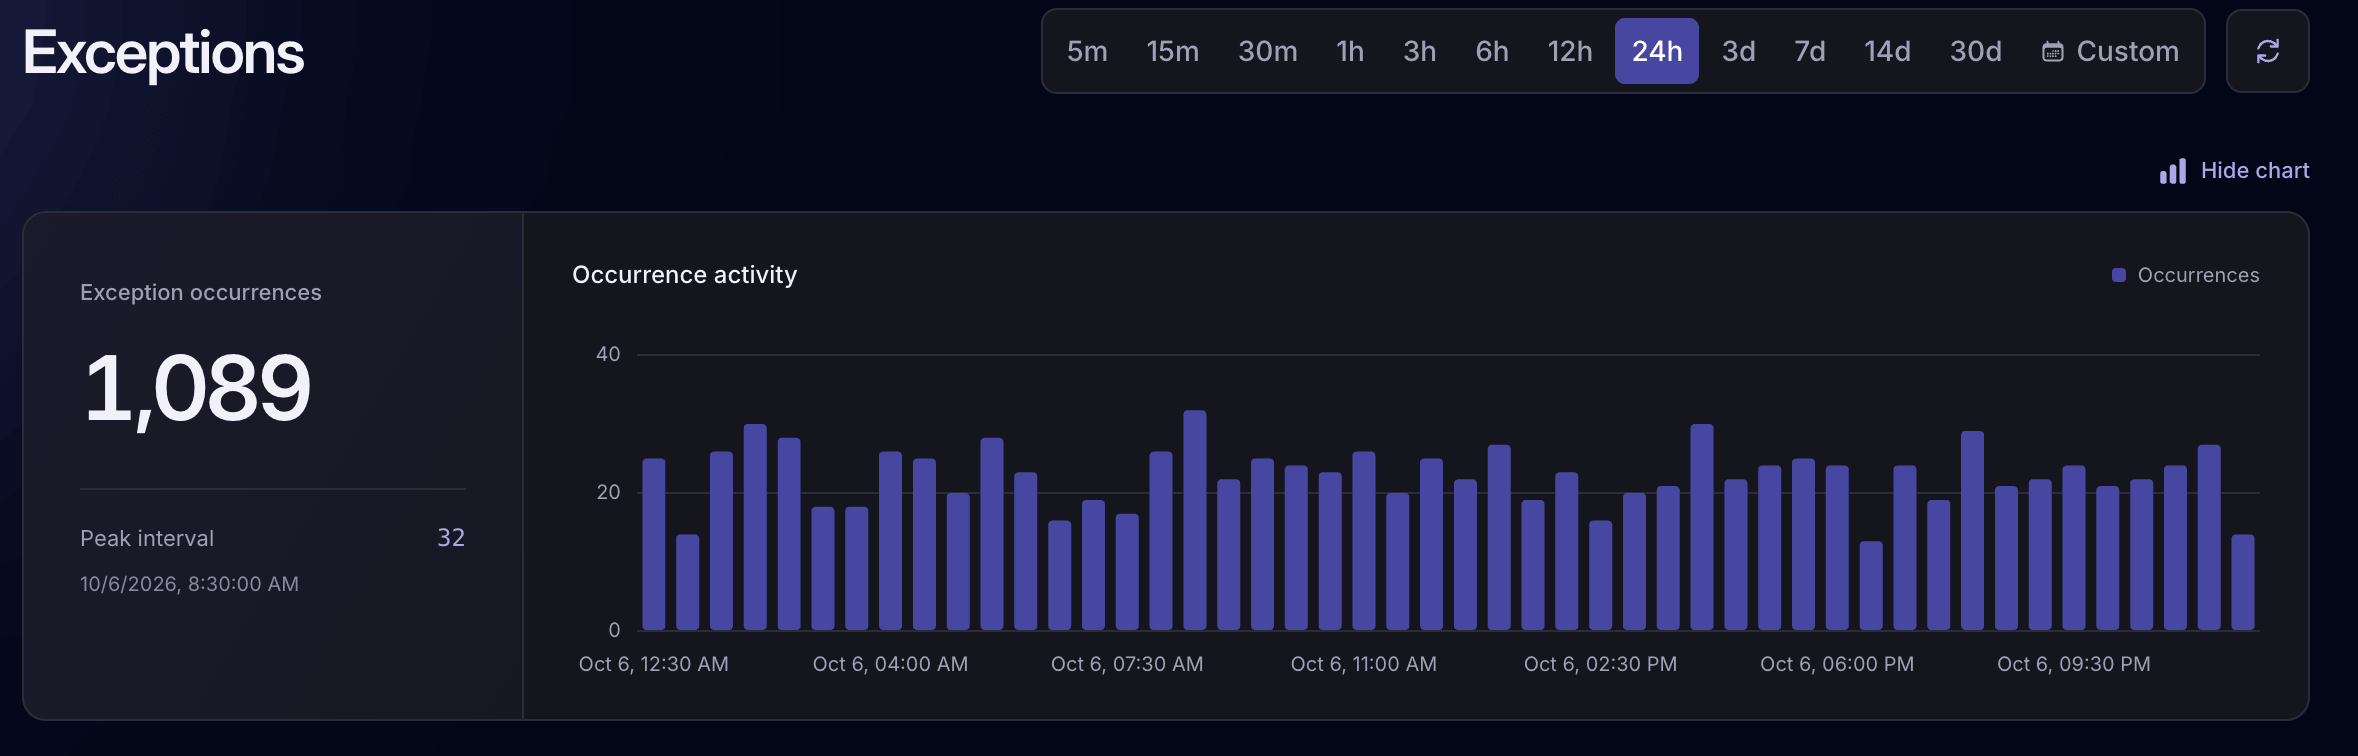
Monitor exception activity across your app over time. Look for a sudden increase, then use the exception list and occurrence details to investigate the errors behind it.
AI-assisted Laravel debugging
Give AI the details of the actual failure: the exception, stack trace, and recorded events. Get recommendations in Laritor, or let your coding agent investigate those details alongside your application code.
Connect your agent to Laritor MCPLaritor’s in-app AI analyzes the exception and its recorded context to explain what may have caused it. Review the recommendations and example code alongside the stack trace before making a change.
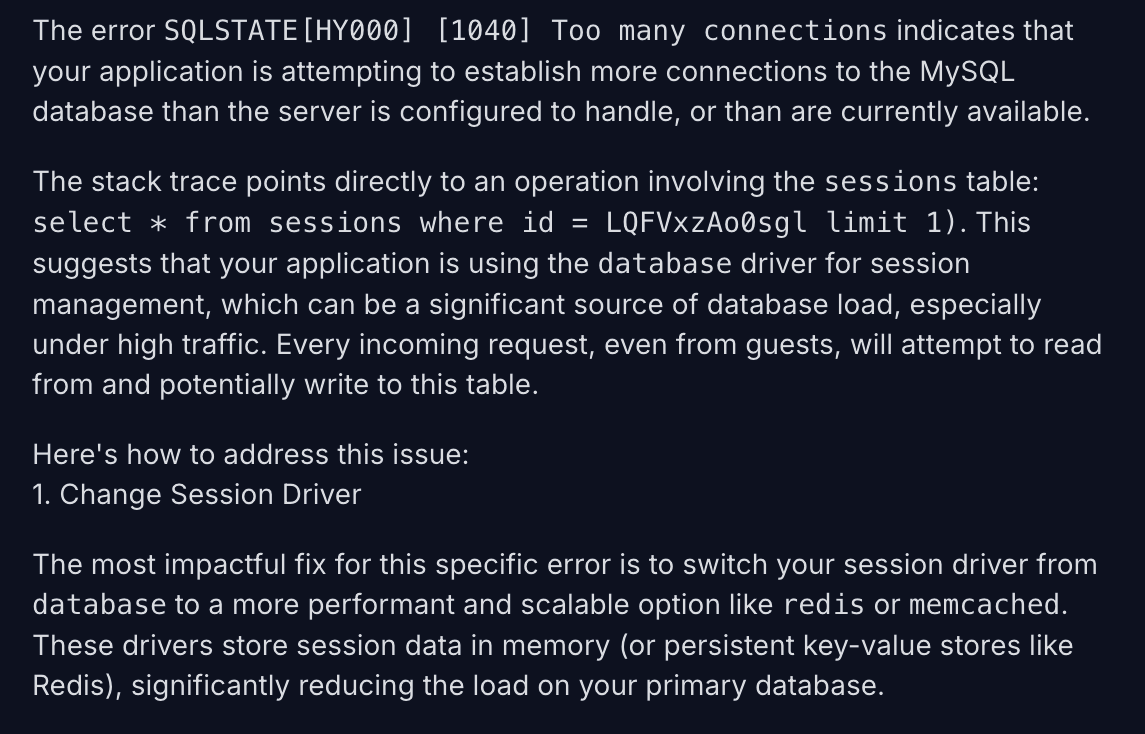
Connect your coding agent through Laritor’s MCP server. It can retrieve the exception, stack trace, and recorded event timeline, then use that context with your repository to investigate the cause and implement a fix.
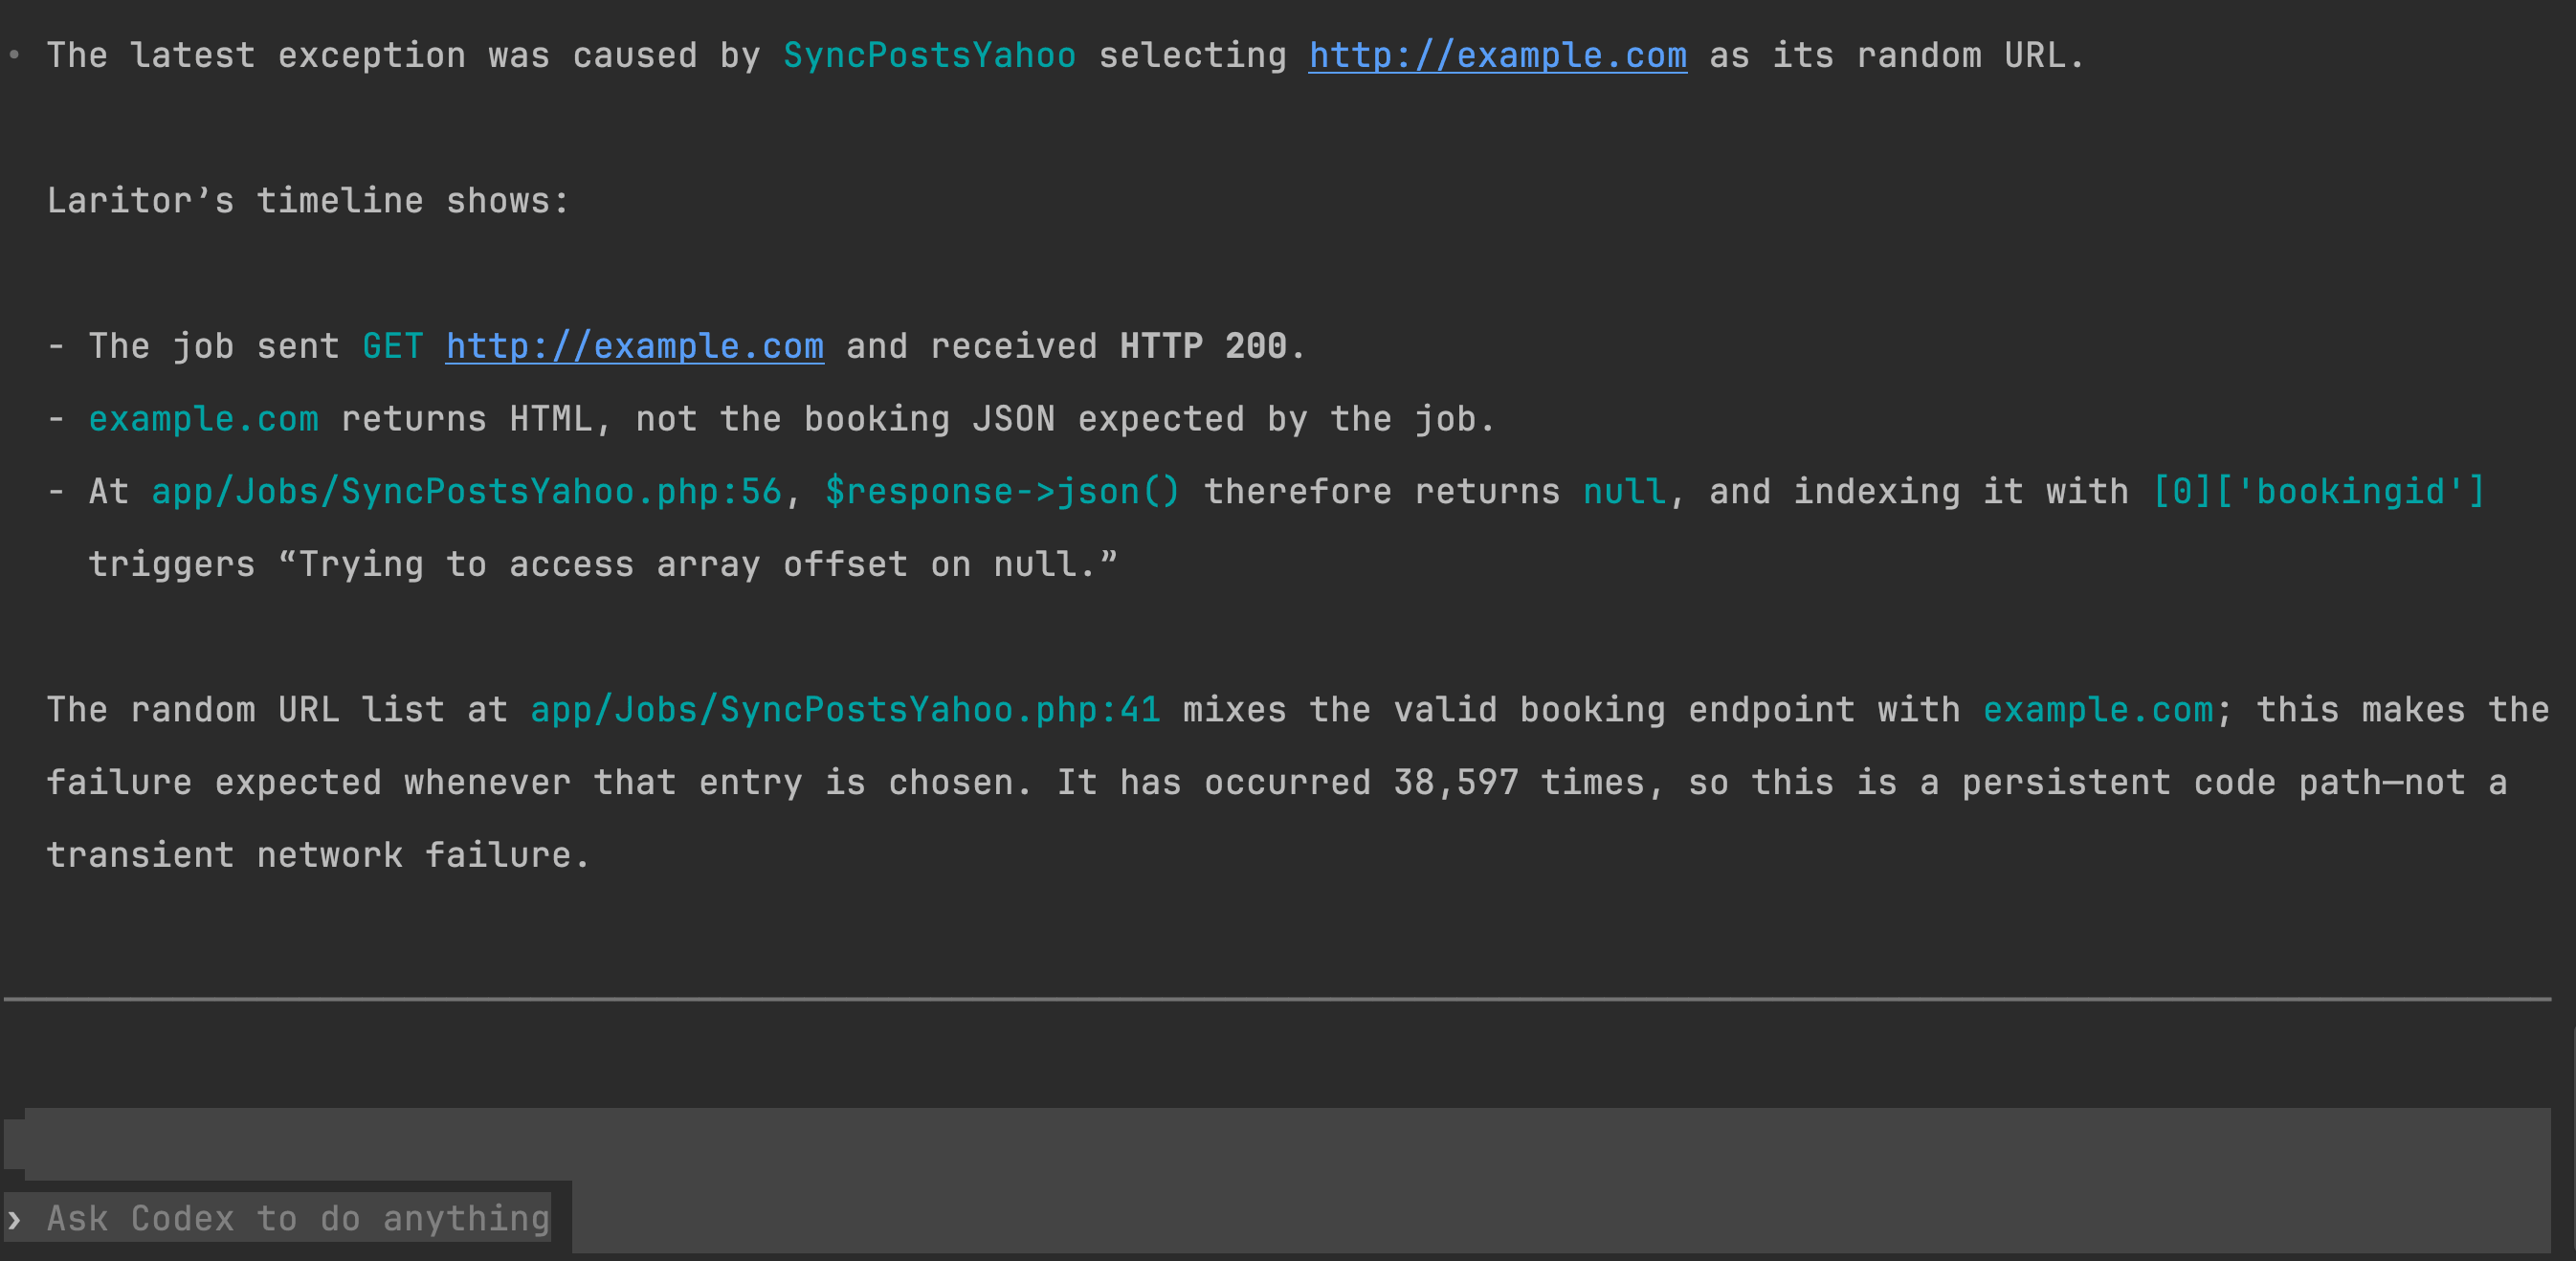
Use the agent you already work with. Connect tools such as Claude Code, Cursor, or Codex through MCP. Your agent retrieves the recorded context and works on the code through its own development workflow.
Choose your in-app AI provider. Each account includes 50 AI prompts per month. Connect your own provider when you need more usage. Review and test suggested changes before deployment. See AI provider settings →
Control what leaves your app
Keep useful debugging context while protecting sensitive and personally identifiable information. Laritor’s Laravel client lets you customize and redact data before sending it.
Configure privacy and redactionRedact passwords, access tokens, and other private values in strings and structured data. Define the fields and patterns your application should not send.
Customize recorded user identifiers, names, and email addresses. Keep the context you need to investigate without sending unnecessary personal information.
Control headers, session data, and request or response bodies through client settings. Request and response bodies are disabled by default.
Use Laritor how you want
You can use Laritor as a Laravel exception tracker without recording every successful request or job. Choose the activity you want to send. All three modes include the same Laritor features.
Record a request, job, command, or task only when it contains an exception. Keep its related events to understand the failure. Discard successful activity without exceptions.
For developers who mainly want a Laravel exception tracker.
Record occurrences with detected issues, including exceptions, failed jobs, failed requests, and slow operations. Keep the related events that explain each recorded occurrence.
For teams that want to catch errors and performance problems.
Record successful activity as well as problems. Monitor request times, queues, database queries, and other activity across your Laravel app.
For teams that want a full picture of application performance.
Related queries, logs, and other recorded events count toward usage in every mode. Recording fewer occurrences can reduce extra event charges.
Choose your recording modeException tracking pricing
The price depends on the events you send. With exceptions-only recording, you send occurrences with exceptions and their related events, instead of paying to record all successful activity.
Estimate your monthly costFree trial
$0to try Laritor
Pay as you go
$20/ month
Laravel package installation
Install the Laravel client, connect your app, and choose exceptions-only recording. Set up alerts so your team knows when an exception needs attention.
Read the installation guideCreate an account and add your application. Copy its ingest endpoint and backend key from Laritor’s setup instructions.
composer require binarybuilds/laritor-clientEnable Laritor and replace the example values with your application’s credentials in your .env file.
LARITOR_ENABLED=true
LARITOR_INGEST_ENDPOINT=your-ingest-url
LARITOR_BACKEND_KEY=your-backend-keyGenerate the exceptions-only filter. Then register the generated override in your AppServiceProvider’s register method, as shown below.
Filter registration guide →php artisan make:laritor-filter exceptions-onlypublic function register(): void
{
$this->app->bind(
\BinaryBuilds\LaritorClient\Override\LaritorOverride::class,
\App\Laritor\LaritorDataFilter::class
);
}Run the sync command after deployment. In Laritor, connect an alert integration and enable exception alerts for the application and environments you want to monitor.
Alert configuration guide →php artisan laritor:syncI have tried Laritor in action on one of my projects, and it's really good. It gives observability of the whole Laravel project and various operations. Totally recommend!
Common questions
How recording, alerts, AI debugging, privacy, and billing work in Laritor.
A Laravel exception tracker collects exceptions from your application so you can see what failed, when it failed, and where it failed in your code. Laritor adds occurrence history, alerts, full stack traces, and related events from the recorded request, job, command, or scheduled task. You can use it for exception tracking alone or extend it to issue tracking and performance monitoring.
Yes. Choose exceptions-only recording to send occurrences that contain an exception, along with their related events. Successful activity without exceptions is discarded. You still get stack traces, occurrence history, alerts, and AI debugging features without recording all application activity.
An exception identifies an error, such as its class, message, and failing code location. An occurrence is an individual time that error happened. Laritor lets you inspect occurrence history and open the recorded request or job associated with a particular failure.
Yes. When a recorded request, job, command, or task contains an exception, Laritor keeps the related events permitted by your recording settings. These can include database queries, logs, outbound requests, cache operations, and custom events. That context helps explain the failure. The occurrence and its related events count toward your usage.
Laravel can report exceptions through its configured logging channels. Laritor gives you a dedicated interface to investigate those exceptions, inspect full stack traces and surrounding code, review occurrence history, and follow recorded events from the affected request or job. It also connects exception alerts to your team’s tools and provides AI-assisted debugging.
Yes. Laritor tracks exceptions from recorded HTTP requests, queued jobs, Artisan commands, and scheduled tasks. From an exception occurrence, open the related execution to inspect its events. This helps investigate background failures as well as errors visible to users.
Yes. The exception details include the error message, class, failing file and line, full stack trace, and a code preview around the failing line. Search the stack frames and inspect application or vendor frames to follow the calls that led to the error.
Configure an integration in Laritor, then enable exception alerts for your application and choose the environments and channels you need. Laritor supports Slack, email lists, Microsoft Teams, Discord, Telegram, GitHub, Linear, and webhooks. GitHub and Linear integrations can create issues containing the exception details and a link to Laritor.
Review its total occurrence count and first and last seen dates, then inspect individual occurrences. Use date and exception class or message filters to find relevant errors. After deploying a fix, check for new occurrences during the period when the affected code runs again.
Laritor’s in-app AI provides explanations, recommendations, and example code based on the exception and recorded context. Alternatively, connect your coding agent through Laritor MCP so it can retrieve exception details and related events, then investigate them with your repository. Review and test the proposed change before deploying it. Each account includes 50 in-app AI prompts per month; you can also connect your own AI provider.
Laritor MCP gives a connected agent access to recorded application data, including exception details, stack traces, and request or job event timelines. The agent can use this context with the code in your repository to understand a failure and work on a fix. Laritor’s data tools provide context; changes to your code happen through your coding agent’s own workflow.
Yes. Customize the Laravel client to redact sensitive strings and fields, anonymize authenticated user information, and control the context you record before it is sent to Laritor. Request and response bodies are disabled by default. Use the customization hooks to remove tokens, passwords, email addresses, or other data your application should not send.
The free trial includes 300K events and 14-day retention. The paid plan starts at $20 per month with 20 million events and 30-day retention. Additional events cost $0.20 per 100K. All three recording modes have the same base price. In exceptions-only mode, you pay for the exception occurrences and related events you send, rather than all successful activity.
An occurrence can include several events. For example, a recorded request with three queries, one log entry, and one exception uses six events when each is 2KB or less: the request, three queries, the log, and the exception. Larger events count in 2KB blocks. Your bill depends on the events and data sizes you send.
Create a Laritor application, install binarybuilds/laritor-client with Composer, and add the application’s connection settings to your environment. Generate an exceptions-only filter and register the generated override in your AppServiceProvider. Run php artisan laritor:sync after deployment, then configure exception alerts in Laritor. The installation and customization guides explain each step.
Yes. Switch to issues-only recording to include detected problems such as failed jobs, failed requests, and slow operations. Choose full observability to also record successful activity for broader performance monitoring. All modes include Laritor features; the choice determines which activity your application sends.
Keep exploring
Get started with Laritor
Get alerts, full stack traces, and the events behind your Laravel errors. Start with exceptions only and expand to issue tracking or performance monitoring when you need it.
Free trial: 300K events · Unlimited apps and users