
CPU usage
See how much processing capacity your server is using. Review peaks around traffic increases, slow requests, or background work.
Laravel server monitoring
Laritor is a performance monitoring and issue tracking tool for Laravel. Track your servers’ CPU, memory, and disk usage, see which hosts are reporting, and review resource trends alongside slow requests, background jobs, and application errors.
Free trial: 300K events · Unlimited apps and servers
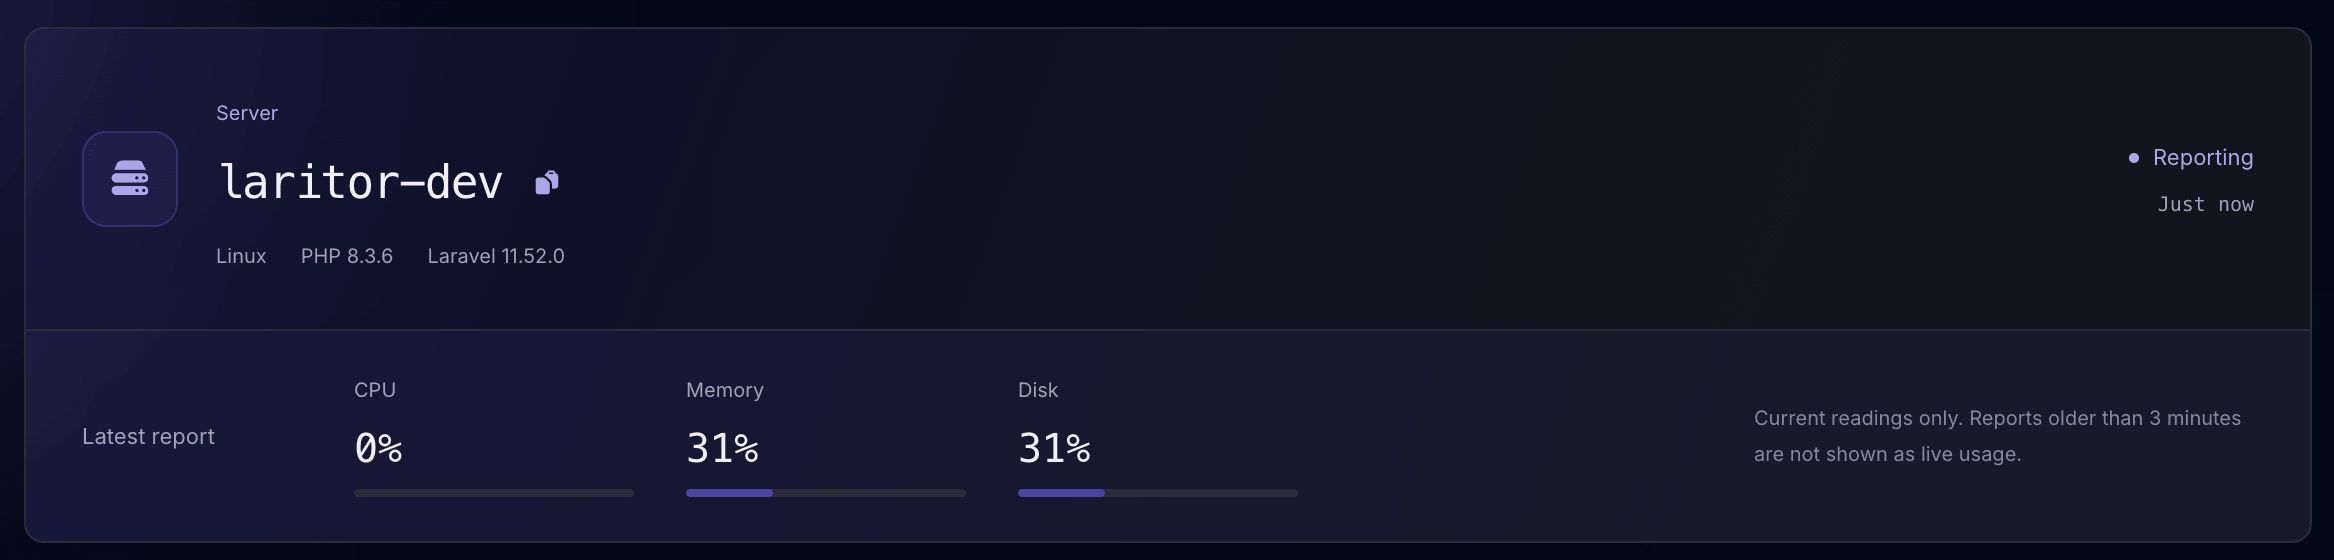
Check your serversReporting status and current readings.
Review resource trendsCPU, memory, and disk over time.
Investigate app performanceRequests, jobs, tasks, and errors.
See how much processing capacity your server is using. Review peaks around traffic increases, slow requests, or background work.
Track how much available memory is in use. Watch for sustained growth and investigate the workloads running at that time.
Follow how much disk space is used. Spot growth early and check logs, backups, or other files before space becomes a problem.
Your servers in one environment
See each server’s hostname, available operating system, PHP and Laravel versions, recent resource readings, and last report time. Use the Reporting, High usage, and No recent metrics filters to focus the list.
Open a server to inspect its history. Recent readings help you see the current situation; historical charts show whether usage is a short spike or a recurring pattern.
Explore server monitoring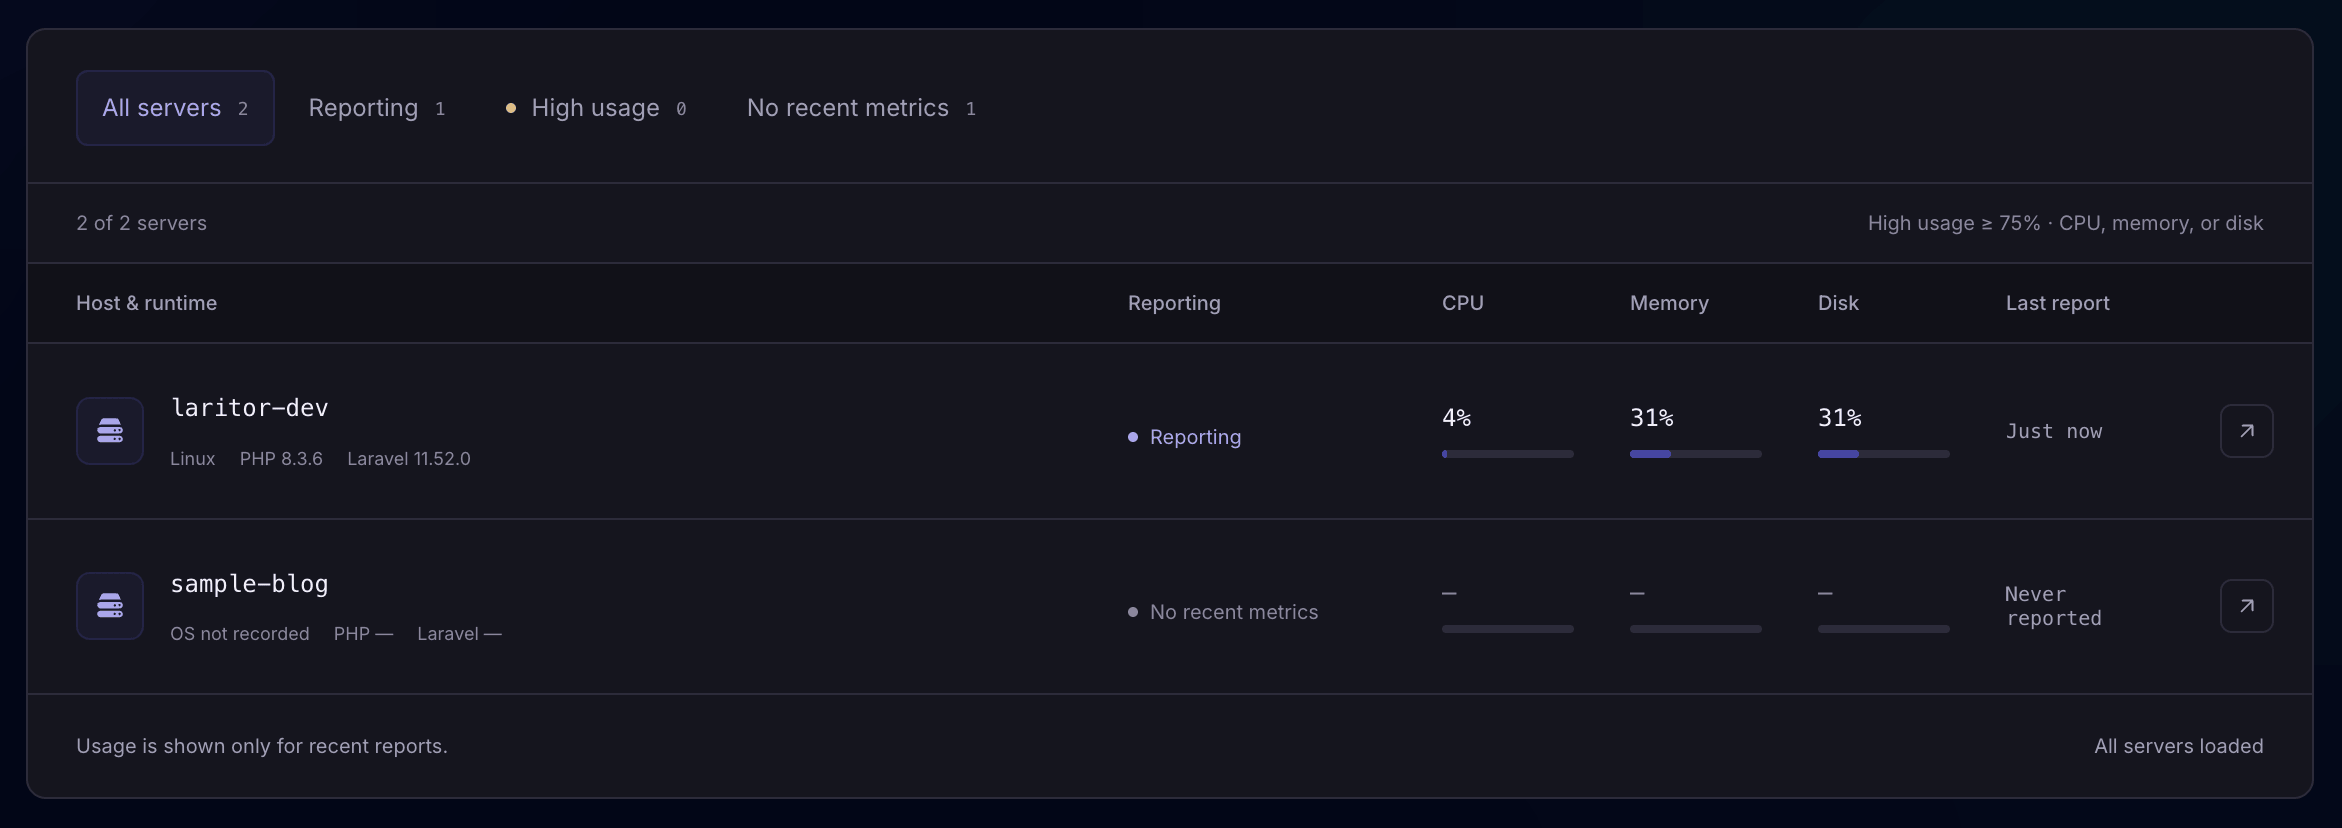
See which servers have recent metrics and check the last report time. Current usage is shown only for recent reports.
Find servers with CPU, memory, or disk usage of at least 75% in the current view. Open a server to review its trend.
Find hosts without a recent reading. Check metric collection, scheduling, and connectivity; a missing report alone does not prove a server is down.
The current server view excludes reports older than three minutes from live usage. A missing reading is different from a recorded value of 0%.
CPU, memory, and disk trends
Select a time window and switch between resource charts. Review peaks, steady usage, and gradual growth to understand how the server behaves over time.
Each chart shows the highest recorded utilization in each time interval. The summary shows the highest interval peak, the lowest interval peak, and how many intervals have data.
Use the CPU chart to find resource peaks and compare them with the time your app slowed down. Look at requests, queue jobs, or scheduled tasks in that window to decide what to investigate.
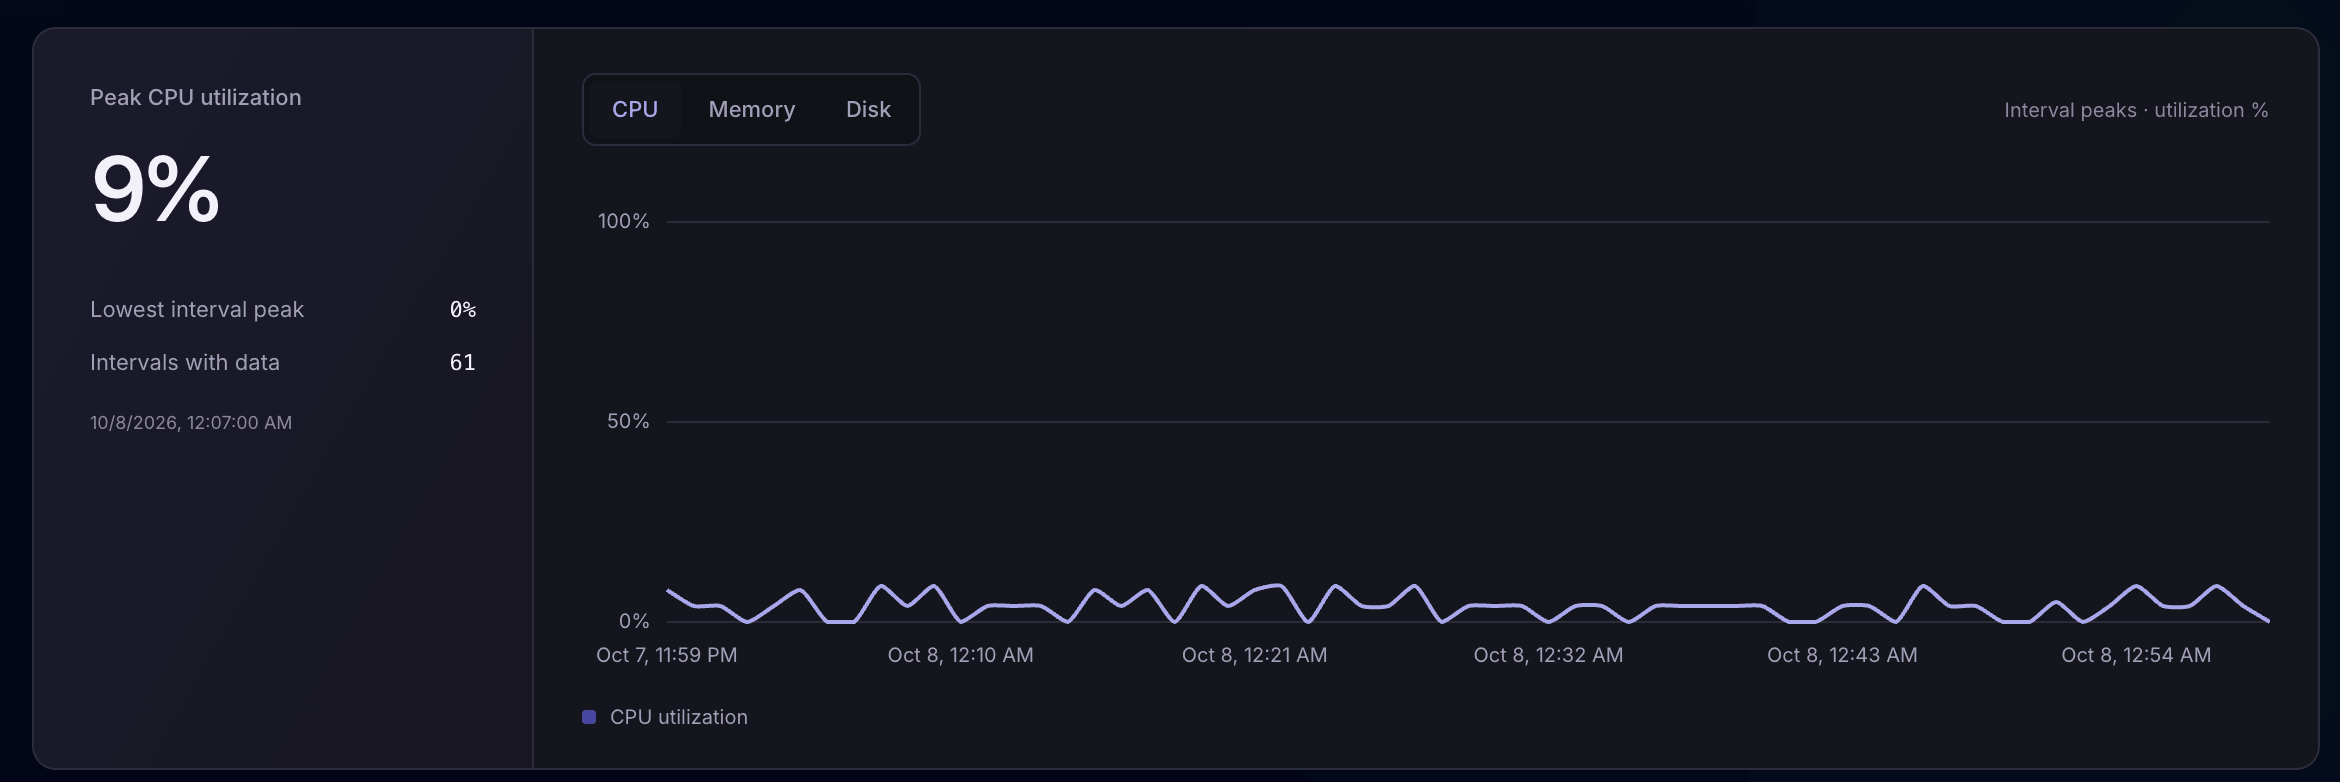
A high CPU reading identifies a busy period. It does not identify a particular request or process as the cause.
Check whether memory usage stays steady, rises during busy periods, or keeps growing. Compare the trend with deployments and long-running jobs, then inspect the relevant application activity.
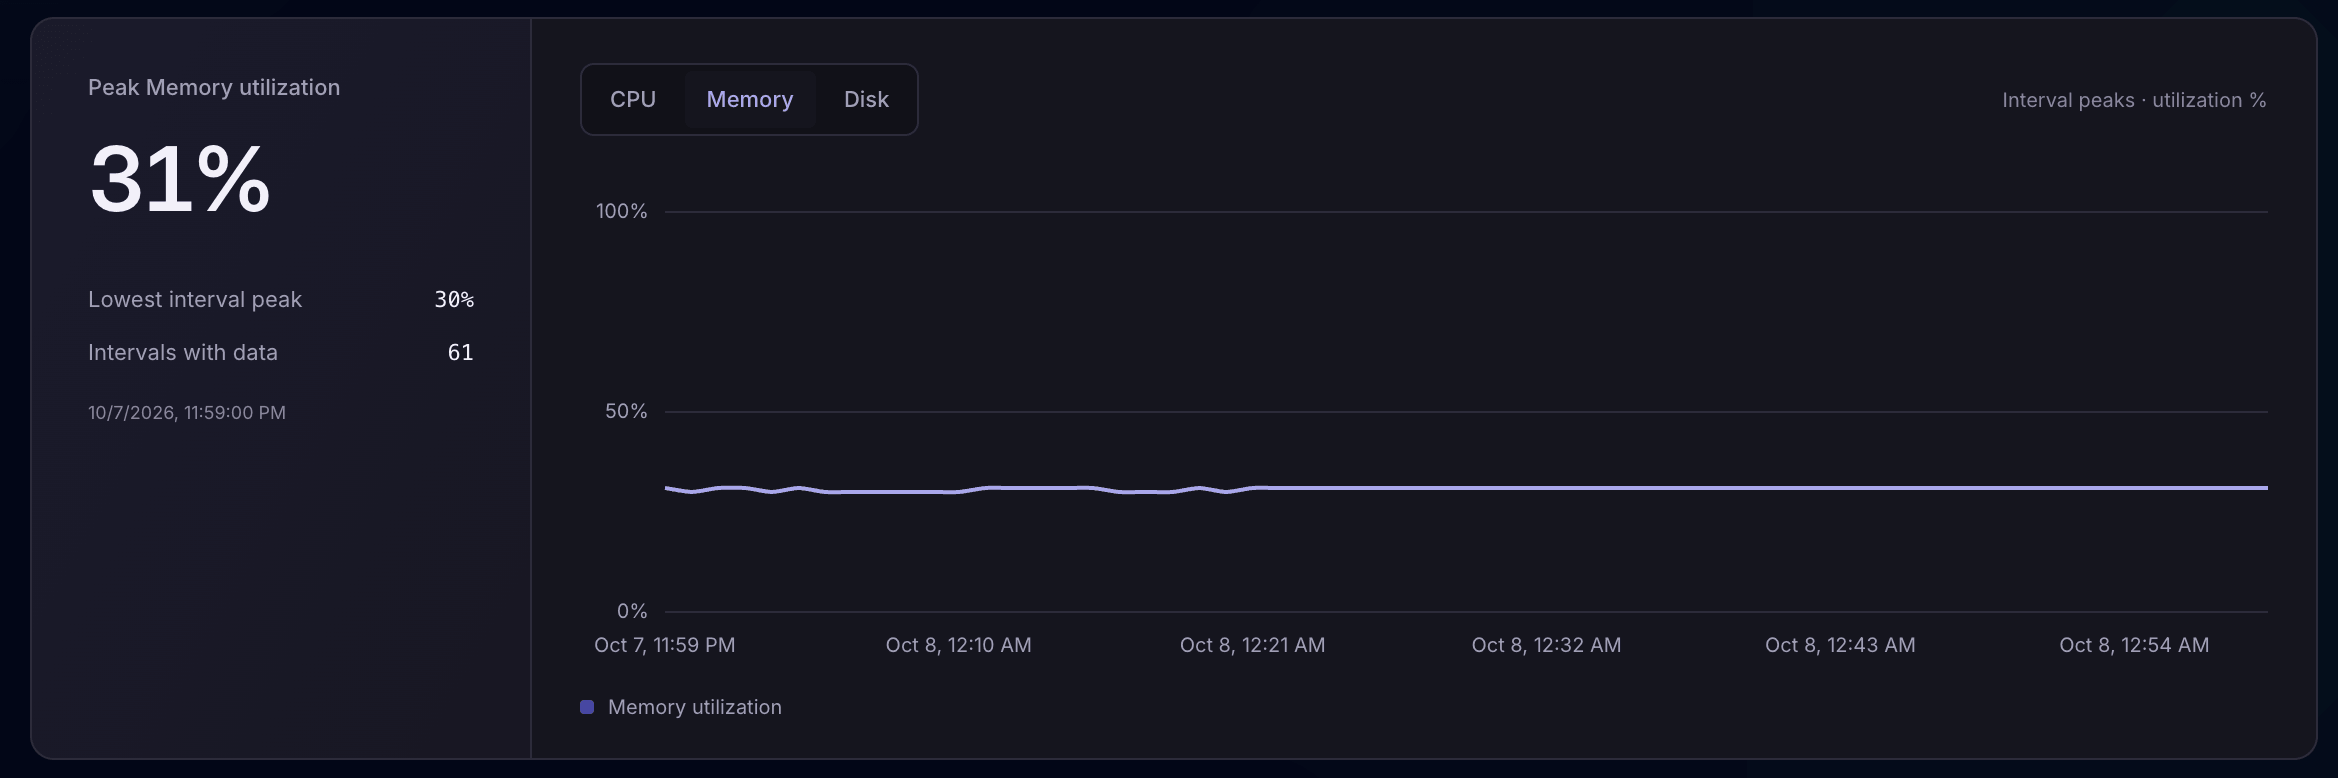
A rising trend is a reason to investigate. The chart alone does not prove a memory leak or identify which process uses the memory.
Track the percentage of disk capacity in use. Compare recent readings with earlier periods to see whether usage is stable or growing, then review files and retention policies on the server.
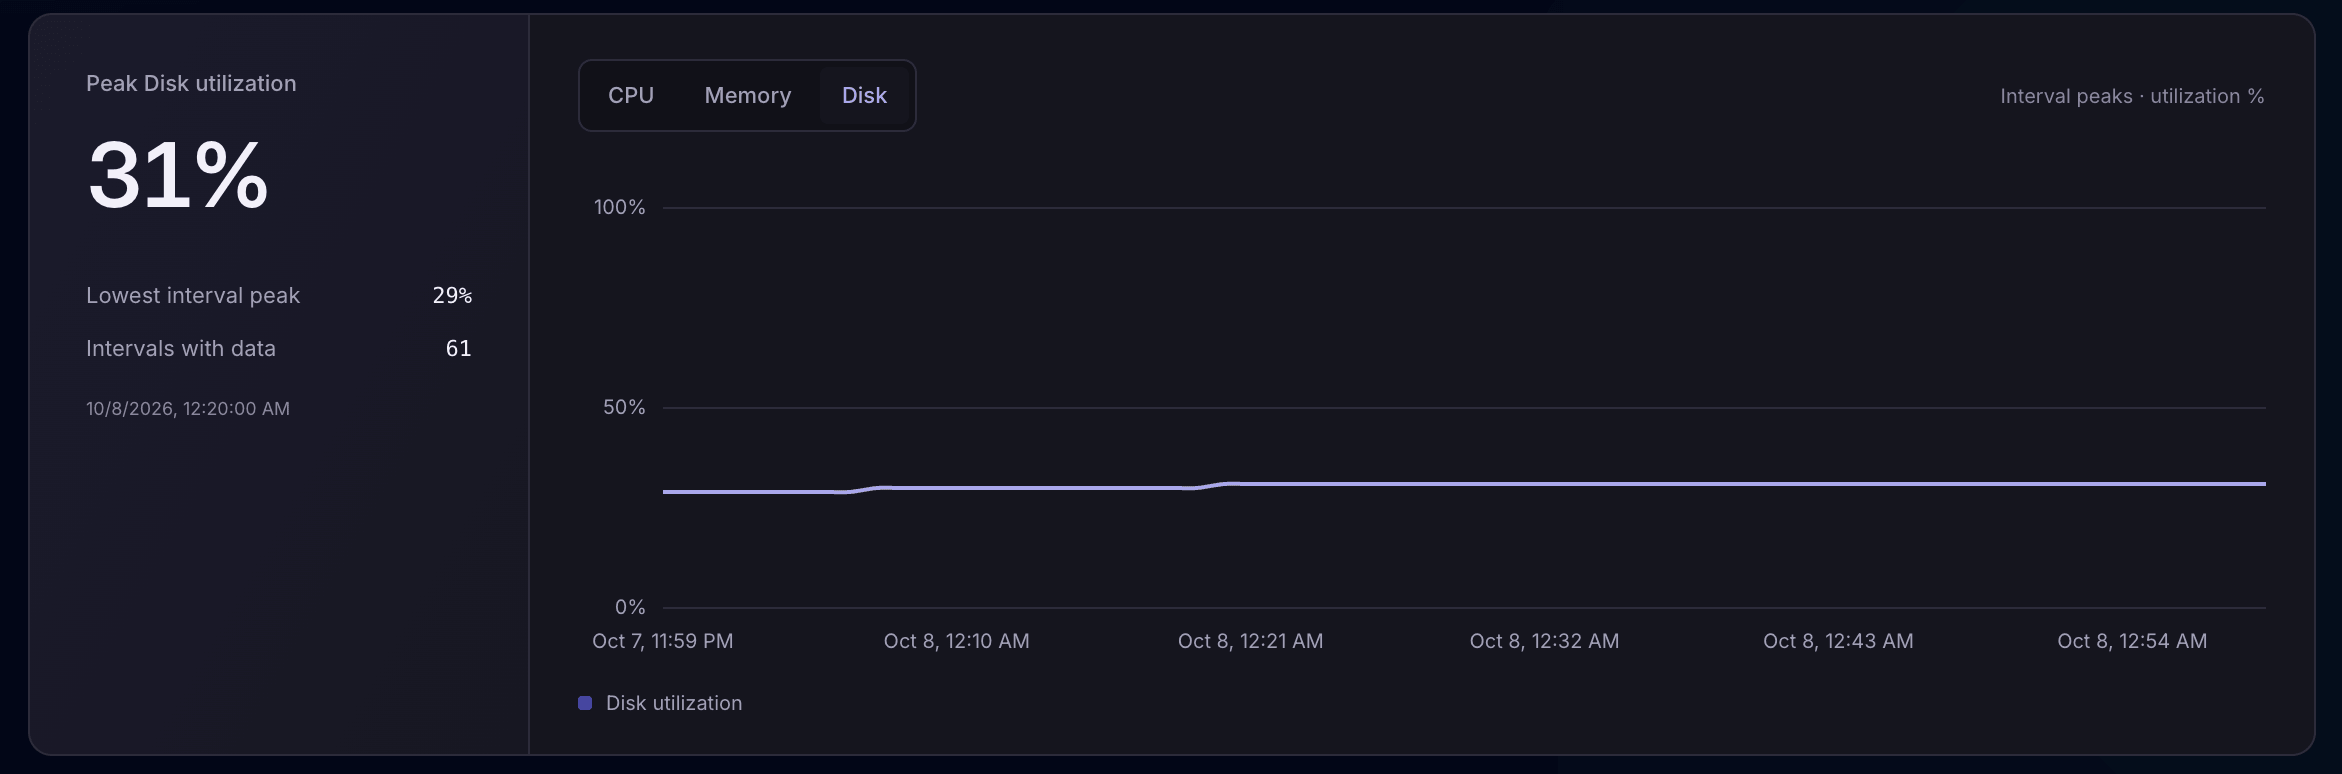
Disk usage measures occupied space. It does not measure disk I/O speed or identify individual files.
Interval peaks are not average usage. A gap in recorded data does not establish that the server used no resources during that period.
Laravel runtime and configuration
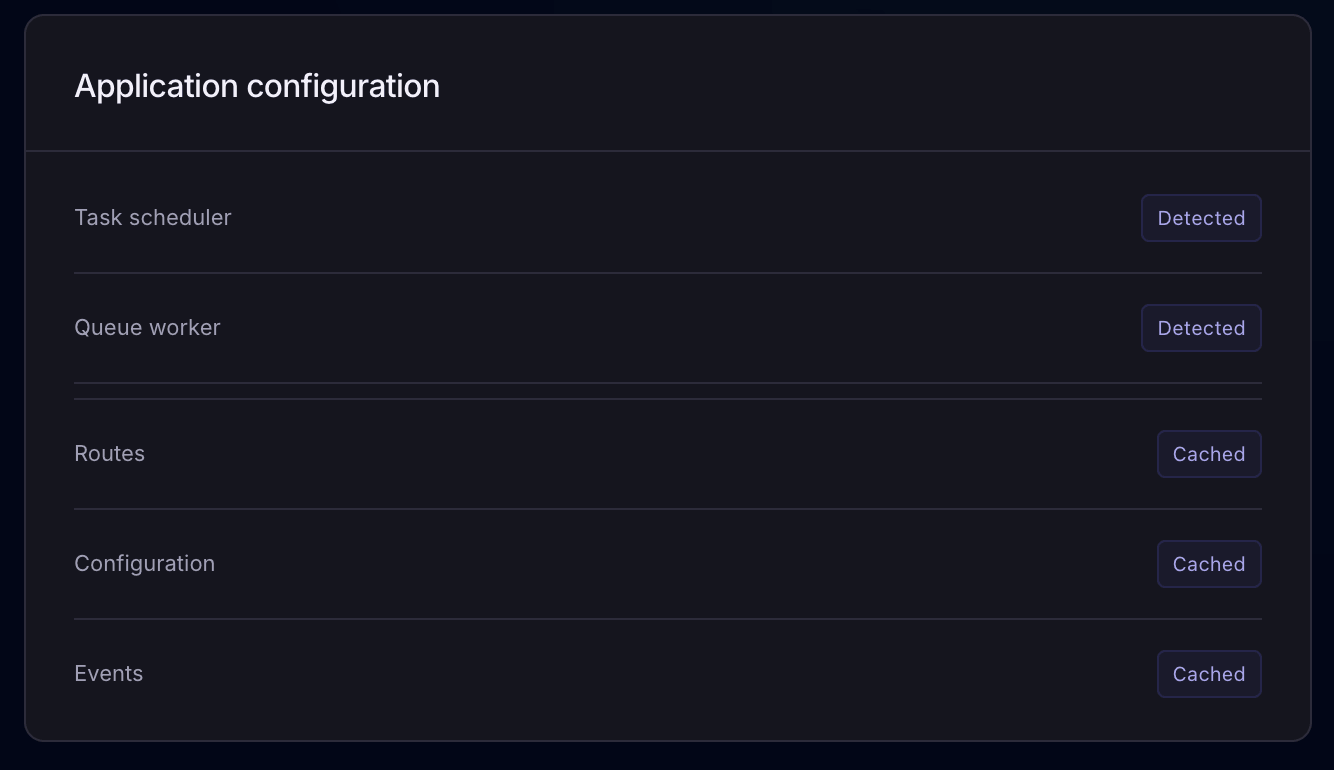
Review whether the task scheduler and queue worker were detected. Check whether routes, configuration, and events are cached, alongside the host’s PHP and Laravel versions.
Use these details when reviewing a deployment or investigating differences between servers. Keep metadata up to date by running php artisan laritor:sync after deployment.
A detected worker or scheduler does not guarantee every job or task succeeds. Inspect their activity and health checks to follow up.
Server metrics and Laravel activity
Start with the time the problem happened. Compare resource trends with the requests, jobs, and scheduled tasks recorded in the same environment.
Open the relevant execution to inspect queries, external API calls, logs, and exceptions. Use the timing and recorded events to decide whether to improve the code, change when work runs, or review server capacity.
Check reporting status and select the period when the problem occurred. Compare the latest reading with CPU, memory, or disk trends.
Review recorded requests, jobs, or scheduled tasks in the same environment and time window. Open slow or failed executions and inspect their events.
Use the evidence to improve code, scheduling, retention, or capacity. Review new resource readings and application performance after the change.
Matching timestamps help you choose what to inspect. A resource spike alone does not prove which process or execution caused it.
Check more than resource usage
Pair server metrics with Laritor health checks to inspect the services your app relies on. Use built-in or custom checks for application dependencies, and configure alerts for supported issues where your team needs them.
Use Laritor how you want
Use Laritor for exceptions, detected issues, or full observability. Choose how much application activity you want available when investigating server performance.
Server metrics are collected through the scheduled laritor:send-metrics command. Configure that collection separately. Filtered recording modes can leave gaps in the application workload available to explain a resource peak.
Record occurrences that contain an exception, together with their related events. Inspect failures alongside server trends for the same period.
Focus application recording on exceptions.
Record occurrences with detected issues, such as slow requests and failed jobs. Use this context to investigate problems around resource peaks.
Keep application activity that needs attention.
Record successful activity too. Compare routine workloads with slow or failed executions to build a broader picture of application performance.
See more of the workload running on your servers.
Paid plans start at $20/month with 20M events included and unlimited servers. Usage depends on the events you send. Estimate your usage
Install the client and enable server metrics
Add the Laravel client, connect it to your app in Laritor, and schedule the metrics command every minute on each host you want to monitor.
If you use Laravel Scheduler, make sure the scheduler runs on that server. Check the last report time in Laritor to confirm that readings are arriving.
Read the installation guideAdd the client to your Laravel application.
composer require binarybuilds/laritor-clientUse the ingest endpoint and backend key from your Laritor dashboard.
LARITOR_ENABLED=true
LARITOR_INGEST_ENDPOINT=your-ingest-url
LARITOR_BACKEND_KEY=your-backend-keyRun this after each deployment to update server metadata and other application information.
php artisan laritor:syncSchedule this command every minute through Laravel Scheduler or system cron on each server you want to monitor.
php artisan laritor:send-metricsUse LARITOR_SERVER_NAME to override the default hostname with a stable, distinct name. Keep credentials private and review the information your app sends. Explore customization and redaction
Laravel server monitoring questions
Answers about setup, reporting status, resource charts, application configuration, and recording modes.
Laravel server monitoring tracks the infrastructure running your app, including CPU, memory, and disk usage. Laritor combines these server readings with Laravel performance monitoring and issue tracking, so you can review resource trends and investigate recorded requests, jobs, scheduled tasks, and exceptions in the same environment.
Laritor records CPU, memory, and disk utilization percentages when server metric collection is configured. Server views also show the hostname, available operating system and runtime information, reporting status, and last report time. Open a server to inspect historical resource trends.
Install and configure the Laritor Laravel client, run php artisan laritor:sync after deployment, and schedule php artisan laritor:send-metrics every minute through Laravel Scheduler or system cron. Configure collection on each server you want to monitor and make sure the scheduled command runs and can reach your ingest endpoint.
It means Laritor has no recent server metric report to display. The current server view does not show reports older than three minutes as live usage. Check the scheduled metrics command, client configuration, and network connectivity. A missing report does not by itself confirm that the server is offline.
The current server list marks high usage when CPU, memory, or disk utilization is at least 75%. Use it to find servers that need a closer look, then open their historical charts. This filter is a visual status in the server list; it is not a promise that a notification has been sent.
The charts show the highest recorded utilization in each time interval. The peak summary is the highest of those interval peaks, and the lowest interval peak is the smallest peak among intervals with data. These values are not average usage. Intervals without data do not establish zero utilization.
Yes. Find the time of a resource spike and inspect recorded requests, jobs, or scheduled tasks in the same environment and time window. Their related queries, API calls, logs, and exceptions help explain the application work. Matching timestamps are a starting point for investigation, rather than proof that one execution caused the server spike.
The application configuration panel shows detected task scheduler and queue worker status, plus route, configuration, and event cache status. Use it to review the reported setup. A detected worker or scheduler alone does not guarantee that every job or scheduled task is running successfully; inspect those resources and health checks too.
Server metrics use the scheduled laritor:send-metrics command. Configure this collection separately from your choice of Exception tracker issue tracker, or full observability application recording. Filtered modes retain less application activity, so the requests or jobs available to explain a resource peak may be limited.
Yes. Set LARITOR_SERVER_NAME in the Laravel client configuration to override the default hostname. Use a stable, distinct name for each host you want to recognize in your environment, and run the sync command after deployment to keep server metadata up to date.
Monitor your Laravel app and its servers
Add Laritor’s Laravel client, enable server metric collection, and investigate resource trends alongside your application activity.
Free trial: 300K events · Unlimited apps and servers