
Laritor
Yes
Laritor vs LaraOwl
Laritor tracks exceptions, detects issues, and monitors Laravel performance. Follow requests, queues, queries, and user sessions in one place. Build your own dashboards, inspect server resources, and debug with in-app AI or your coding agent through MCP.
Published by Laritor · Comparison checked · View comparison notes
Designed primarily for Laravel. All tools compared here support Laravel.
Yes
Yes
Why choose Laritor over LaraOwl?
Both tools track Laravel exceptions, issues, and performance. Laritor manages telemetry storage and adds custom dashboards, session journeys, feature flag insights, and reports. LaraOwl is a free open-source platform that you run on your own infrastructure, with security analysis, Cloudflare controls, uptime checks, and MCP.
The full feature comparison
Compare 40 capabilities. See where Laritor gives you more, where LaraOwl has an advantage, and what both tools offer.
“Not listed” means a dedicated feature was not found in the public documentation reviewed. Custom instrumentation or an integration may offer another way to meet that need. LaraOwl already has issue management, alerts, related execution records, user activity, cache and log views, security analysis, uptime checks, and MCP. This comparison distinguishes those features from Laritor’s dedicated views and the details collected by each client.
Managed storage, custom dashboards, request and API bodies, SQL bindings, session journeys, Pennant analytics, in-app AI, and PDF reports.
| Capability | Laritor | LaraOwl |
|---|---|---|
| Managed ingestion and monitoring storage | Less infrastructure to manage Install the Laravel client. Laritor hosts ingestion, the dashboard, and stored telemetry. | Deploy the server, database, queue workers, scheduler, and Reverb. Operate upgrades, backups, and capacity yourself. |
| Unlimited customizable dashboards | 85+ widgets Build unlimited dashboards with 85+ included Laravel widgets. | Project dashboards and dedicated resources. An equivalent configurable widget dashboard builder is not listed. |
| Automatic Pennant performance insights | Understand feature rollouts Feature flag evaluations, activation rates, durations, and related errors. | Laravel Context can carry custom metadata. Dedicated automatic Pennant collection and analytics are not listed. |
| Laravel session journeys | Follow a customer’s visit Follow recorded requests from the same session with users and custom events. | User activity and request history. A dedicated journey grouped by Laravel session is not listed. |
| Host CPU, memory, and disk charts | Code and server resources Optional host resource collection with dedicated server performance views. | Execution peak memory and server identifiers are recorded. Dedicated host CPU, memory, and disk resource charts are not listed. |
| Custom Laravel dependency checks | Check your dependencies Write checks for your application’s dependencies, with result history and failure alerts. | Built-in HTTP uptime checks and heartbeat monitoring. A comparable custom in-app dependency check resource is not listed. |
| Application database schema explorer | Schema-aware debugging Browse tables, columns, indexes, and relationships beside recorded queries. | Query analytics, slow-query detection, and N+1 investigation. An application schema explorer is not listed. |
| Custom daily and weekly PDF reports | Share performance snapshots Choose performance metrics and receive scheduled PDF application snapshots by email. | Live project dashboards. Custom scheduled PDF performance reports are not listed. |
| Bot traffic performance analytics | Understand automated traffic Dedicated bot and suspicious request views with performance metrics and recording filters. | Security risk scoring, per-IP threat timelines, and Cloudflare traffic analytics. A comparable application bot performance view is not listed. |
| Named business event resources | See your business workflows Custom events in timelines, a dedicated resource, and dashboards. | Custom Context metadata and logs can describe application activity. A dedicated named business event resource is not listed. |
| Ready-to-use problem recording modes | Choose what you record Exception tracker issue tracker, or full observability filters retain related recorded events. | Request, command, exception, and task sampling plus event ignore controls. Equivalent named problem recording presets are not listed. |
| In-app AI and provider choice | Debug inside Laritor Recommendations inside Laritor with configurable AI provider and model settings. | Self-hosted MCP for external coding agents. An equivalent in-app AI recommendation workflow is not listed. |
| Incoming request and response bodies | Inspect more than a status code Optional request payload and response content capture on retained requests. | Headers are captured; optional request payload capture is limited to HTTP 500 responses in the reviewed client. Response bodies are not recorded. |
| Outbound API headers and bodies | Find why API calls fail Optional outgoing headers, payloads, status codes, and response content. | URL, host, method, status, duration, and sizes. Headers and request/response bodies are absent from the reviewed outgoing sensor. |
| Recorded SQL bindings | Inspect query parameters SQL, bindings, duration, and related execution events. | SQL, location, duration, connection, and trace identifiers. The reviewed query sensor does not record bindings. |
| Command output capture | Read the output of a failed command Inspect captured command output alongside execution details and related events. | Command names, exit codes, durations, counters, and context. The reviewed sensor does not capture stdout. |
| Queue wait time views | Find queue bottlenecks Compare dispatch delay, worker wait, execution duration, and throughput. | Job attempts, status, duration, failures, and queue analytics. An equivalent dedicated wait time view is not listed. |
Free open-source server, full self-hosting, configurable history, threat analysis, Cloudflare firewall controls, uptime/heartbeat checks, and MCP issue changes.
| Capability | Laritor | LaraOwl |
|---|---|---|
| Free open-source server | Paid hosted monitoring starts at $20/month with event-based usage. | Apache 2.0 server with no per-seat or per-event license fee. Inspect and modify the source; hosting costs are separate. |
| Fully self-hosted deployment | Hosted ingestion, storage, and monitoring interface. | Run the dashboard, API, database, and ingestion on infrastructure you control using Docker or Composer. |
| Configurable history and direct database access | 30-day retention on the published paid plan. | Per-project retention up to 90 days or no automatic deletion, with your own database access and capacity management. |
| Built-in threat analysis workspace | Bot and suspicious traffic monitoring with detection settings. | Analyze SQL injection, XSS, traversal, injection, and file-inclusion patterns with risk scores and IP threat timelines. |
| Cloudflare firewall management | Recording and traffic investigation controls. A comparable built-in Cloudflare rule editor is not listed. | Create and manage Cloudflare firewall rules, inspect traffic/audits, and block IPs from the dashboard. |
| MCP issue mutations | Hosted read-only exception and recorded execution context for coding agents. | Self-hosted MCP can investigate telemetry, update issue status, and add comments within the user’s teams. |
| Built-in external uptime and heartbeat checks | Custom dependency checks and scheduled task investigation. | HTTP availability checks with response history and interval-based heartbeat failure alerts. |
Both are Laravel native and offer exceptions, issues, performance monitoring, related execution records, cache analytics, alerts, and MCP.
| Capability | Laritor | LaraOwl |
|---|---|---|
| Laravel exception tracking | Grouped exceptions, full stack traces, source context, and occurrence details. | Grouped exceptions, stack traces, occurrence counts, first/last seen, and resolution status. |
| Issue tracking and performance thresholds | Issues for exceptions, failures, and slow activity with configurable detection. | Grouped issues and configurable route, job, query, command, and scheduled execution thresholds. |
| Application performance monitoring | Request duration metrics, route timings, failure rates, queries, and jobs. | Request and route analytics, execution timings, time-series charts, failures, and background work. |
| Related execution investigation | Related queries, logs, API calls, and other recorded events in retained executions. | Trace-correlated records and execution views with related queries, logs, and other telemetry. |
| Slow queries and N+1 investigation | Recorded SQL timing and repeated query investigation inside executions. | Slow-query and N+1 detection with SQL, duration, and connection context. |
| Job execution and failures | Recorded attempts, failures, duration, and related events. | Job status, attempts, processing duration, failures, and retries. |
| Artisan command monitoring | Command executions, status, duration, and recorded activity. | Command execution history, exit codes, runtime duration, and related records. |
| Scheduled task monitoring | Scheduler execution history, failures, timing, and related events. | Scheduled execution history, failures, timing, and heartbeat health. |
| Laravel cache analytics | Cache events, hit/miss metrics, timing, and execution context. | Cache hit/miss ratios, key-level analytics, and event records. |
| Application log inspection | Recorded logs in execution timelines and a dedicated searchable resource. | Forward logs through its Laravel channel to a centralized searchable viewer. |
| Mail and notification monitoring | Dedicated resources and events linked to retained executions. | Mail records and notification channel analytics in dedicated dashboard resources. |
| Exception and performance alerts | Issue alerts through configured integrations. | Slack, Discord, Telegram, email, and webhooks with exception, latency, and error-spike triggers. |
| User activity and custom context | Authenticated users, custom metadata, and recorded user activity. | User activity drill-down, request history, and Laravel Context metadata. |
| Collection controls and sampling | Client-side event settings, sampling, and custom recording filters. | Configurable request, command, exception, and task sample rates, event switches, and filtering APIs. |
| Sensitive data controls | Client-side collection controls and redaction before ingestion. | Client header/field masking, optional payload capture, and record redaction callbacks. Review custom context separately. |
| MCP investigation for coding agents | Hosted exception details and recorded execution context through MCP. | Team-scoped projects, issues, and telemetry queries through the server’s MCP endpoint. |
Major difference
Laritor handles the monitoring backend for you. LaraOwl puts a separate monitoring application, database, workers, and supporting services on infrastructure your team must provision and maintain.
Install Laritor’s Laravel client and use the managed service. LaraOwl requires its web application and API, a relational database, queue workers, scheduler, and Reverb; Redis is strongly recommended.
Laritor manages backend capacity and storage. With LaraOwl, your team provisions resources, watches service health, arranges backups, installs updates, and scales the monitoring deployment.
Laritor applies your plan’s retention. With LaraOwl, you select retention and keep scheduled pruning and the storage services working as telemetry grows.
Why choose Laritor over LaraOwl?
Use managed monitoring storage, investigate failures with more context, and build the views your Laravel team needs.
20M billable events, unlimited apps and users, and 30-day retention. Choose exceptions, detected issues, or all activity without a separate error or log quota.
LaraOwl has no software license fee. You operate its application server, database, and background services. The comparison below separates free software from a hosted monitoring subscription.
Cost calculator
Estimate Laritor’s hosted subscription from your recorded workload. LaraOwl has no software license fee; you provide the hosting and background services.
20,000,000 billable events
Application server, database, workers, scheduler, and Reverb
$0 covers the software license. LaraOwl’s hosting, backups, and maintenance are separate. Their cost depends on your workload and hosting setup.
Laritor monthly USD before tax: $20 includes 20M billable events, then $0.20 per started 100K. Events use 2 KB billing increments; above $500/month, Laritor shows “Ask for a quote.” LaraOwl’s software license is free, with no event or seat fee. Its running costs are excluded from the $0 license figure. Trials, setup work, and custom contracts are excluded. See LaraOwl’s hosting requirements ↗
Let Laritor manage ingestion, stored telemetry, and the monitoring interface.
Managed monitoring
Install the Laritor Composer client and configure your ingest endpoint and key. Choose what to record while Laritor manages its ingestion service, dashboard, and stored data.
LaraOwl gives you a fully self-hosted platform with no software fee. You deploy and operate the server, database, workers, scheduler, and Reverb. Laritor is a better fit when your team wants a managed service.
Server resources
Use optional host collection to view CPU, memory, and disk metrics beside application performance.
LaraOwl records server names and execution memory, and its security views investigate request threats. Dedicated application host resource charts are not listed.
Custom dependency checks
Write health checks in Laravel and inspect result history and failure alerts. Check dependencies that need to work for your application to serve users.
LaraOwl already includes external HTTP uptime and heartbeat checks. Laritor adds a dedicated workflow for custom checks within your Laravel application.
Inspect bodies, parameters, and output behind failing executions.
Request and response context
Capture request payloads and response content when your recording and privacy settings allow it. Inspect them alongside the execution’s recorded events.
LaraOwl’s reviewed client captures headers and optional payloads only when the response is HTTP 500. It records response size and status, but does not store response bodies.
Outbound API context
Inspect optional outgoing headers and payloads and the response content returned by the API. Follow the call back to its recorded request or job.
LaraOwl records outbound method, host, URL, status, duration, and sizes. Its reviewed outgoing sensor does not capture headers or request and response bodies.
Query parameters
Inspect recorded SQL bindings with query duration and related execution activity. Browse the database schema to understand the tables and indexes involved.
LaraOwl already supports slow-query and N+1 investigation. Its current query sensor captures SQL and location but omits bindings; an application schema explorer is not listed.
Command output
Capture command output and inspect it with exceptions, queries, logs, and other recorded activity.
LaraOwl already monitors command history, duration, and exit codes. Its reviewed command sensor does not capture stdout.
Debug with your AI agent
Laritor MCP lets your agent retrieve exception details and the recorded execution timeline. It can inspect those events alongside your code to investigate the cause and work on a fix. In-app AI recommendations are available too.
Both tools support MCP. Laritor hosts read-only exception context and adds in-app recommendations with provider choice. LaraOwl’s self-hosted MCP also supports issue status changes and comments. Choose your in-app AI provider ↗
Read the Laritor MCP guide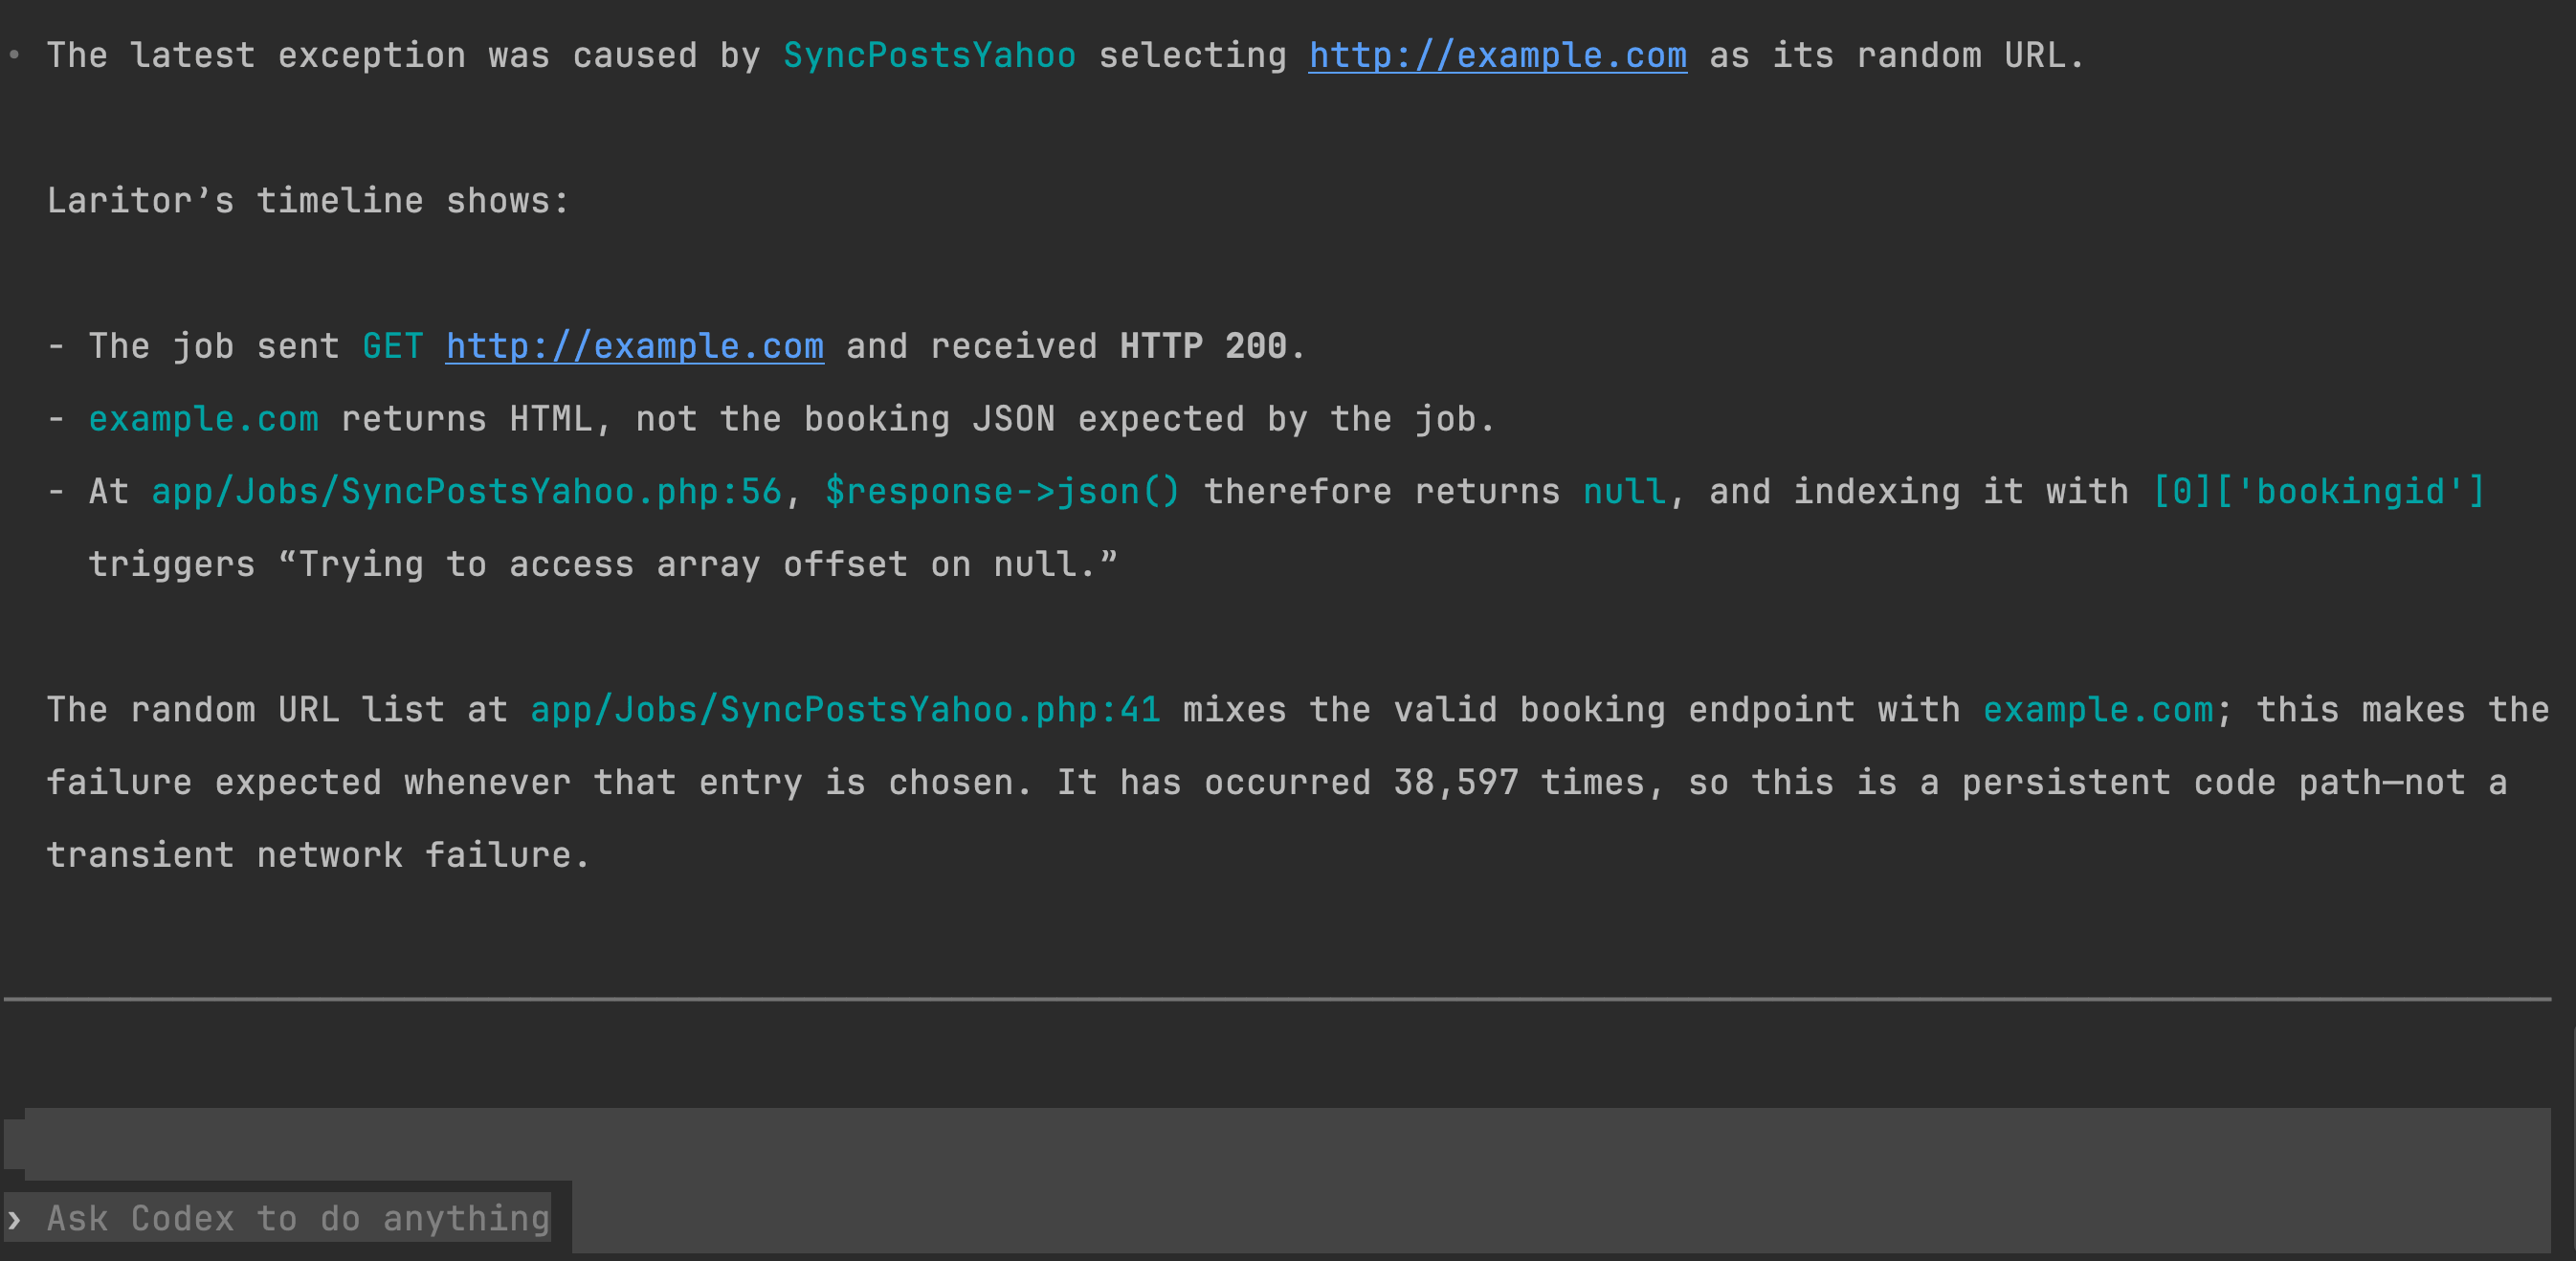
Understand visits, rollouts, and business activity across recorded executions.
Customizable dashboards
Arrange unlimited dashboards from 85+ widgets for exceptions, performance, queues, users, and server resources.
LaraOwl has live project dashboards and many dedicated resources. An equivalent custom widget dashboard builder is not listed.
Session journeys
Inspect requests recorded during the same Laravel session and add custom events for checkout, subscription changes, and other milestones.
LaraOwl offers user activity and request history. Laritor adds a dedicated journey across requests from a particular session.
Pennant insights
Record Pennant evaluations automatically and inspect activation rates, durations, and related errors.
LaraOwl captures Laravel Context, which can hold feature decisions you add. Dedicated automatic Pennant collection and performance views are not listed.
Queue performance
Compare dispatch delay, worker wait, and execution duration. Find whether the code is slow or work is waiting for a worker.
LaraOwl already monitors job attempts, failures, and processing time. A comparable dedicated queue wait time view is not listed.
Custom events
Record named business milestones and debugging information. Browse them in timelines, a dedicated resource, and dashboards.
LaraOwl supports Context metadata and logs. Laritor adds dedicated browsing and analytics for named custom events.
Performance in context
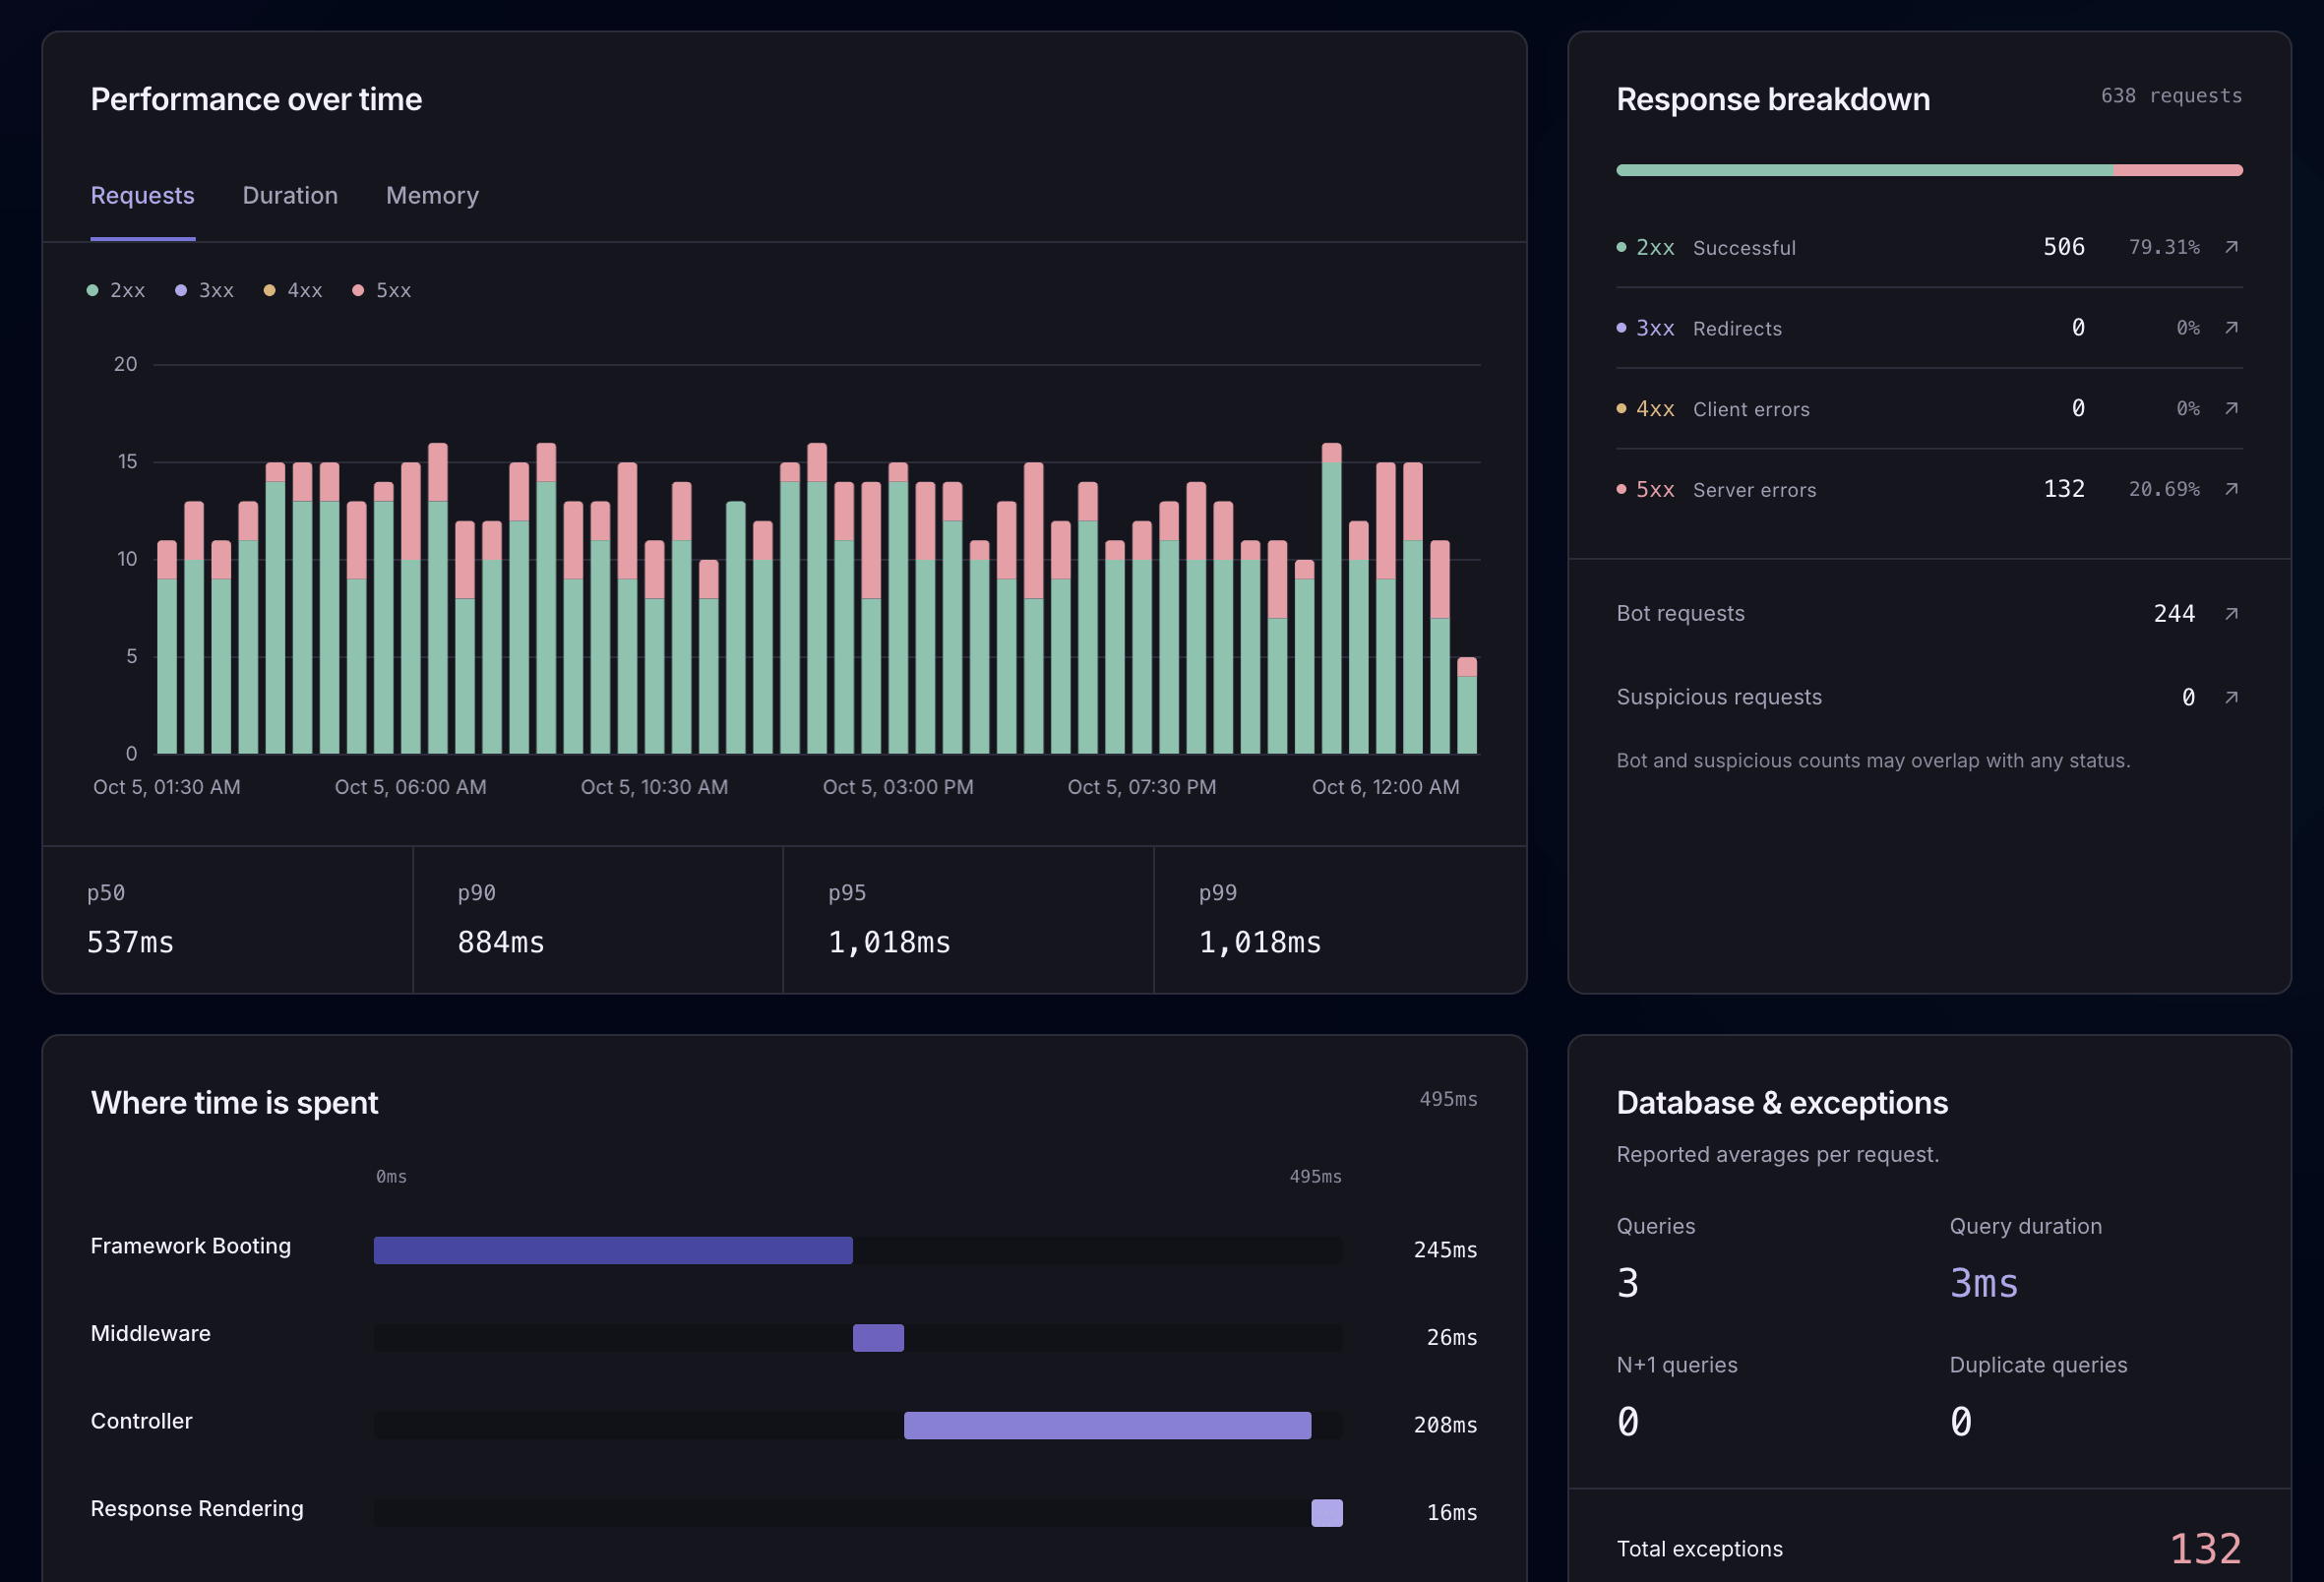
Review request volume, status codes, duration percentiles, and where time is spent. Open a retained request to inspect its queries, logs, API calls, and other recorded events. Explore request monitoring
Receive regular performance snapshots without opening the dashboard.
Custom daily and weekly reports
Choose the metrics and schedule for a PDF application report. Receive it by email and share the snapshot with teammates.
LaraOwl offers real-time project dashboards and alerts. Built-in custom scheduled PDF performance reports are not listed.
Evaluate Laritor in your app
Use a representative app or environment to compare the details you receive, recording volume, and debugging workflow.
Create a Laritor account, install the Composer package, add your ingest endpoint and key, and run the sync command.
composer require binarybuilds/laritor-clientStart with exception tracker, issue tracker, or full observability. Register the generated filter, then review the data and privacy settings for your app.
Configure recording filtersInspect a known exception or slow execution, test alert delivery, and compare measured overhead and billable event usage. If you run both tools, include their combined collection work in your evaluation.
Explore exception investigationCreate your dashboards, choose alert channels, schedule reports, and connect AI. Keep access to your LaraOwl instance or database while Laritor builds a new record of your application’s activity. There is no documented automatic history import.
Explore Laritor guidesQuestions before switching
Laritor tracks exceptions, detects issues, and monitors Laravel performance through a hosted service. It combines recorded execution context with custom dashboards, session journeys, feature flag insights, server resources, reports, in-app AI, and MCP. Choose it when you want dedicated Laravel views without operating a monitoring server.
Both are Laravel native and offer exception tracking, performance monitoring, issue workflows, alerts, and MCP. Laritor manages ingestion, storage, and the dashboard. LaraOwl is free open-source software that you self-host, with additional threat analysis, Cloudflare controls, uptime monitoring, and heartbeat checks. Laritor adds custom dashboards, session journeys, automatic Pennant insights, in-app AI, and PDF reports.
Yes. Both are designed primarily for Laravel applications. LaraOwl uses its laraowl/client Composer package to send telemetry to a server you operate. Laritor uses its Laravel client with managed hosted ingestion. Laravel native describes their focus and does not imply either is an official Laravel service.
LaraOwl’s server is Apache 2.0 open-source software with no per-seat or per-event license fee. You still provide the application server, database, background services, backups, and maintenance. Its documentation does not publish a hosting price or event-volume sizing benchmark. The calculator compares its $0 software license with Laritor’s event-based subscription and labels hosting costs as separate.
LaraOwl needs a web application server, a production relational database, queue workers, a scheduler, and Reverb for live dashboard updates. Redis is strongly recommended. It offers Docker and Composer installation. Laritor manages its monitoring services; you install and configure the client in your Laravel application.
LaraOwl has a $0 software license and no event-based license overage, with your own hosting and operating costs. Laritor starts at $20/month for 20M billable events, unlimited apps and users, managed monitoring storage, and 30-day retention. Additional Laritor events cost $0.20 per started 100K block. The calculator uses one retained workload and average billable events per run.
No. LaraOwl requires more than PostgreSQL: its application, workers, scheduler, and live dashboard services also need hosting. The reviewed documentation provides no workload sizing benchmark or published hosting tariff. The calculator shows its software license separately; running costs depend on your workload, database, hosting provider, and deployment.
LaraOwl is designed for full self-hosting, including its dashboard, ingestion API, database, and MCP server. You can inspect and modify its Apache 2.0 server code. Laritor is a hosted monitoring service with client-side collection and privacy controls.
Laritor’s published paid plan includes 30-day retention. LaraOwl provides per-project retention settings through 90 days or no automatic deletion, and you can query your own database. Longer retention increases the storage, backup, and maintenance capacity you need to operate.
Yes. Laritor provides hosted read-only exception details and recorded execution context through MCP, plus in-app AI recommendations with provider choices. LaraOwl provides a self-hosted, team-scoped MCP endpoint for projects, issues, and telemetry, including tools to change issue status and add comments.
Yes. LaraOwl analyzes common attack patterns with risk scores and IP threat timelines. Its optional Cloudflare integration manages firewall rules and IP blocking from the dashboard. Laritor offers bot and suspicious traffic performance views. Recording and investigating suspicious traffic differs from enforcing Cloudflare firewall rules.
The reviewed client records request headers and can capture request payloads when enabled, limited to HTTP 500 responses. It records response status and size but not response bodies. Its outgoing HTTP sensor records timing, status, and sizes without outgoing headers or bodies. Laritor supports optional request and response content capture, including outbound API context.
Yes. Laritor has exceptions-only and issues-only filters that retain related recorded events when a matching problem occurs. Full observability retains all configured activity. LaraOwl supports sampling and client collection controls; equivalent named exception and issue recording presets are not listed in its current configuration.
The calculator shows “Ask for a quote” when Laritor’s estimated monthly subscription exceeds $500. Exactly $500 stays numeric. LaraOwl’s software license remains $0 at every volume; its infrastructure capacity and operating costs are separate.
Yes. Configure Laritor alongside LaraOwl in a representative app or environment. Compare the details collected, alerts, retained event volume, infrastructure requirements, and combined collection overhead before deciding which workflow fits your team.
Laritor records new activity after installation. There is no documented automatic import of LaraOwl history. Keep access to your existing LaraOwl instance or database while Laritor builds a new monitoring record.
About this comparison
Published by Laritor, independently of LaraOwl. LaraOwl’s official documentation, server source, client source, Apache 2.0 license, MCP tools, and recorded payload fields were reviewed on . The comparison acknowledges its Laravel native design, related execution views, user history, issue workflows, security analysis, uptime checks, and alert channels.
“Not listed” means a dedicated feature was not found in the public material reviewed. Custom code can provide another way to meet that need. Incoming payload limits, missing outbound bodies, missing query bindings, and command output are checked against the current client sensors. The calculator compares Laritor’s hosted monthly USD subscription before tax with LaraOwl’s $0 software license. LaraOwl server hosting, database capacity, background services, backups, maintenance, and setup are separate. Hosting costs depend on the chosen deployment. A hosting price or event-to-capacity benchmark is not published in the reviewed documentation. Trials and custom contracts are excluded.
Start with the data you need
Track exceptions, detect issues, and monitor performance.
Try Laritor with 300K events free.