
Traffic and response times
Compare recorded request counts and average duration. Use p90 and p95 to look beyond the average when some responses are much slower.
Laravel route monitoring
Laritor is a performance monitoring and issue tracking tool for Laravel. Compare traffic, response times, HTTP errors, and memory use across your routes. Find a slow or failing endpoint, then open its requests to inspect the queries, API calls, logs, and exceptions behind the problem.
Free trial: 300K events · Unlimited apps and users
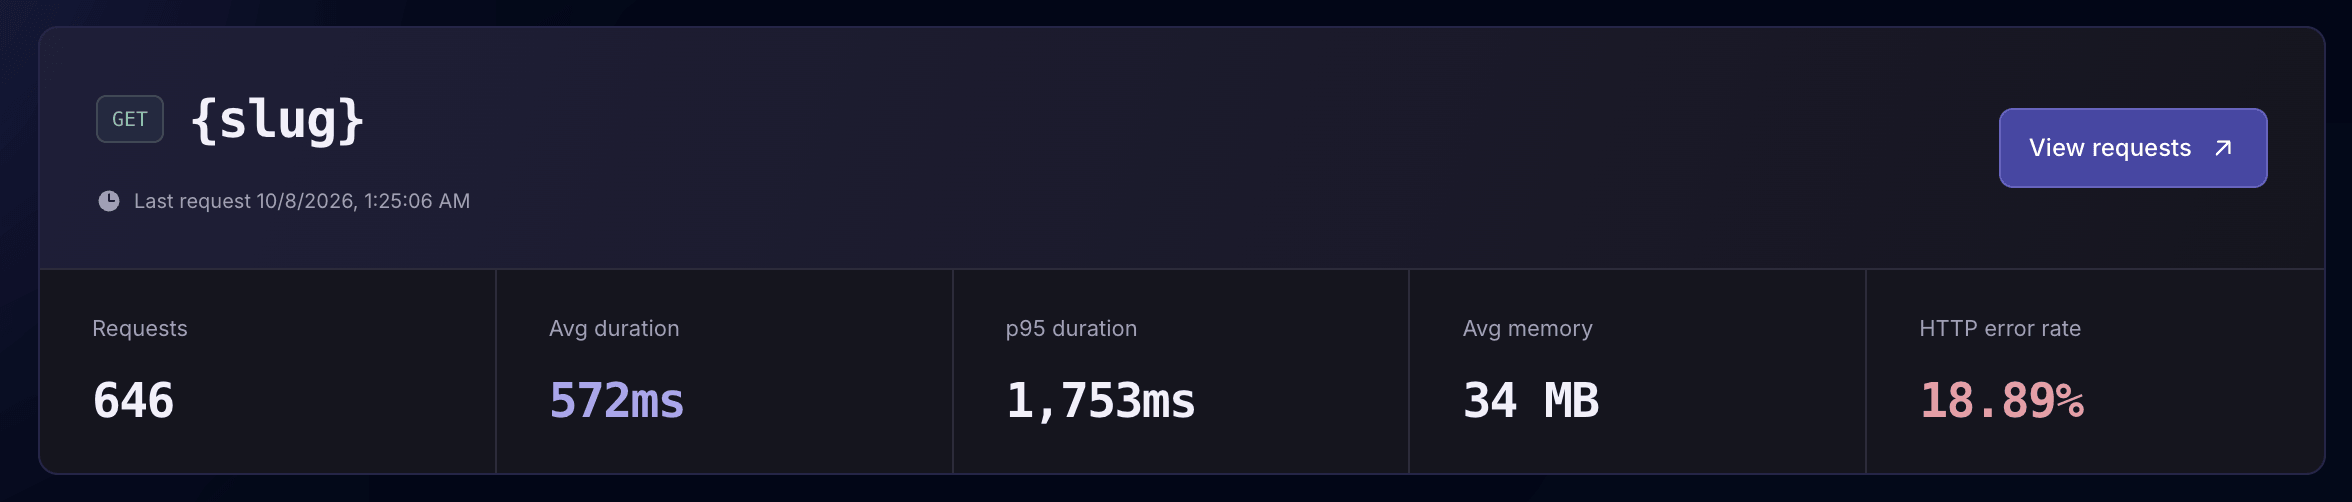
Compare your endpointsTraffic, duration, memory, and errors.
Follow performance changesRequest and response trends over time.
Inspect the causeOpen the affected request timeline.
Compare recorded request counts and average duration. Use p90 and p95 to look beyond the average when some responses are much slower.
See the share of recorded requests returning 4xx or 5xx responses. Open the affected requests to investigate why they failed.
Compare average recorded memory for each route. Inspect individual requests to understand differences in the work they perform.
Compare routes in your Laravel app
A route groups requests for an endpoint pattern and HTTP method. For example, different product IDs can match GET /products/{id}, so you can review the endpoint’s behavior together.
Search routes, select a period, and compare recorded request counts, response categories, average duration, p90, p95, memory, and last seen activity. Sort by the metric that matters to your investigation.
Explore request grouping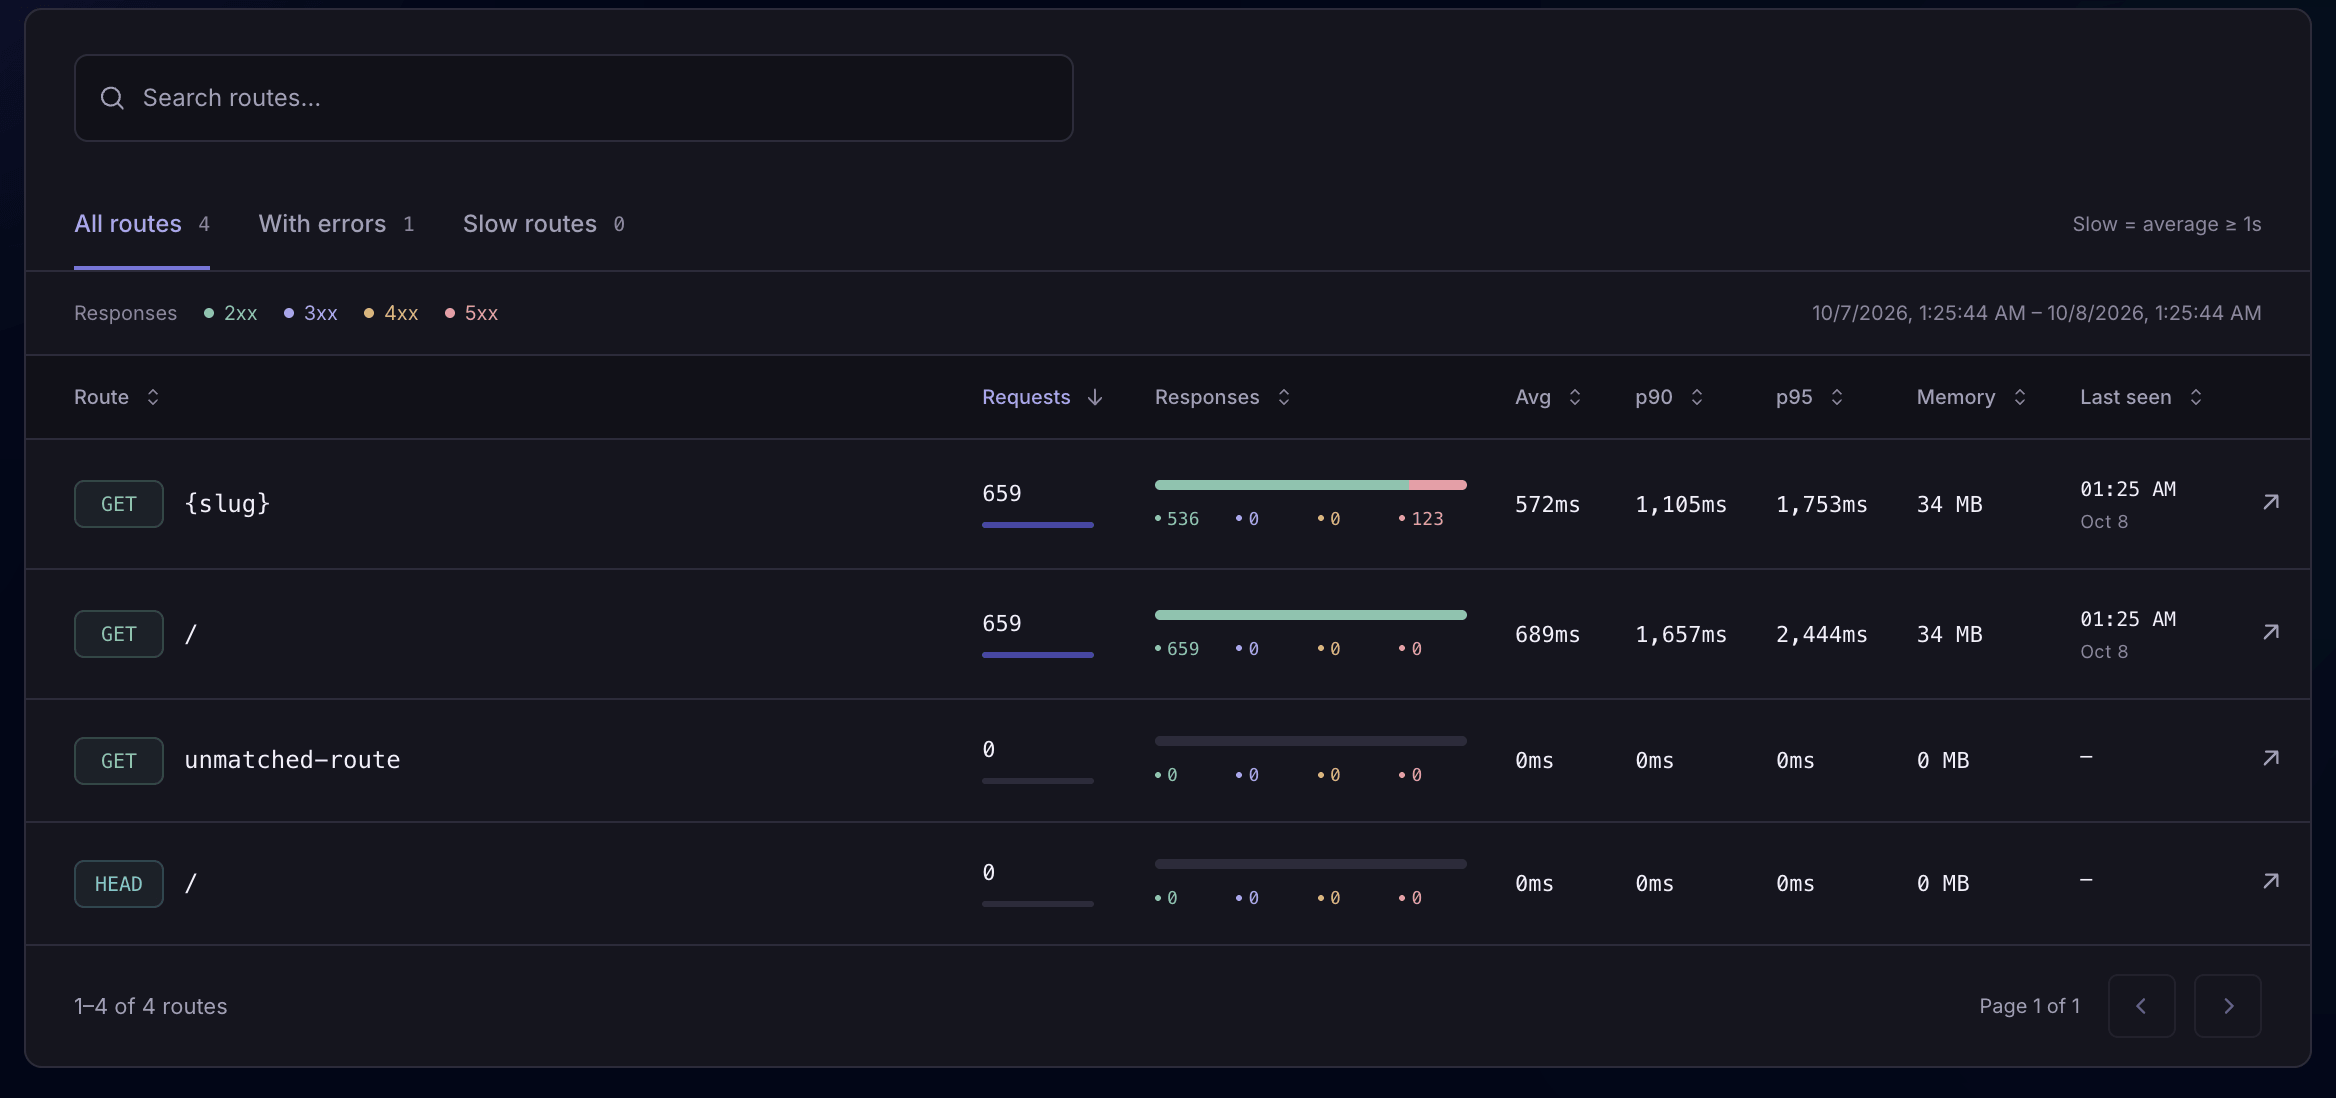
Sort by Requests to see where recorded traffic is concentrated. Compare volume with response times before choosing an optimization.
Use With errors to focus on routes with recorded 4xx or 5xx responses. Check the response breakdown and open relevant requests.
The current Slow routes filter selects routes with an average duration of at least one second. Also review p90 and p95 to find slower responses on other routes.
Last seen means the latest recorded request for that route in the selected period. A route with no recorded requests is not evidence that nobody visited it.
Route performance over time
Open a route and choose a time window. Use its performance charts to follow traffic, response times, and request memory rather than relying on one summary value.
The Requests view separates status categories per interval. The Duration and Memory views help you compare how the recorded workload changes over time.
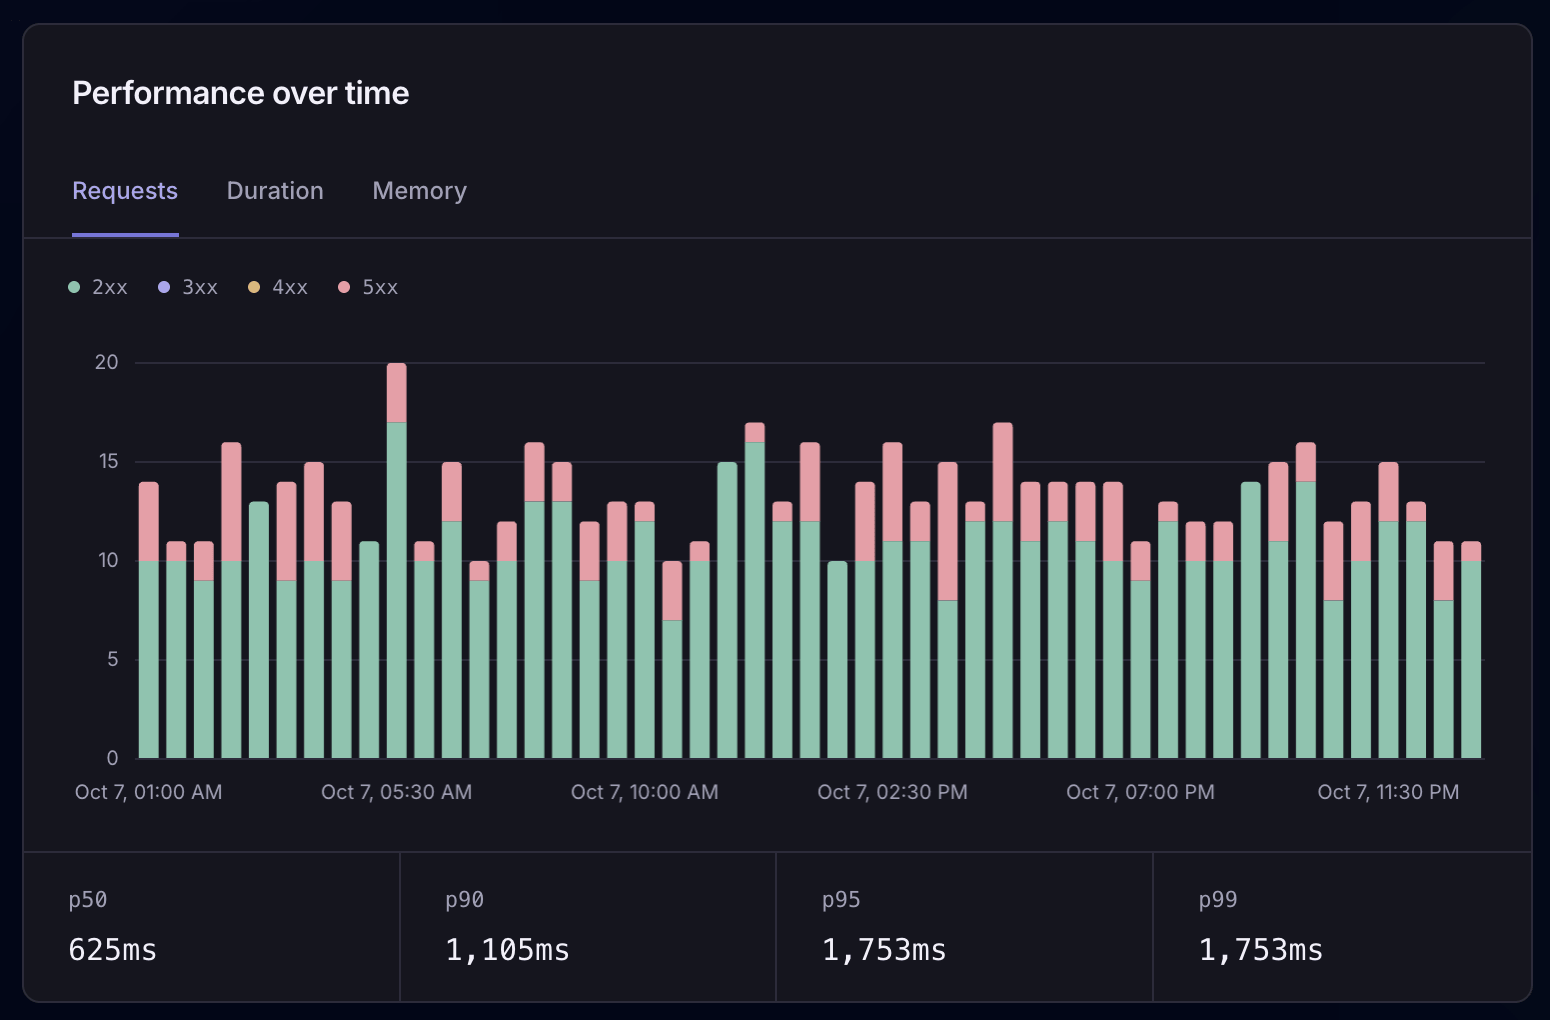
Follow recorded traffic per interval, split into 2xx, 3xx, 4xx, and 5xx responses. Find when failures started or increased.
Compare average duration with p50, p90, p95, and p99 over time. Focus on the periods where the route’s responses slowed down.
Review average recorded request memory over time. Compare changes with the workload and relevant deployments.
Compare the same time window and similar workloads when checking an improvement. Averages can hide slower responses, and summaries built from stored intervals can report the highest interval percentile.
Response breakdown and traffic classifications
See how the route’s recorded responses split across status categories. Follow a category to matching requests to investigate what returned that status.
Open bot or suspicious request activity for the same route to inspect actual URLs, IP addresses, and user agents. Use those details to improve rate limits or filtering in your Laravel app or firewall.
Bot and suspicious counts can overlap with any HTTP status and with each other. They are not additional response categories to add to the total. Laritor helps you investigate this traffic; blocking rules are applied in your app or infrastructure.
Explore request and bot traffic monitoring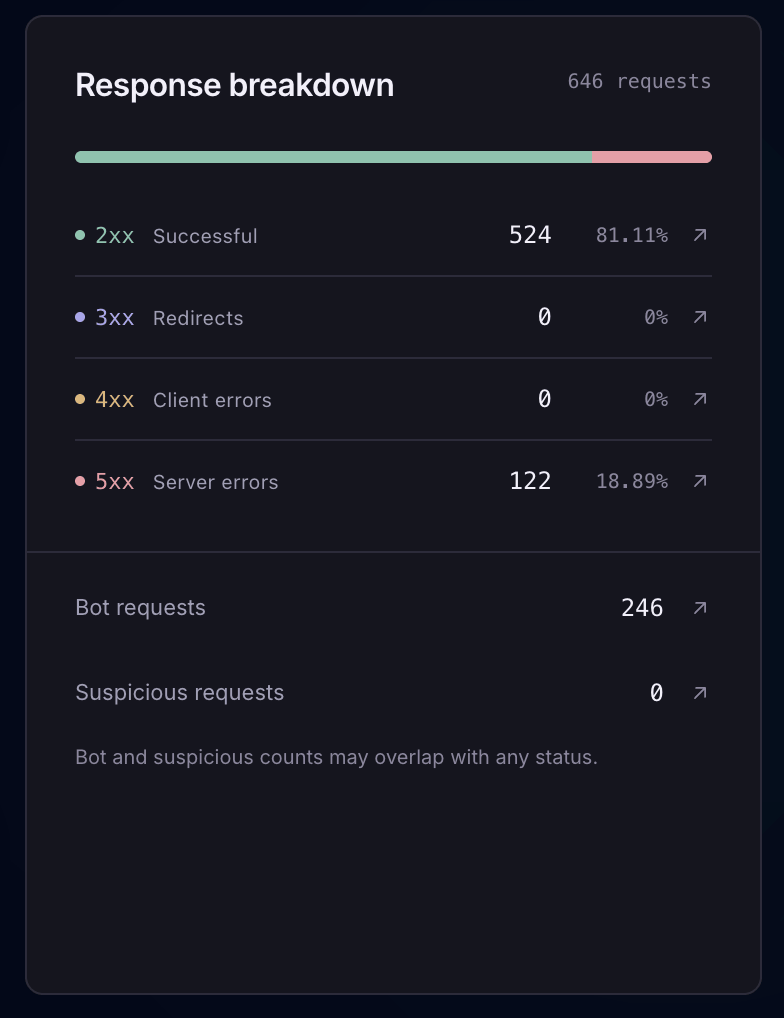
Average Laravel execution phases
Compare average time spent in framework booting, middleware, controller work, and response rendering. Use the breakdown to choose which stage needs a closer look.
Then open individual requests to inspect the queries, external calls, and other work inside that execution. Phase averages show the route’s pattern; the request timeline supplies the detail.
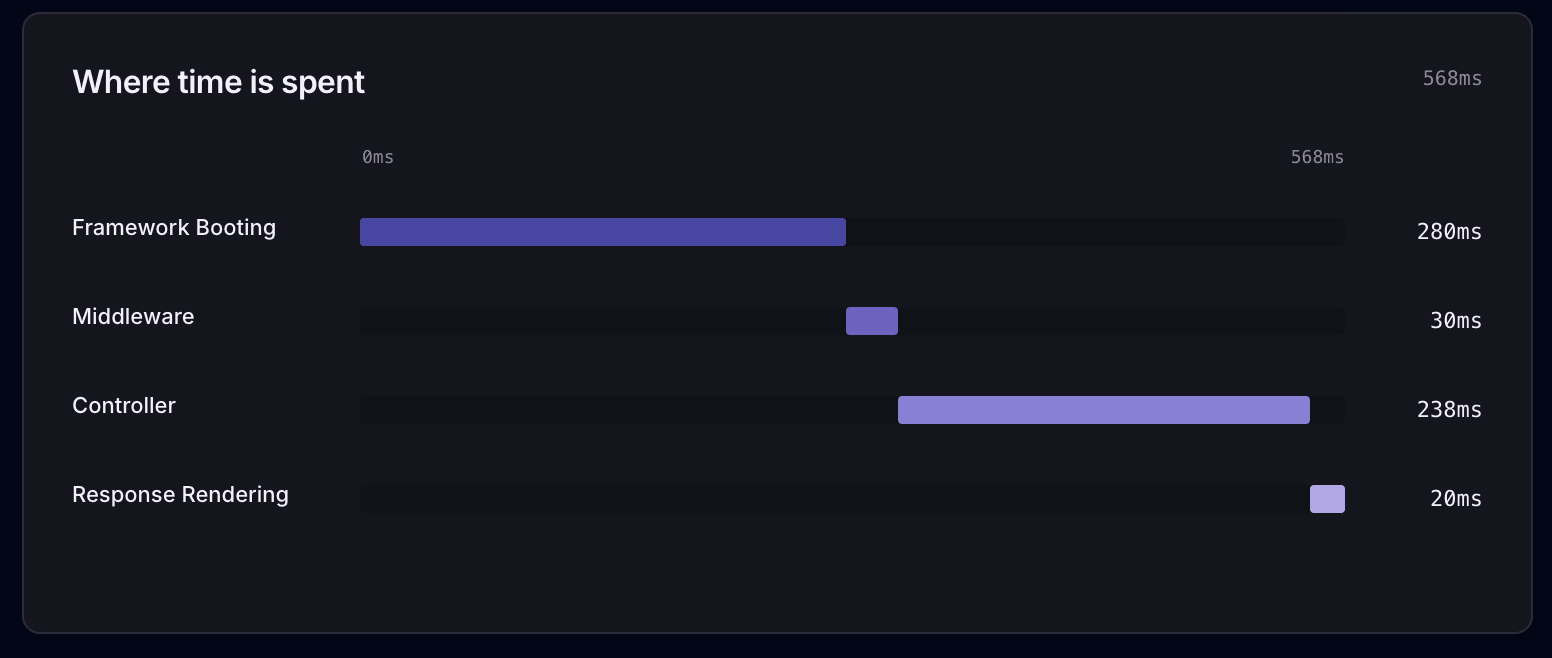
Time spent starting Laravel for the recorded requests.
Time spent passing through request middleware.
Time spent in the route’s controller work.
Time spent preparing the response for the client.
The sum of recorded phase averages can differ from end-to-end average duration. Use the route breakdown to guide an investigation rather than treating it as one request’s exact timeline.
From a route summary to a recorded request
Use View requests or a response-category link on the route. Keep the selected period, filter to the activity you want, and open an affected request.
Inspect its ordered events to understand which query, API call, cache operation, or code path needs attention. For exceptions, read the recorded error and stack trace alongside the work that preceded it.
Explore request timelines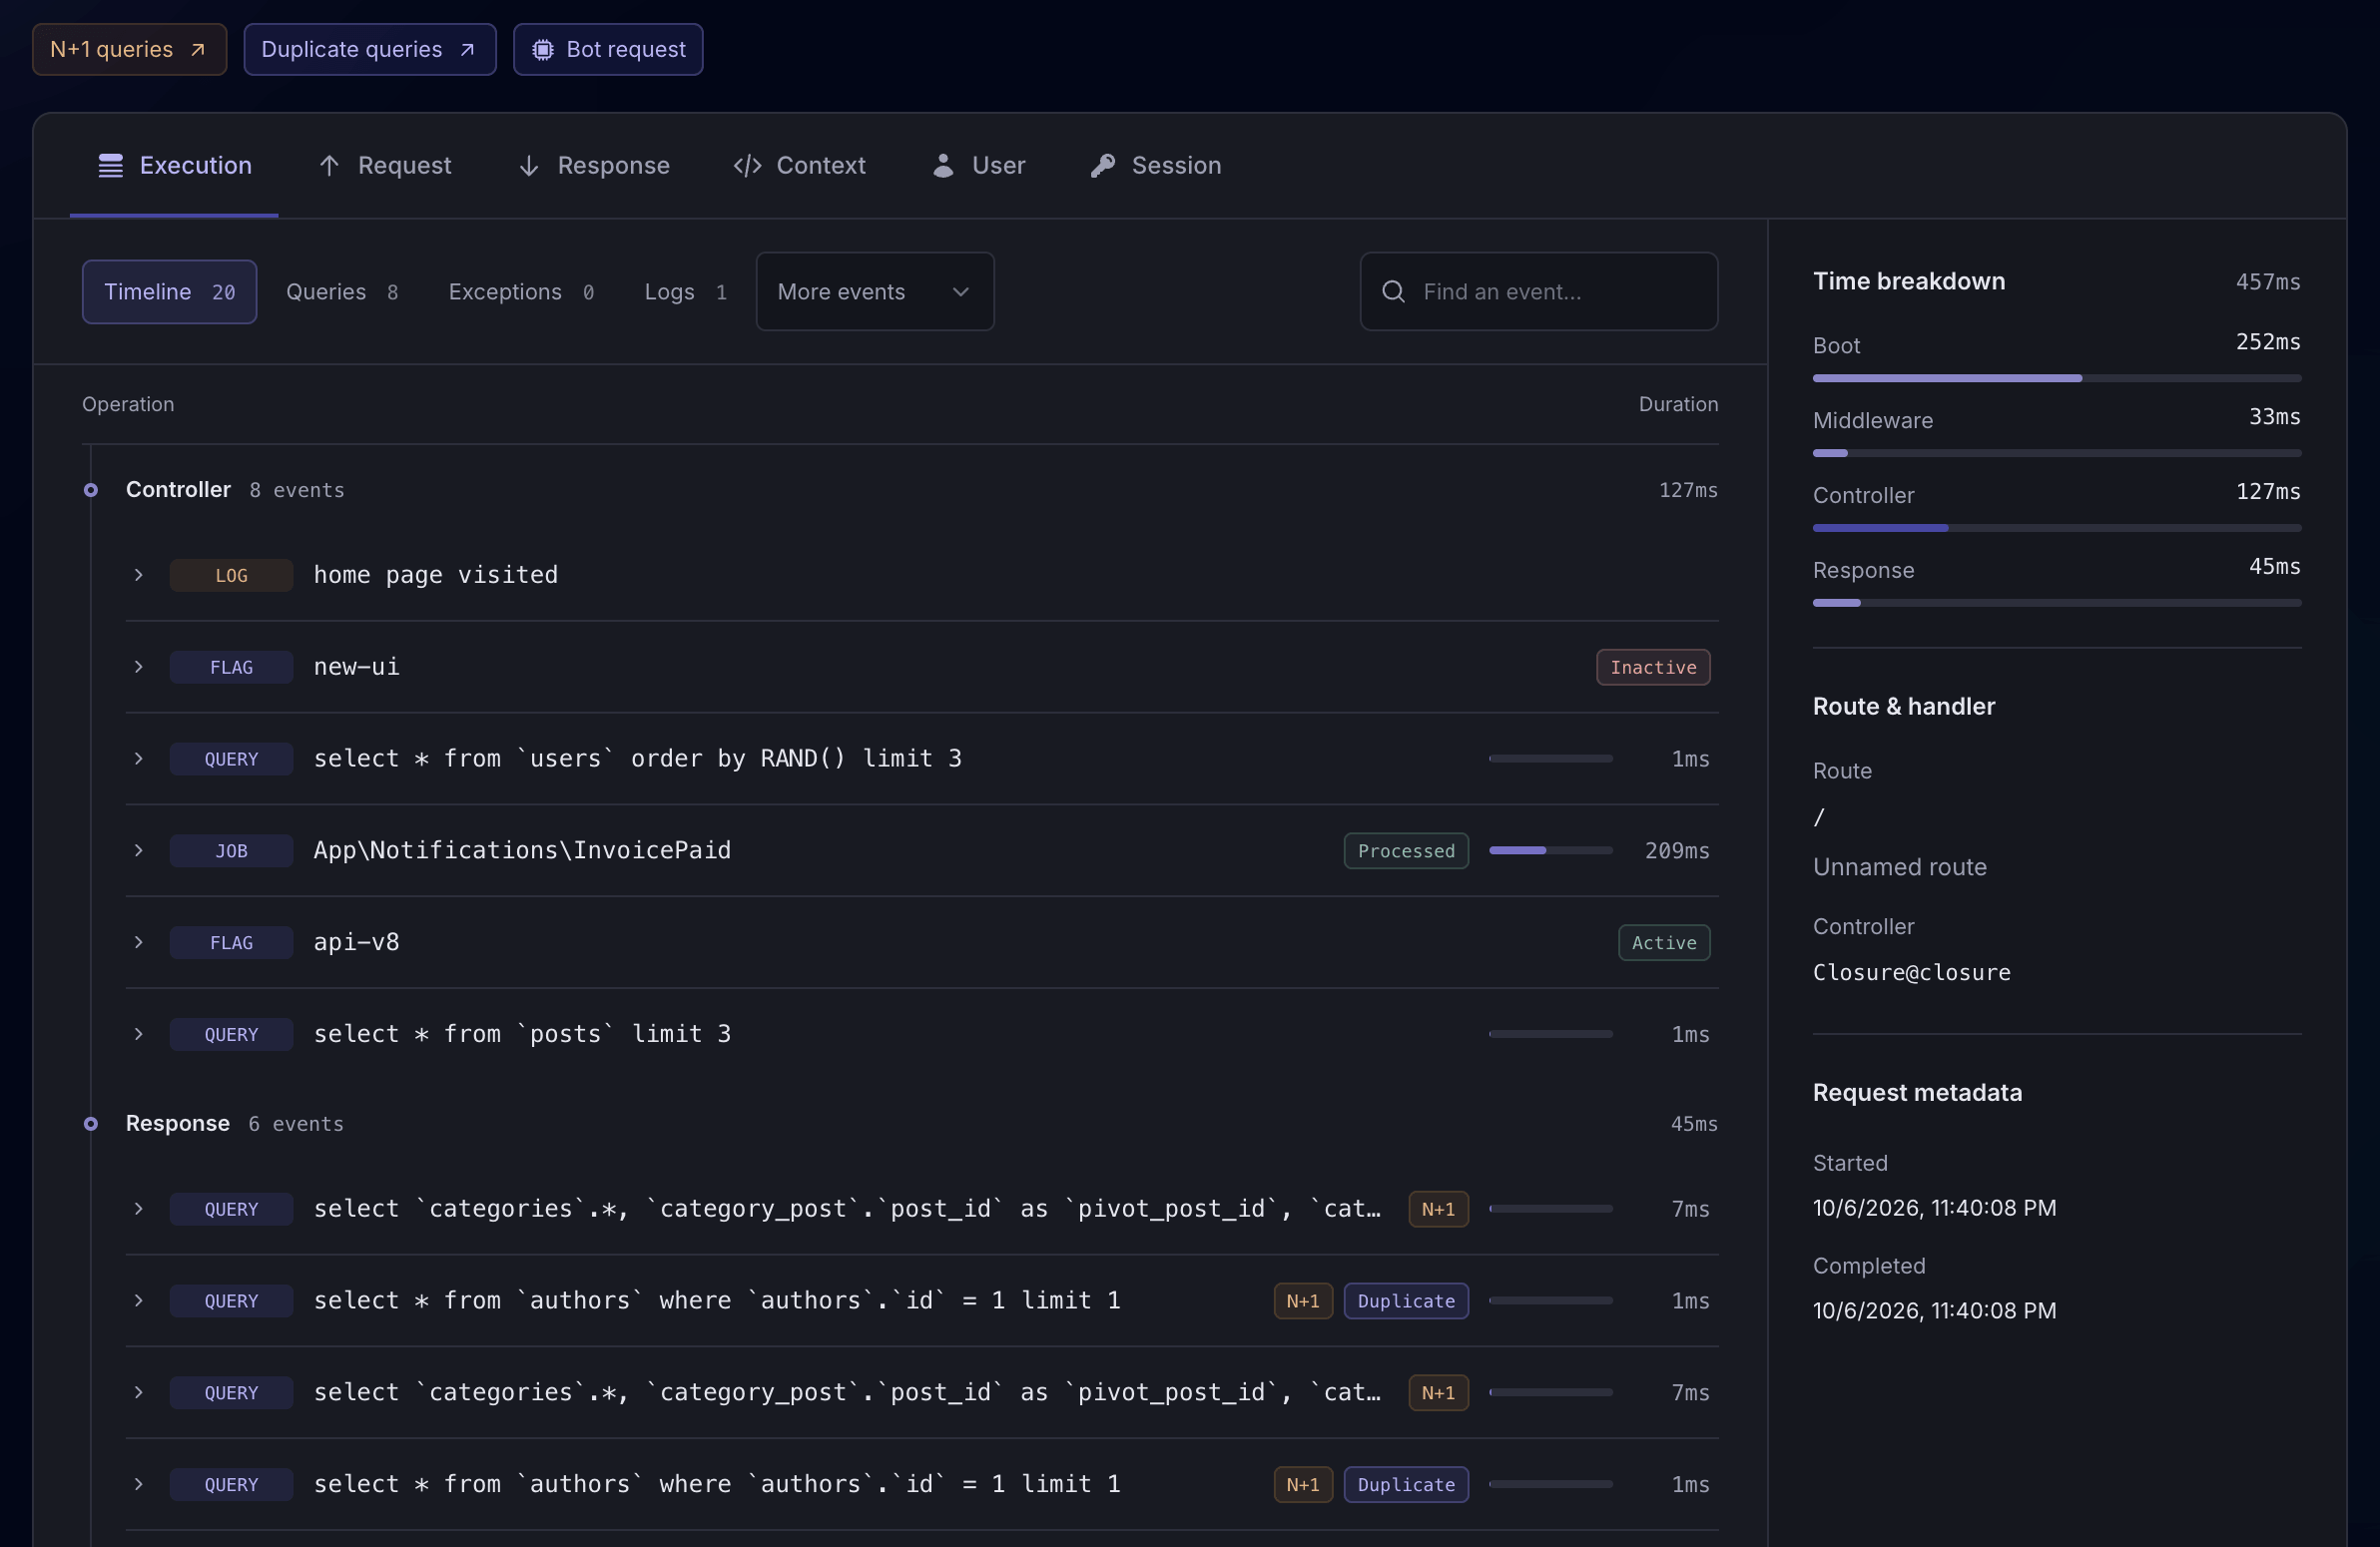
Use Laritor’s in-app AI recommendations for a recorded request to help investigate slow work and plan an optimization. Review the suggestion against your code and test the change.
Set up in-app AIConnect through Laritor MCP to retrieve the exception and its recorded execution timeline. Your coding agent can use those events with your repository to understand the failure and work on a fix.
Connect Laritor MCPA practical endpoint investigation
Start with the endpoint where users are seeing a problem or where performance needs work. Use the route summary to find the relevant period and requests.
After a change, review new recorded activity to see how the endpoint behaves under a comparable workload.
Find an endpoint with high duration or HTTP errors. Select the time window you want to investigate and compare its traffic and response breakdown.
Use View requests or a response category to open matching activity. Filter by duration, status, or other details, then inspect the request timeline.
Use the recorded queries, API calls, logs, and exceptions to improve the code or configuration. Test again and compare new requests in a similar time window.
Use Laritor how you want
Keep requests with exceptions, requests with detected issues, or successful activity too. Each retained request includes its related recorded events.
Route counts, durations, and HTTP error rates reflect the requests you send. Filtered modes can overrepresent failures and slow activity, so they do not describe all application traffic.
Record a request and its related events when it contains an exception. Use route context to investigate endpoints affected by captured failures.
Focus on exception debugging.
Record requests with detected issues, including slow or failed requests, together with their events. Focus on endpoints that need attention.
Keep activity around application problems.
Record successful requests too. Compare endpoint traffic, routine response times, and failures with a broader view of route activity.
Use this for broader endpoint performance trends.
An HTTP 4xx or 5xx response does not necessarily contain an exception. Choose the mode that retains the activity you want to investigate. Paid plans start at $20/month with 20M events included. Estimate your usage
Request filtering and privacy controls
Request URLs, headers, user context, and related events can contain sensitive information. Laritor applies redaction before recorded data leaves your application, and you can customize what is sent.
Keep the details needed to investigate performance while removing or anonymizing private values.
Explore privacy controlsUse recordRequest to exclude unwanted request activity, such as routine endpoints your team does not need to inspect.
Review query parameter, header, body, session, and response recording overrides. Request and response bodies are disabled by default.
Explore request recording controlsCustomize profile, email-address, IP-address, string, and structured-value redactors for the information recorded with requests.
Laravel route monitoring questions
Answers about endpoint grouping, slow routes, percentiles, response categories, traffic, and recording modes.
Laravel route monitoring groups recorded requests by their route so you can compare endpoint traffic, response times, memory, and HTTP errors. Laritor is a Laravel performance monitoring and issue tracking tool that helps you identify routes needing attention and open their requests to inspect the related execution events.
A route describes the endpoint pattern and HTTP method, such as GET /products/{id}. Individual requests can contain different parameter values while matching the same route. Laritor’s route views help you compare the endpoint as a group, then open individual requests for the actual URL and execution details. Different HTTP methods can appear separately.
Compare average duration and p90 or p95 in the route list, or sort by those columns. The current Slow routes filter selects routes whose recorded average duration is at least one second. A route with a lower average can still have slow individual responses, so inspect its percentiles, duration trend, and matching requests too.
A percentile describes where a duration falls within a set of recorded responses. p95 helps you see slower responses that an average can hide. Charts show values for each time interval; summaries built from stored intervals can show the highest interval percentile rather than one exact percentile across all requests. Use the same time window and inspect individual requests when investigating a change.
The HTTP error rate is the number of recorded 4xx and 5xx responses divided by recorded requests for the route in the selected period. The response breakdown separates 2xx successes, 3xx redirects, 4xx client errors, and 5xx server errors. An HTTP error response does not necessarily mean an exception was thrown.
Yes. Open the route and use View requests, or follow a response category such as 4xx or 5xx to matching requests in the selected period. Open an affected request to inspect its status, duration, queries, outbound requests, logs, exceptions, and other events recorded with that execution.
Yes. The route response breakdown includes bot and suspicious request counts with links to matching activity. These classifications can overlap with any HTTP status and with each other, so they are not extra response categories to add to the request total. Inspect URLs, IP addresses, and user agents to inform filtering or rate-limiting rules in your application or firewall.
Yes. The route timing view shows recorded average time in framework booting, middleware, controller work, and response rendering. Use it to choose which stage to inspect, then open individual request timelines for the events inside that work. The sum of phase averages can differ from the end-to-end average duration.
They reflect the requests Laritor records. Exceptions-only and issue tracker modes retain selected problematic occurrences, while full observability also records successful activity. Filters and limits affect the available data. Filtered route counts, durations, and HTTP error rates should not be treated as measurements of all application traffic.
Install and configure the Laritor Laravel client to record supported requests and their route context. You do not need a separate custom event call for every route. Choose a recording mode, review request filters and privacy settings, and open Routes in Laritor to inspect the available activity. Custom events can add application-specific milestones when useful.
Install in under 1 minute
Add Laritor’s Laravel client, choose a recording mode, and compare your endpoints with the execution context needed to investigate them.
Free trial: 300K events · Unlimited apps and users