
Laritor
Yes
Laritor vs Rollbar
Laritor tracks exceptions, detects issues, and monitors Laravel performance. Inspect requests, jobs, queries, API calls, logs, and user sessions in one place. Choose what to record, give your team full access, and debug with in-app AI or your coding agent through MCP.
Published by Laritor · Comparison checked · View comparison notes
Designed primarily for Laravel. All tools compared here support Laravel.
Yes
No
Why choose Laritor over Rollbar?
Rollbar helps you find and fix reported errors. Laritor also helps you understand slow requests, busy queues, database queries, bot traffic, and server resources. Start with exceptions, record detected issues, or monitor all configured activity through dedicated Laravel views.
The full feature comparison
Compare 40 capabilities. See where Laritor gives you more, where Rollbar has an advantage, and what both tools offer.
“Not listed” means an equivalent dedicated feature was not found in the public documentation reviewed. Custom telemetry or integrations may cover that need. Rollbar already supports Laravel errors, PHP telemetry, custom fields, request bodies, session context, browser replay, MCP, and built-in AI. Those features are compared separately from Laritor’s dedicated performance and application-resource views.
Laravel performance, recording modes, queues, queries, payloads, Pennant, backend sessions, custom dashboards, and PDF reports.
| Capability | Laritor | Rollbar |
|---|---|---|
| Three recording modes | Choose what to record Record exceptions, detected issues, or all activity. Retained executions include their related configured events. | Error/message reporting, sampling, and PHP telemetry. Equivalent whole-execution Laravel issue and full-activity presets are not listed. |
| Laravel performance monitoring | Monitor beyond exceptions Request duration percentiles, lifecycle timing, response codes, and related execution events. | Error frequency, impact, and occurrence context. A dedicated Laravel request-performance workspace is not listed. |
| Slow requests and failed execution issues | Find problems before an exception Detect slow or failed requests and jobs through a dedicated Issues workspace. | Items group reported errors or messages. Automatic Laravel slow-execution issue detection is not listed. |
| Queue performance and throughput | Understand busy queues Inspect wait time, execution duration, throughput, job payloads, and related events. | Report job exceptions and attach custom context. A dedicated Laravel queue-performance resource is not listed. |
| Scheduled task execution views | Investigate scheduled runs Inspect recorded scheduled runs, timing, failures, and related events. | Errors can be reported from scheduled code. Dedicated Laravel scheduled-run monitoring is not listed. |
| Command output | Read failed command output Retain configured command output beside timing, queries, logs, and exceptions. | PHP errors and custom occurrence fields. Automatic Artisan output capture is not listed. |
| Query performance and N+1 investigation | Find slow database work Review query timing, repeated queries, SQL context, and the request or job involved. | PHP telemetry and custom diagnostic data. Dedicated query-performance and N+1 views are not listed. |
| Outbound API request and response content | Inspect failing API calls Optional outgoing headers, payloads, response content, status, and duration with privacy controls. | Custom occurrence data and PHP breadcrumbs. Equivalent automatic Laravel outbound-body capture is not listed. |
| Response bodies and successful request context | Inspect the response Optional request and response content on retained requests, including successful executions. | Request data and optional raw PHP request bodies on reports. Automatic Laravel response-body capture is not listed. |
| Dedicated Laravel log investigation | Read logs in context Inspect retained logs by context and severity, linked to execution events. | Report log messages as occurrences and include PHP telemetry. A separate Laravel log resource is not listed. |
| Cache operation insights | Understand cache behavior Inspect recorded cache operations, timing, keys, and related application activity. | Custom occurrence fields or telemetry can carry cache context. A dedicated cache-performance resource is not listed. |
| Mail and notification execution views | Investigate delivery work Dedicated recorded mail and notification details, timing, failures, and related events. | Capture errors and attach custom diagnostic context. Equivalent Laravel mail/notification resources are not listed. |
| Laravel Pennant insights | Understand feature rollouts Inspect feature evaluations, activation, timing, and related errors. | Custom fields can carry flag state. An automatic Pennant-performance resource is not listed. |
| Custom application health checks | Check application dependencies Define Laravel checks for application dependencies and inspect recorded results. | Error alerts and custom reports. A dedicated Laravel dependency health-check resource is not listed. |
| Server CPU, memory, and disk metrics | Check server resources Optional server resource collection linked to application investigations. | Server context in error reports. Infrastructure CPU, memory, and disk monitoring is not listed. |
| Database schema explorer | Debug with database context Browse schema, indexes, columns, and relationships with AI assistance. | Stack traces, occurrence fields, and code context. A database schema explorer is not listed. |
| Backend session request journeys | Follow backend activity Follow retained Laravel requests, users, and custom events across a session. | Session metadata and browser replay correlation. A dedicated journey of Laravel backend executions is not listed. |
| Laravel dashboards with 85+ widgets | Build your team’s views Unlimited custom dashboards built from 85+ Laravel widgets. | Personalizable dashboard cards, saved views, and Analyze APIs. An equivalent Laravel widget builder is not listed. |
| Scheduled daily and weekly PDF reports | Stay informed by email Receive custom performance snapshots by email and share PDFs with teammates. | Analyze supports reports through RQL and APIs. Built-in scheduled Laravel performance PDFs are not listed. |
| Bot traffic and suspicious request views | Understand traffic quality Inspect bot traffic, suspicious requests, and their impact on Laravel performance. | PHP ignore callbacks can filter bot errors. Dedicated bot traffic and performance views are not listed. |
| In-app AI provider choice | Choose your debugging workflow Choose supported providers and models for in-app recommendations, or use your agent through MCP. | Built-in Resolve uses its configured AI workflow and credits; MCP works with your chosen agent. Equivalent in-app provider selection is not listed. |
| Dedicated custom event views | Track business milestones Inspect named business milestones and metadata within retained Laravel execution journeys. | Custom fields, messages, and PHP telemetry events. An equivalent standalone Laravel custom-event resource is not listed. |
Multi-language errors, visual browser replay, Resolve pull requests, deploy history, adaptive alerts, RQL analytics, longer paid retention, and enterprise options.
| Capability | Laritor | Rollbar |
|---|---|---|
| Browser and multi-language error monitoring | Designed for server-side Laravel application activity. | Supported SDKs cover browser, mobile, PHP, and other backend languages. |
| Visual browser session replay | Backend request journeys. Visual browser replay is not listed. | Browser SDK records user interactions with masking and blocking controls; each account includes 1,000 free monthly replays. |
| Automated AI fix pull requests | In-app recommendations and exception context for your own AI agent through MCP. | Resolve open beta investigates errors, changes code in a sandbox, runs configured checks, and opens a GitHub PR. Requires GitHub setup and a credit subscription. |
| Release and deployment investigation | Application performance, failures, and retained execution context. | CI/CD-reported deploy history, code versions, and error association help identify release regressions. |
| Adaptive exception-rate alerts | Configured application issue detection and alert channels. | Advanced and Enterprise can learn exception-rate baselines and alert on anomalies. |
| SQL-like error analytics | Laravel metrics, filters, custom events, and dashboards. | Analyze offers RQL queries and a Metrics API over occurrence history. Included on Advanced; an add-on on Essentials. |
| Longer paid error retention | 30-day recorded event retention. | Paid maximum retention is up to 90 days on Essentials and 180 days on Advanced, with account settings. |
| Enterprise identity and compliance options | Laravel monitoring with client-side privacy and collection controls; equivalent enterprise controls are not claimed here. | Documented SOC 2 certifications and plan-dependent SAML, SCIM, audit, and BAA options. Confirm eligibility with Rollbar. |
Both support Laravel exceptions, stack traces, request and session context, custom PHP breadcrumbs, privacy controls, alerts, unlimited users, and MCP.
| Capability | Laritor | Rollbar |
|---|---|---|
| Laravel exception tracking and grouping | Grouped exceptions, full stack traces, source location, and occurrence history. | Official Laravel error integration with grouped items and repeated occurrence history. |
| Source file and line context | Inspect the source location, full stack trace, and retained execution events. | PHP error stack traces and configurable source context identify where the error occurred. |
| Error alerts and notification channels | Get notified through configured email, chat, incident, and webhook integrations. | Notification rules and integrations deliver new, recurring, and urgent error alerts. |
| User identification and custom metadata | Link authenticated users and additional attributes to application activity. | PHP person fields and custom diagnostic metadata identify affected users and context. |
| Laravel session metadata | Optional session data with client collection and redaction settings. | Laravel integration sends session context with error reports; collection needs privacy review. |
| Request parameters and payload context | Optional request fields and payloads on retained executions. | PHP request context and optional raw request bodies on reported occurrences. |
| PHP telemetry and custom breadcrumbs | Related events and named custom events explain a retained execution. | PHP SDK 4.1+ includes a telemetry timeline and supports custom breadcrumb events. |
| Sensitive data and reporting controls | Client-side redaction, resource settings, filtering, and sampling. | PHP scrubbing, ignore callbacks, sampling, and browser replay privacy controls. |
| AI coding agents through MCP | MCP provides read-only exception details and retained execution context. | Local stdio MCP provides errors, deployments, replay, and permission-controlled item updates. |
| Unlimited apps/projects and users | Unlimited apps and teammates in the paid plan. | Unlimited projects and users across plans; no per-seat billing. |
Major difference
Laritor gives you exception tracking, detected execution issues, and Laravel performance monitoring together. Find slow or failing work and inspect the recorded activity that explains it.
Laritor monitors slow requests, slow queries, queue delays, and other execution issues. Rollbar’s core workflow is centered on reported application errors and their occurrences.
Follow queries, API calls, cache activity, logs, and custom events inside a retained Laravel execution. Rollbar’s error diagnostic context does not replace these dedicated performance resource views.
Laritor adds queue metrics, sessions, Pennant insights, custom dashboards, and scheduled performance PDFs. Rollbar’s error and release workflow leaves broader Laravel performance monitoring to other tools.
Why choose Laritor over Rollbar?
Track exceptions and investigate the slow or failing work around them. Follow requests, queues, queries, API calls, user sessions, and feature flags through Laravel views your team can use every day.
20M billable events, unlimited apps and users, and 30-day retention. Choose exceptions, detected issues, or all activity without a separate error or log quota.
Laritor bills for retained events and Rollbar bills for reported occurrences. Compare the same exception workload below. Laritor can monitor broader application activity too; Rollbar’s lowest paid error plan can cost less at small volumes.
Investigate performance problems even when your app does not throw an exception.
Request performance
Compare response codes, duration percentiles, and lifecycle timing. Open a retained request to inspect its queries, API calls, logs, and other events.
Rollbar focuses on reported errors and their context. Laritor adds dedicated request-performance and issue views, so you can investigate slow successful requests too.
Queue insights
Separate time spent waiting for a worker from time spent executing a job. Review throughput and inspect the payload and related events behind a slow or failed run.
Rollbar can receive exceptions from queue workers. Laritor also shows the queue’s performance, helping you investigate delays before they become failures.
Database and server insights
Inspect query timing, repeated queries, and their execution context. Review CPU, memory, and disk metrics when you enable server collection.
Rollbar supports PHP telemetry and custom diagnostic fields. Dedicated Laravel query, N+1, and infrastructure resource views are not listed in the reviewed guides.
Performance in context
Review request volume, status codes, duration percentiles, and where time is spent. Open a retained request to inspect its queries, logs, API calls, and other recorded events. Explore request monitoring
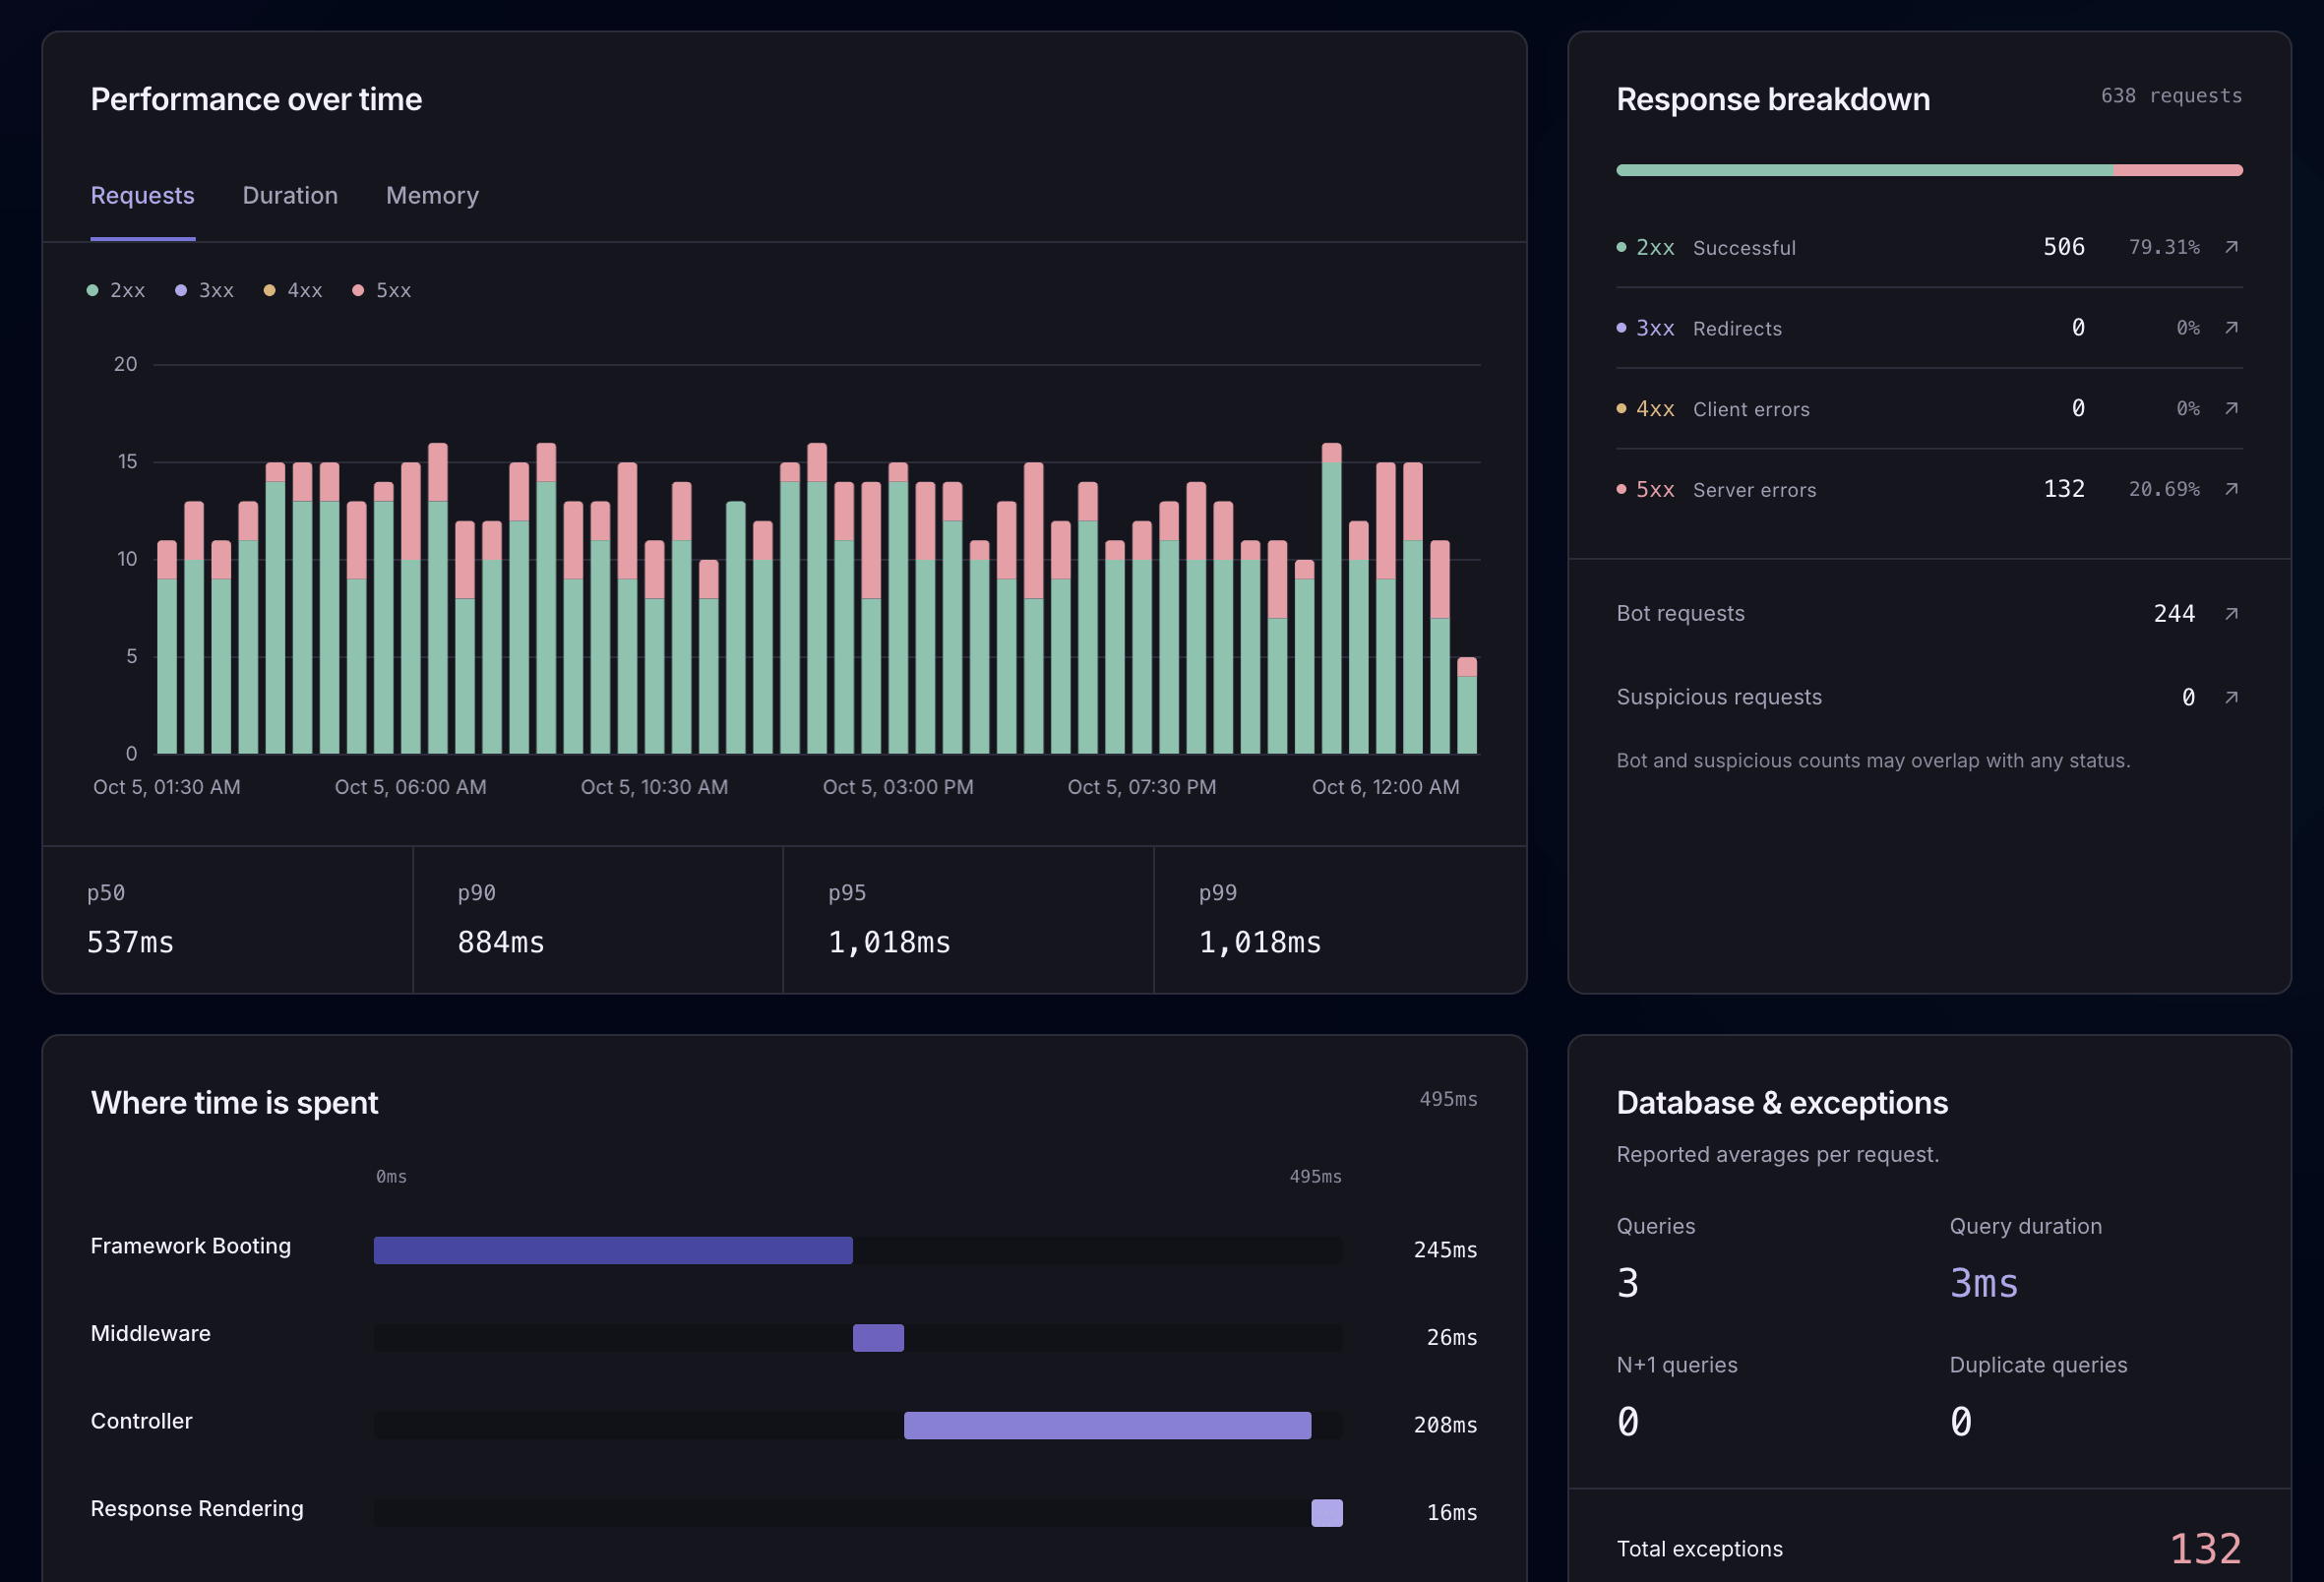
Use the data your Laravel app recorded to understand why a problem happened.
Outgoing API calls
Retain the configured outgoing headers, payload, response, and duration. Inspect what your app sent and received beside the exception and other execution events.
Rollbar supports custom context and PHP breadcrumbs. Laritor adds dedicated Laravel outgoing content views with controls for collection and sensitive data.
Command investigation
Open a retained Artisan command or scheduled execution to read its configured output. Follow the queries, logs, and API calls from the same run.
Rollbar reports PHP exceptions and messages. An equivalent automatic Laravel command-output and scheduled-execution resource is not listed.
AI debugging
Choose a supported provider for Laritor’s in-app recommendations. Connect your coding agent to Laritor MCP to retrieve exception details and the recorded execution timeline alongside your code.
Rollbar also supports MCP and built-in AI. Its Resolve open beta can open tested GitHub pull requests through a credit-based workflow. Laritor’s appeal is provider choice and Laravel execution context, rather than exclusive AI access.
Debug with your AI agent
Laritor MCP lets your agent retrieve exception details and the recorded execution timeline. It can inspect those events alongside your code to investigate the cause and work on a fix. In-app AI recommendations are available too.
Both tools connect to coding agents through MCP. Laritor adds in-app provider choices and retained Laravel execution context. Rollbar also offers Resolve’s open beta for credit-based GitHub fixes and a local MCP server with item actions. Choose your in-app AI provider ↗
Read the Laritor MCP guide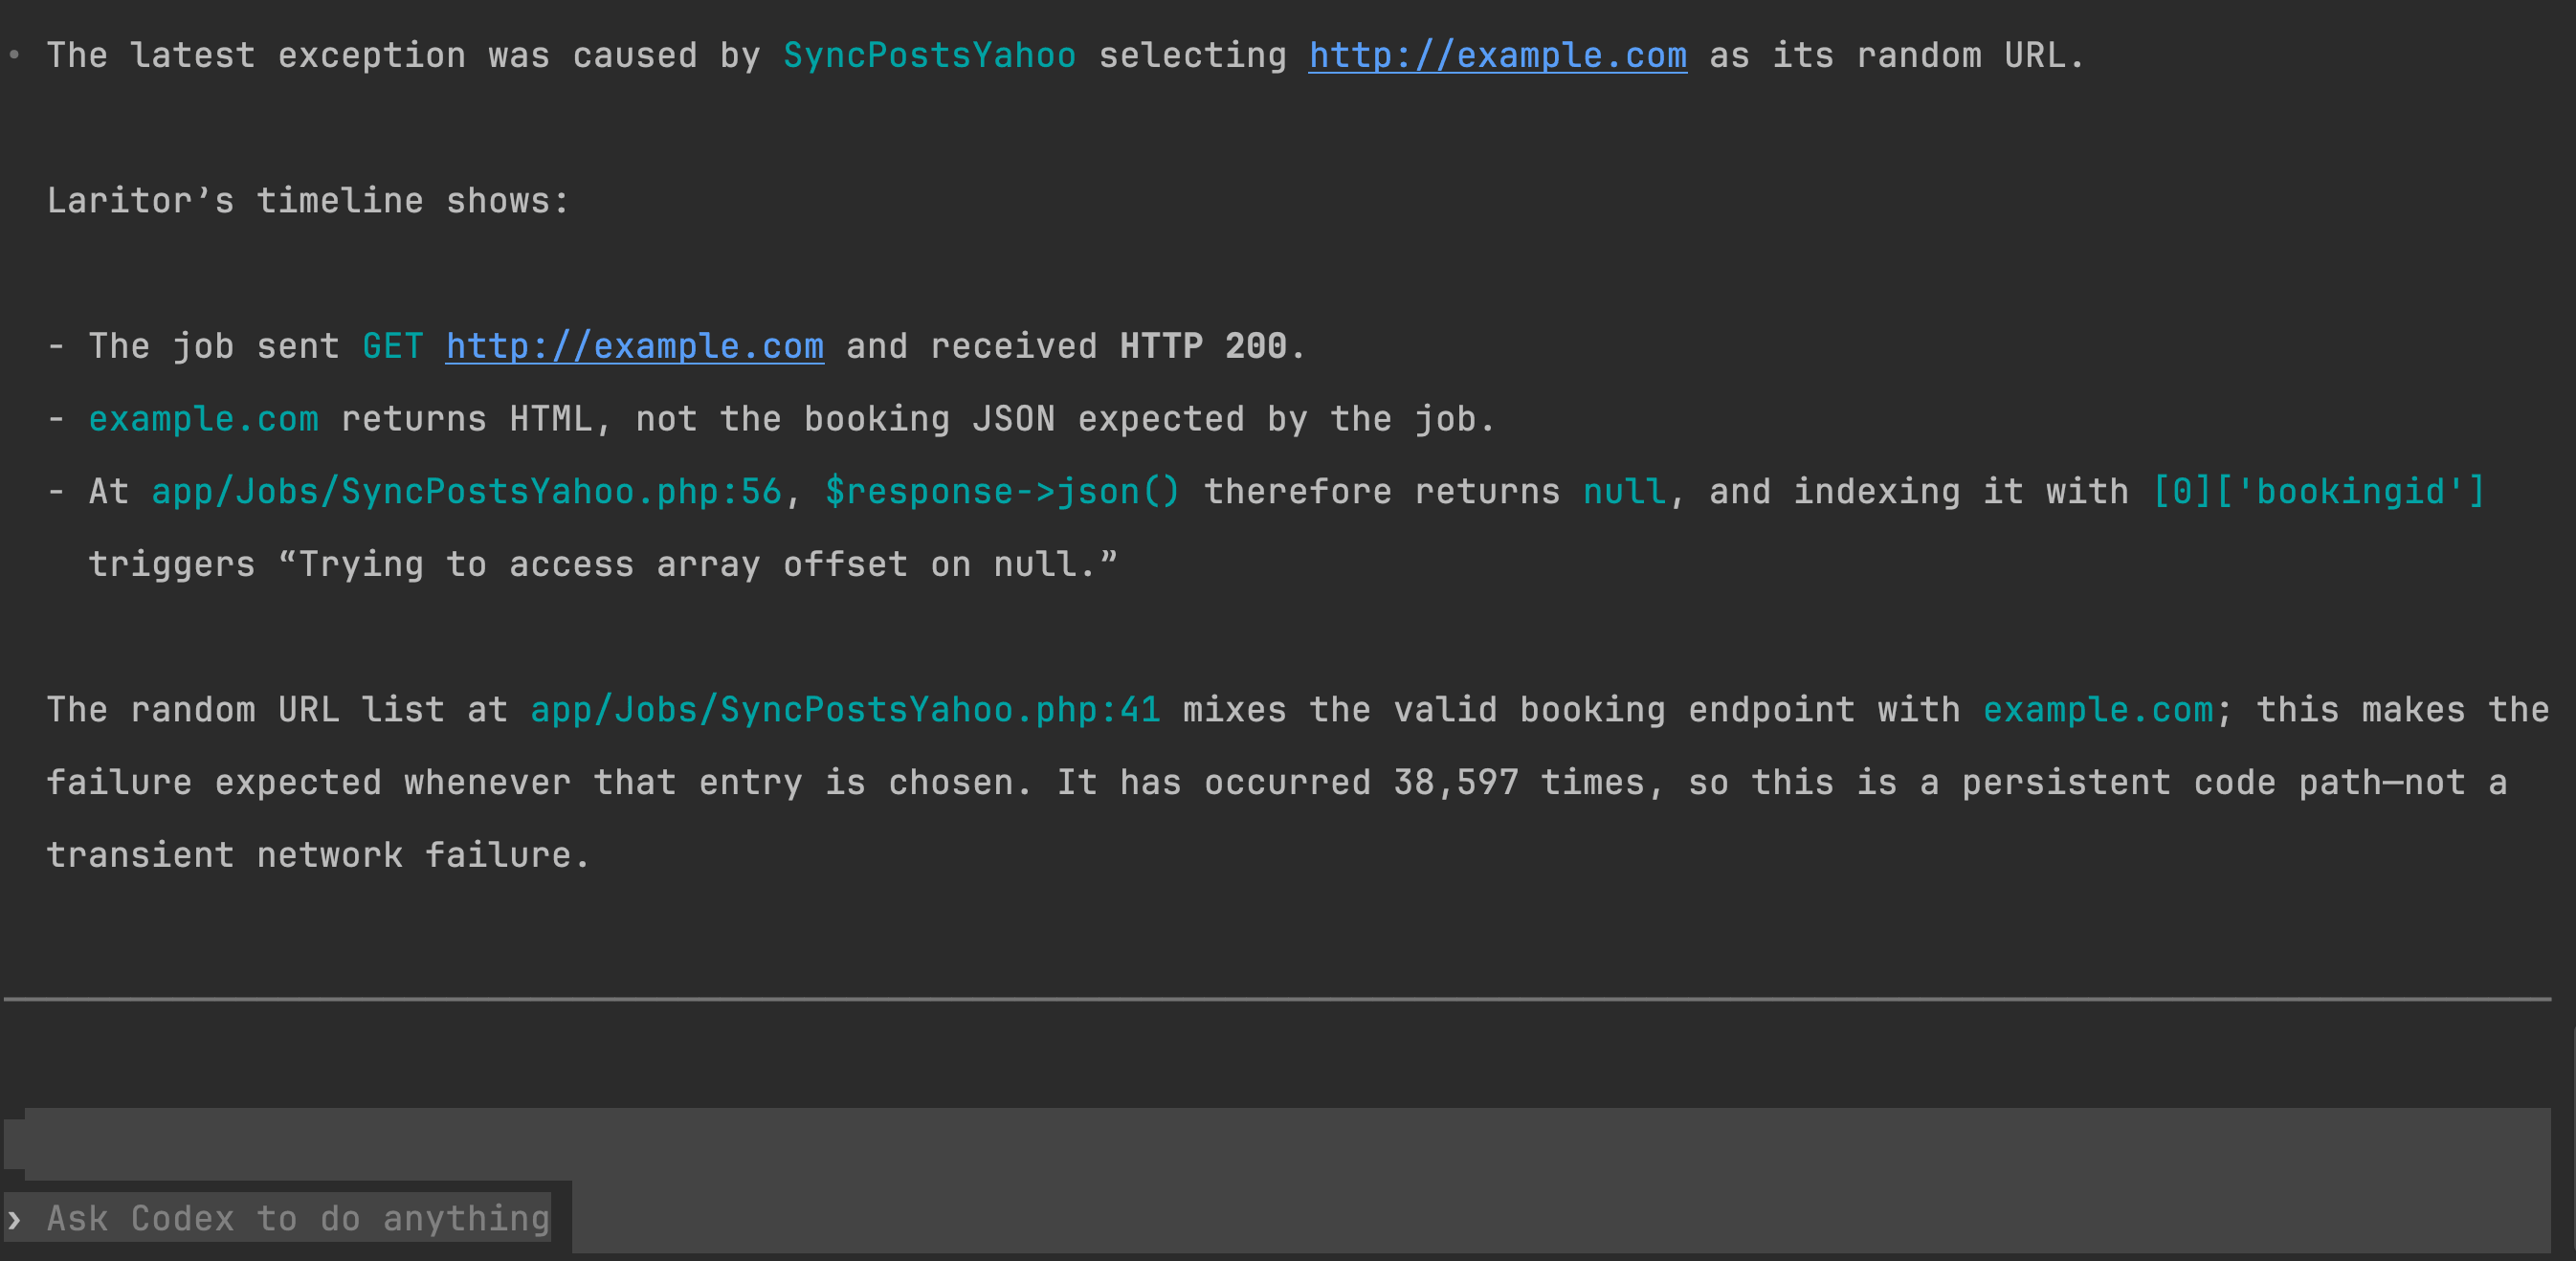
Follow backend activity, feature flags, and business milestones.
Backend session journeys
Open a Laravel session to inspect retained requests from that visit. Drill into each execution and connect custom events to steps such as checkout or a subscription change.
Rollbar browser replay shows what happened on screen and can correlate errors through session IDs. Laritor’s session view explains the Laravel backend work. These are different kinds of context.
Laravel feature flags
Review evaluations, activation, timing, and related exceptions to understand a rollout’s behavior. Laritor observes your existing flags rather than managing rollout rules.
Rollbar custom fields can attach flag state to an error. A dedicated automatic Pennant-performance view is not listed.
Custom events
Record named events with metadata for pricing decisions, payment attempts, or order validation. Inspect them in Laravel execution journeys and dedicated event views.
Rollbar also supports custom metadata and PHP telemetry events. Laritor provides a dedicated application resource for exploring those milestones.
Build useful views, receive performance snapshots, and record the activity you need.
Custom dashboards
Choose from 85+ Laravel widgets for request performance, queue behavior, traffic, and application issues. Share unlimited dashboards with your teammates.
Rollbar lets users personalize its dashboard cards and saved views. Analyze can power custom reports through APIs; an equivalent Laravel performance-widget builder is not listed.
Scheduled PDF reports
Schedule custom reports by email to keep tabs on your application without signing in. Share a PDF snapshot with teammates when you need to review performance.
Rollbar Analyze can generate custom insights from error history. Equivalent built-in daily or weekly Laravel performance PDF delivery is not listed.
Recording control
Start with exceptions-only for failure investigations. Choose issues-only to include slow and failed executions, or full observability to monitor all configured activity.
Rollbar’s PHP SDK offers sampling, ignore rules, and telemetry. Laritor’s presets decide which whole Laravel executions and related configured events to retain.
Evaluate Laritor in your app
Use a representative app or environment to compare the details you receive, recording volume, and debugging workflow.
Create a Laritor account, install the Composer package, add your ingest endpoint and key, and run the sync command.
composer require binarybuilds/laritor-clientStart with exception tracker, issue tracker, or full observability. Register the generated filter, then review the data and privacy settings for your app.
Configure recording filtersInspect a known exception or slow execution, test alert delivery, and compare measured overhead and billable event usage. If you run both tools, include their combined collection work in your evaluation.
Explore exception investigationCreate your dashboards, choose alert channels, schedule reports, and connect AI. Keep access to your existing Rollbar history while Laritor builds a new record of your application’s activity. There is no documented automatic history import.
Explore Laritor guidesQuestions before switching
Laritor is a strong fit when you want Laravel exception tracking, issue tracking, and performance monitoring in one tool. It adds dedicated requests, queues, queries, API calls, sessions, Pennant, and server resource views. Rollbar is worth considering for multi-language errors, visual browser replay, release workflows, longer paid error retention, or automated Resolve pull requests.
Rollbar has an official Composer integration for Laravel and supports its error and session context. It is designed for many languages and platforms. Laritor is designed primarily for Laravel. In this comparison, Laravel native describes that primary product focus rather than whether a tool supports the framework.
Rollbar’s reviewed product guides focus on errors, occurrences, impact, and telemetry context. Dedicated Laravel request duration, lifecycle, queue, query-performance, and N+1 workspaces are not listed. Laritor includes those views for retained activity. Rollbar custom telemetry or an additional APM tool may provide other performance context.
Yes. Exceptions-only recording retains executions that contain an exception, together with their related configured events. You can choose issues-only to include detected slow or failed executions, or full observability to record all configured activity. You pay for retained billable events rather than having to send every execution.
Yes. PHP SDK 4.1 and later documents a telemetry timeline, configurable filtering and limits, and custom breadcrumb events. The comparison does not claim that Rollbar lacks execution context. Laritor adds dedicated Laravel resource collection and performance views around retained requests, jobs, commands, and other activity.
Laritor includes 20M billable events for $20/month, then adds $0.20 per started 100K additional events. Rollbar paid monthly occurrence pricing starts at $9 on Essentials and $13 on Advanced for 10K occurrences. At 100K, those plans cost $49 and $129. The calculator compares the same exception workload and selects paid capacity; savings depend on volume and the related events Laritor records.
No. Rollbar counts reports sent to its API, including repeated exceptions and reported messages. Laritor counts retained events in 2 KB billing increments, including related queries, logs, and other configured activity. The calculator uses one exception count and average Laritor billable events per exception. It assumes one exception per retained execution so that an execution timeline is not counted twice.
It estimates paid exception monitoring only, before tax and with monthly billing. It excludes additional Rollbar message occurrences, paid replay capacity, AI credit subscriptions, Analyze add-ons, and on-demand overages, as well as annual discounts and free plans. Laritor full-observability or issues-only volumes may be higher. Both tools must be compared using their actual collection settings and workload.
Laritor shows Ask for a quote only when its calculated monthly price exceeds $500; exactly $500 stays numeric. Rollbar shows a quote prompt above the largest reviewed published numeric capacity of 50M monthly occurrences. The estimate does not invent a tier for volumes above that limit.
Rollbar’s default is to stop processing new events at the plan limit until renewal. Paid accounts can enable optional on-demand events or a capped overage budget. The calculator selects a published capacity that fits the entered monthly workload instead of predicting those account-specific overage charges.
Yes. Laritor MCP provides read-only exception and retained execution context, and in-app recommendations support provider choices. Rollbar’s local stdio MCP exposes errors, deployments, replay, and item updates when tokens permit. Rollbar Resolve is an open beta that can analyze an error and open a tested GitHub pull request, with repository setup and a credit subscription required.
Laritor follows recorded Laravel backend requests, users, and custom events across a session. Rollbar browser replay records visual interactions through its JavaScript SDK, with privacy controls and session correlation. A backend request journey is not a screen recording. Both can help investigate a user’s problem, but they explain different parts of it.
The Laravel integration can report exceptions or log messages from application code, including workers and commands, with configured context. This differs from dedicated monitoring of queue wait time, throughput, job payloads, scheduled runs, and Artisan output. Laritor provides these resource views for recorded activity; equivalent automatic Rollbar views are not listed in the reviewed guides.
Laritor offers unlimited custom dashboards with 85+ Laravel widgets and scheduled daily or weekly PDF reports. Rollbar supports dashboard card personalization, saved views, and custom analysis through RQL and its Metrics API. Equivalent built-in scheduled Laravel performance PDF reports are not listed; custom automation may cover that need.
Yes. Laritor supports client-side redaction, recording filters, sampling, and resource-specific collection settings. Rollbar supports PHP scrubbing, ignore callbacks, sampling, and browser replay masking. Review headers, payloads, responses, session values, logs, and custom fields before enabling collection. Review AI data access separately for the workflow you choose.
Yes. Evaluate Laritor alongside Rollbar in a representative environment. Test exception reports, performance investigations, alert delivery, combined overhead, and actual billable volume before changing your production workflow. Keep access to your existing Rollbar history; there is no documented automatic Rollbar history import into Laritor.
About this comparison
Published by Laritor, independently of Rollbar. Official pricing, billing, Laravel/PHP setup, telemetry, grouping, dashboard and Analyze guides, browser replay, deploy tracking, adaptive alerts, enterprise options, Resolve, and MCP documentation were reviewed on . Availability depends on plans, SDK versions, configuration, permissions, and beta requirements.
“Laravel native” means primarily designed for Laravel. Rollbar has an official Laravel integration within a multi-language product. “Not listed” describes an equivalent dedicated resource not found in the reviewed guides; custom instrumentation and integrations may cover the need. Rollbar supports PHP telemetry, request bodies, session data, browser replay, and AI. Laritor’s advantages focus on dedicated Laravel performance and application views, recording presets, provider choice, and scheduled PDF reports. Backend request journeys are distinct from visual browser replay.
The calculator models the same exception workload for both tools, with one exception per retained execution. Laritor events equal exception occurrences multiplied by average billable events, including related data and 2 KB increments. Rollbar capacity follows reported occurrences, rather than counting each related query or log as another error. Its monthly USD Essentials and Advanced occurrence tiers are published in the official pricing catalog. The smallest paid tier that fits is selected, without optional on-demand overages. Above 50M occurrences, ask for a quote rather than extrapolating an unpublished tier. Additional reported messages, paid replay capacity, AI credit subscriptions, Analyze add-ons, annual discounts, free plans, trials, and taxes are excluded. Laritor prices above $500 require a quote. Actual recording settings and overlapping exceptions affect volume; savings are not universal.
Start with the data you need
Track exceptions, detect issues, and monitor performance.
Try Laritor with 300K events free.