
Laritor
Yes
Laritor vs Horizon
Laritor tracks exceptions, detects issues, and monitors Laravel performance. Investigate failed jobs with their recorded queries, API calls, and logs, then monitor requests and user journeys in the same place. Debug with in-app AI or your coding agent through MCP. Keep Horizon for running and managing your Redis queue workers.
Published by Laritor · Comparison checked · View comparison notes
Designed primarily for Laravel. All tools compared here support Laravel.
Yes
Yes
Why choose Laritor over Horizon?
Horizon helps you run Redis queues and see job throughput, runtime, wait times, and failures. Laritor adds the recorded events behind those failures and visibility into the rest of your application. Use it to find slow queries, failing API calls, request errors, and the customer activity around a problem.
The full feature comparison
Compare 41 capabilities. See where Laritor gives you more, where Horizon has an advantage, and what both tools offer.
Horizon already provides job failures, exception details, payload/context, wait times, throughput, tags, retries, and long-wait notifications. Laritor’s advantage is broader application monitoring and the events behind a recorded execution. It does not replace Horizon’s worker supervision or balancing. “Not included” refers to the reviewed core; custom extensions and separate Laravel packages can add capabilities.
Related job events, application-wide exceptions and issues, request/SQL/API performance, backend sessions, Pennant, configurable dashboards, reports, and AI/MCP.
| Capability | Laritor | Horizon |
|---|---|---|
| Related events behind a failed job | Find the cause of the failure Inspect retained SQL, API calls, logs, cache activity, mail, and other events in the job’s timeline. | Stores job records, payload, failure exception, and context. A related SQL/API/log event timeline is not included in the reviewed core. |
| Exceptions across the whole Laravel app | Track more than queue failures Group and investigate exceptions from recorded requests, jobs, commands, and scheduled tasks. | Shows failed Redis jobs and their exceptions. A general request/command exception tracker is outside its queue-focused scope. |
| Detected application issues | See problems across your app Dedicated Issues workspace for recorded slow or failed work across the app. | Queue failure and workload views. A broader request/query/application Issues workspace is not included. |
| HTTP request and route performance | Improve request performance Duration, lifecycle timing, status codes, failures, route metrics, and retained request details. | Runs and monitors Redis queues. HTTP request and route performance monitoring is outside its scope. |
| Bot and suspicious request insights | Understand unwanted traffic Investigate recorded bot traffic and suspicious requests beside application performance. | A Redis queue dashboard; incoming bot and suspicious request views are not included. |
| SQL performance and query details | Find slow database work Slow/duplicate query investigations with configured bindings and execution context. | Job runtime can reveal slow work, but related SQL query collection and investigation views are not included. |
| Outgoing API content and timing | Understand failing API calls Inspect recorded API calls and optionally collect headers, payload, and response content. | Shows queued execution details. Related outgoing HTTP timing/content collection is not included. |
| Cache event investigations | Inspect cache activity Inspect recorded cache operations, configured keys/values, and hit/miss insights. | Uses Redis for queues and metadata. That does not provide application cache hit/miss or per-operation investigations. |
| Mail and notification delivery context | Follow application deliveries Dedicated mail and application notification resources inside retained execution journeys. | Recognizes queued mail/notification jobs and tags. Dedicated delivery-content views across synchronous and queued work are not included. |
| Commands and scheduled task output | Inspect background work Dedicated recorded Artisan/schedule views with configured output and related events. | Provides commands for running Horizon itself. General Artisan/scheduled-task execution and output monitoring is not included. |
| Backend user and session journeys | Follow the customer’s requests Follow retained requests, users, configured session context, and custom events. | Model/custom job tags can link queue work to an entity. Backend request/session journey views are not included. |
| Automatic Pennant feature flag insights | Understand feature rollouts Inspect feature evaluations, activation, duration, and related recorded failures. | Custom job tags can label work. Automatic Laravel Pennant performance resources are not included. |
| Custom business events inside executions | Explain your business steps Record milestones and debugging metadata within retained request or job journeys. | Supports job tags and captured queue context. A chronological custom business-event resource is not included. |
| Database schema explorer | Understand database structure Explore tables, columns, indexes, and relationships alongside query investigations. | Database schema exploration is outside its queue monitoring and worker management scope. |
| Host CPU, memory, and disk views | Compare code and server resources Optional server collection provides resource charts beside application activity. | Worker memory limits and supervisor status are operational controls. Host CPU/disk/memory charts are not included. |
| Application custom health checks | Check application dependencies Configure checks for application dependencies and inspect retained results. | Shows queue and worker status. A general application-dependency custom health-check resource is not included. |
| Unlimited customizable dashboards | Build views for your team Build unlimited dashboards with 85+ ready-made Laravel widgets. | Predefined queue/job/supervisor dashboard. A comparable built-in widget builder is not included; source customization is possible. |
| Daily and weekly PDF performance reports | Keep tabs without logging in Customize application snapshots, receive them by email, and share PDFs. | Scheduled queue metric snapshots populate its graphs. Those are not emailed application performance PDF reports. |
| In-app AI recommendations | Debug with recorded context Inspect exception recommendations with supported AI provider choices. | Built-in AI exception analysis is not listed in the reviewed core. Application-specific extensions are possible. |
| Hosted exception MCP | Give your agent useful context Give coding agents read-only exception details and retained Laravel execution events. | A dedicated exception MCP server is not listed in the reviewed Horizon core. Laravel’s separate MCP/Boost tools are different products. |
| One workspace across applications | Bring application views together Hosted organizations, applications, team access, and shared dashboards. | Dashboard is mounted within its Laravel application, with an application authorization gate. A hosted multi-app workspace is not included. |
| Managed monitoring storage | Reduce monitoring upkeep Hosted backend storage and 30-day recorded-event history included. | Horizon metadata stays in your Redis setup. Capacity, retention configuration, process monitoring, and maintenance remain yours. |
| Whole-execution recording modes | Record what matters Exceptions-only, issues-only, or all configured activity, retaining related events in matching executions. | Job class/tag silencing controls completed-job visibility. It is not exception-triggered capture of SQL/API/log events around an execution. |
| Ready-to-use execution history | Investigate older recorded work 30-day retained-event history included in the paid plan. | Default recent/completed job trimming is 60 minutes and failed/monitored trimming 10,080 minutes. Both are configurable; metric snapshot count is separate. |
Free open-source software, self-hosted metadata, Redis worker supervision, automatic balancing, pause/resume controls, retries, and official Laravel maintenance.
| Capability | Laritor | Horizon |
|---|---|---|
| Free software without usage fees | Paid hosted monitoring starts at $20/month, with event-based usage. | Free MIT-licensed software with no subscription or per-job license charge. Your infrastructure and upkeep may have costs. |
| Open-source queue management | Hosted product with a Laravel Composer client and configuration controls. | Inspect, modify, and extend the worker management and dashboard implementation under the MIT license. |
| Monitoring metadata in your infrastructure | Selected recorded data is exported to Laritor, with collection and redaction controls. | Keeps Horizon queue/job metadata in your Redis setup. Configured notification channels may send alert data externally. |
| Supervising Redis queue workers | Observe recorded queue activity. Laritor does not start or supervise your queue workers. | Starts and supervises configured worker processes for each application environment. |
| Automatic worker balancing | Measure wait time, execution time, and throughput to guide queue improvements. | Balances worker processes across Redis queues within configured limits, using time or queue-size strategies. This is not cloud-server autoscaling. |
| Worker pause, resume, and deployment controls | Monitoring and investigation; worker lifecycle commands are not supplied. | Pause/resume Horizon or individual supervisors, inspect status, and gracefully terminate workers for deployment. |
| Retrying failed jobs and batches | Inspect retained failures and their recorded causes. Remote job/batch retries are not listed. | Built-in retry endpoints and dashboard workflows for failed jobs and batches, subject to application authorization and setup. |
| Official Laravel package | Independent Laravel-focused monitoring product, unaffiliated with the Laravel core team. | Maintained in Laravel’s official organization, with Laravel documentation and established queue configuration workflows. |
Both are Laravel native and provide job status, runtime, wait-time/throughput visibility, failed-job exception details, payload/context, business labels, alerts, and noise controls. Scope differs.
| Capability | Laritor | Horizon |
|---|---|---|
| Laravel native and Composer setup | Designed for Laravel; install its Composer client and configure ingestion. | Official Laravel package; install laravel/horizon, publish configuration, and run the Horizon process. |
| Waiting, completed, and failed jobs | Inspect retained job status, timings, configured payloads, and related events. | Pending, completed, silenced, and failed job views for its monitored Redis queues. |
| Job execution duration | Recorded per-job duration and aggregate performance views. | Job runtime metrics and queue/job graphs, populated by configured collection and snapshots. |
| Queue wait times and throughput | Dedicated queue insights and retained wait-time/throughput investigations. | Job/queue wait-time and throughput metrics; schedule horizon:snapshot to populate graphs. |
| Failed-job exception and stack details | Exception groups, source file/line, full stack traces, and recorded execution events. | Failed-job exception details and stack information, decoded from its stored failure record. |
| Job payload and captured context | Configured payload and recorded Laravel execution context. | Stores queue payload, exception, and available Laravel context. These may contain sensitive data. |
| Business and model context | Attach custom events and metadata to retained Laravel journeys. | Automatic Eloquent model tags, custom tags, and available captured Laravel context help identify relevant jobs. |
| Queue problem notifications | Configure alerts and integration delivery for monitored application conditions. | Long-wait notifications through configured mail, Slack, and SMS channels, with per-queue thresholds. The alert scope differs. |
| Controls for noisy activity | Recording modes, event filters, sampling, and configured collection. | Silence jobs by class, tag, or interface to control completed-job display. Silencing is not a general telemetry sampling rule. |
Major difference
Laritor adds the recorded application activity behind job failures and slow executions. Keep Horizon for running Redis queue workers, and use Laritor to investigate what the jobs actually did across your Laravel app.
Read the related queries, API calls, cache activity, logs, and exception stack. Horizon’s queue dashboard does not provide this complete related-application-event investigation.
Laritor covers requests, commands, scheduled tasks, database performance, sessions, and feature flags. Horizon’s scope is Redis queue worker management and queue metrics.
Laritor runs the telemetry backend and provides alerts, custom dashboards, reports, and AI exception context. Your Horizon and Redis deployment continues handling worker execution; Laritor adds monitoring rather than replacing worker control.
Why choose Laritor over Horizon?
Track exceptions and investigate the slow or failing work around them. Follow requests, queues, queries, API calls, user sessions, and feature flags through Laravel views your team can use every day.
20M billable events, unlimited apps and users, and 30-day retention. Choose exceptions, detected issues, or all activity without a separate error or log quota.
Horizon’s software license is free. Laritor’s $20 plan includes hosted storage, 20M billable events, unlimited apps and users, and 30-day retained-event history. If you keep Horizon for workers, Laritor is an additional subscription for broader monitoring. Existing application, Redis queue, and worker costs remain.
Cost calculator
Use one recorded workload to estimate Laritor’s subscription. Horizon’s software is free. Its optional budget includes only extra monitoring capacity and upkeep you enter.
20,000,000 billable events
License $0.00 + extra infrastructure $0.00 + upkeep $0.00
Monthly USD before tax. These tools have different roles and coverage. If you keep Horizon for worker management, Laritor’s subscription is an additional monitoring cost. Your shared app, Redis queue, and worker costs remain.
Horizon has no software subscription or per-job fee, checked October 10, 2026. Infrastructure and upkeep start at $0 and use only your entered incremental budgets; no vendor running cost or Redis instance size is inferred from events. Laritor includes 20M billable events for $20/month, then $0.20 per started 100K above the allowance. Above $500 it shows “Ask for a quote”; exactly $500 stays numeric. The execution/event inputs affect Laritor’s estimate only. Neither side is a full estimate of application operating costs or equal monitoring coverage. Free trial usage, taxes, initial setup, and costs you have not entered are excluded. Removing a dashboard does not remove the need to run your queue workers.
Open the Laravel resource you need, then inspect the events behind slow or failing work.
Request performance
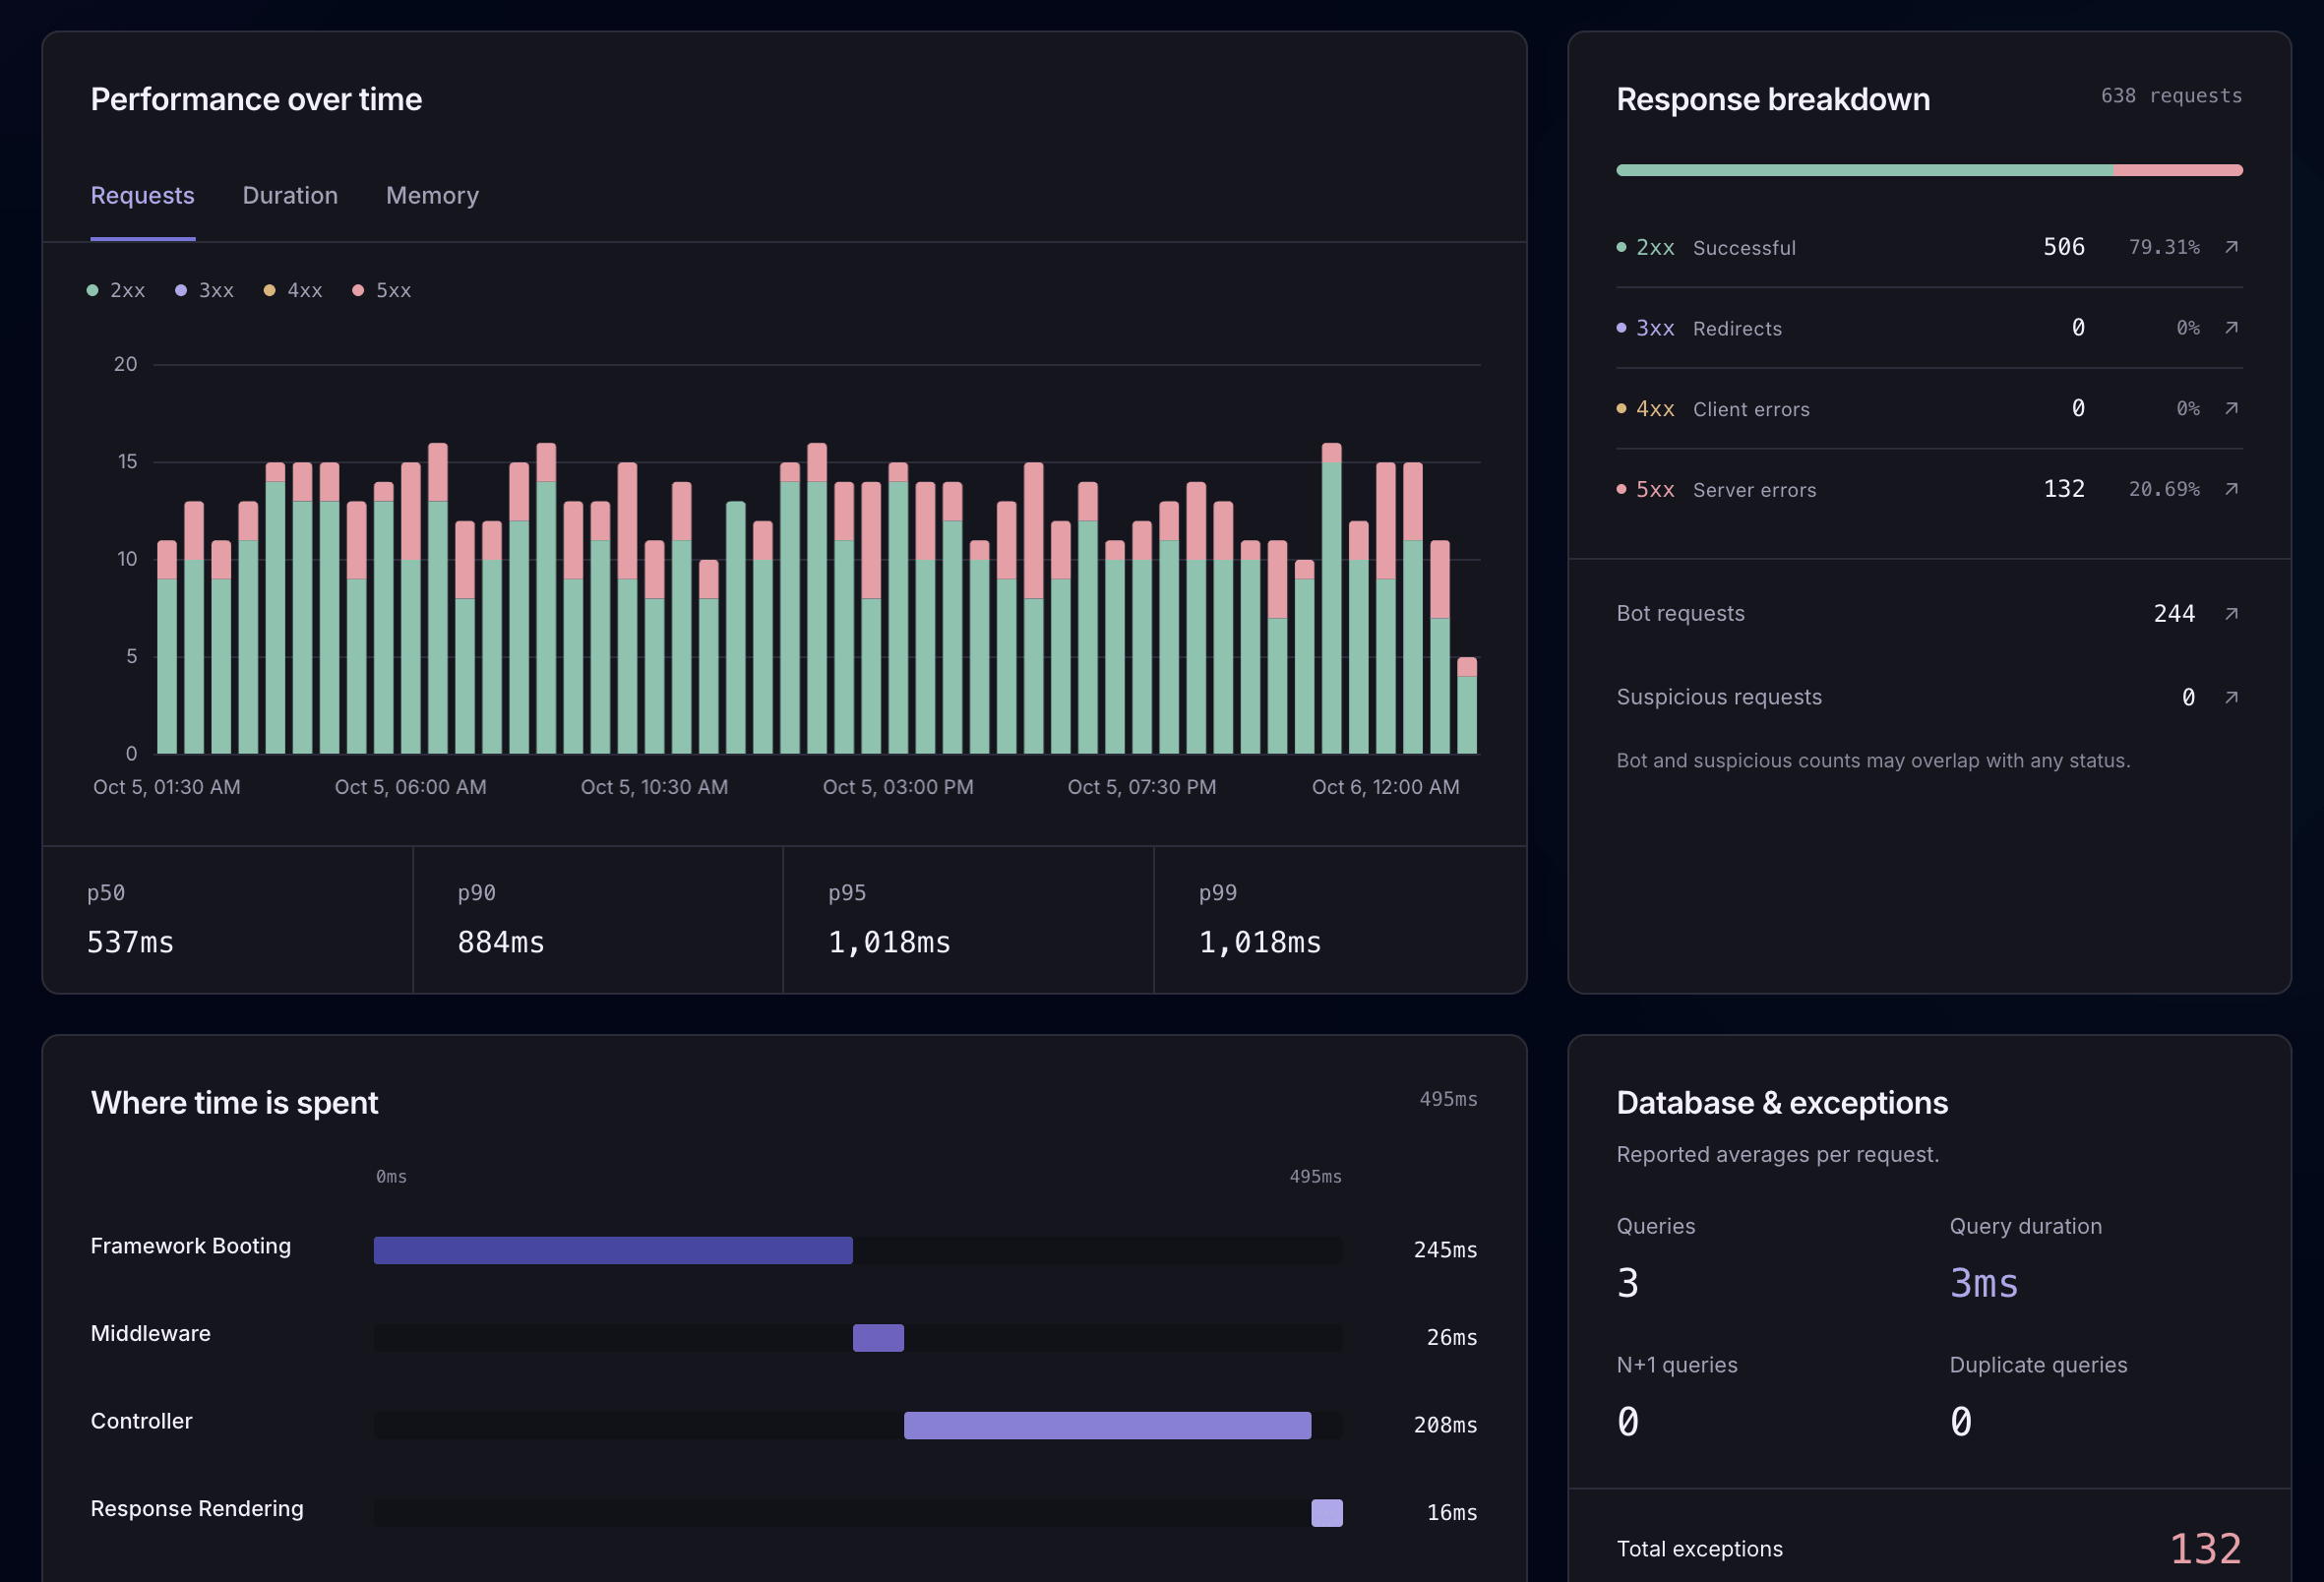
Compare request volume, status codes, duration percentiles, and lifecycle timing. Open a retained request to inspect its recorded queries, logs, and API calls.
Horizon monitors Redis queue work. Laritor also records incoming requests, route metrics, bot traffic, and configured content for investigating slow or failing HTTP work.
Queue performance
Separate queue wait from job execution time. Inspect retained failures and configured payloads to understand why work is delayed or failing.
Horizon already provides queue wait-time, runtime, and throughput metrics. Laritor adds related-event investigations and broader application context. Keep Horizon if you need its worker controls.
Queries and server resources
Inspect slow and duplicate queries, then compare application activity with optional CPU, memory, and disk collection.
Horizon shows queued job runtime, not the SQL/API work that consumed it. Laritor adds query investigations, a schema explorer, and optional host CPU/memory/disk collection.
Performance in context
Review request volume, status codes, duration percentiles, and where time is spent. Open a retained request to inspect its queries, logs, API calls, and other recorded events. Explore request monitoring
Move from an alert to the source line and the events that explain the failure.
Exception investigation
Open an exception group, source file, line, and full stack trace. Follow the retained request or job journey to inspect queries, logs, and other collected events.
Horizon already shows failed-job exceptions and stack information. Laritor adds grouped exceptions across the application and recorded SQL, API calls, logs, and other events behind each failure.
API failures and command output
Enable the content you need to inspect outgoing payloads and responses, or read output from failed Artisan commands beside their recorded events. Redact sensitive fields before sending them.
Horizon provides its own operational commands and queued job details. Dedicated application command-output and outgoing API-content investigations are outside its core scope.
AI and MCP
Use Laritor MCP to retrieve recorded exception details and execution events alongside your project’s code. In-app AI can recommend next steps with supported provider choices.
A dedicated exception MCP and in-app AI recommendations are not listed in Horizon’s core. Separate Laravel MCP/Boost tools and custom extensions do not supply this hosted investigation workflow by themselves.
Debug with your AI agent
Laritor MCP lets your agent retrieve exception details and the recorded execution timeline. It can inspect those events alongside your code to investigate the cause and work on a fix. In-app AI recommendations are available too.
A dedicated exception MCP and in-app AI workflow are not listed in Horizon’s core. Laritor’s read-only MCP supplies retained Laravel exception context alongside in-app recommendations. Choose your in-app AI provider ↗
Read the Laritor MCP guide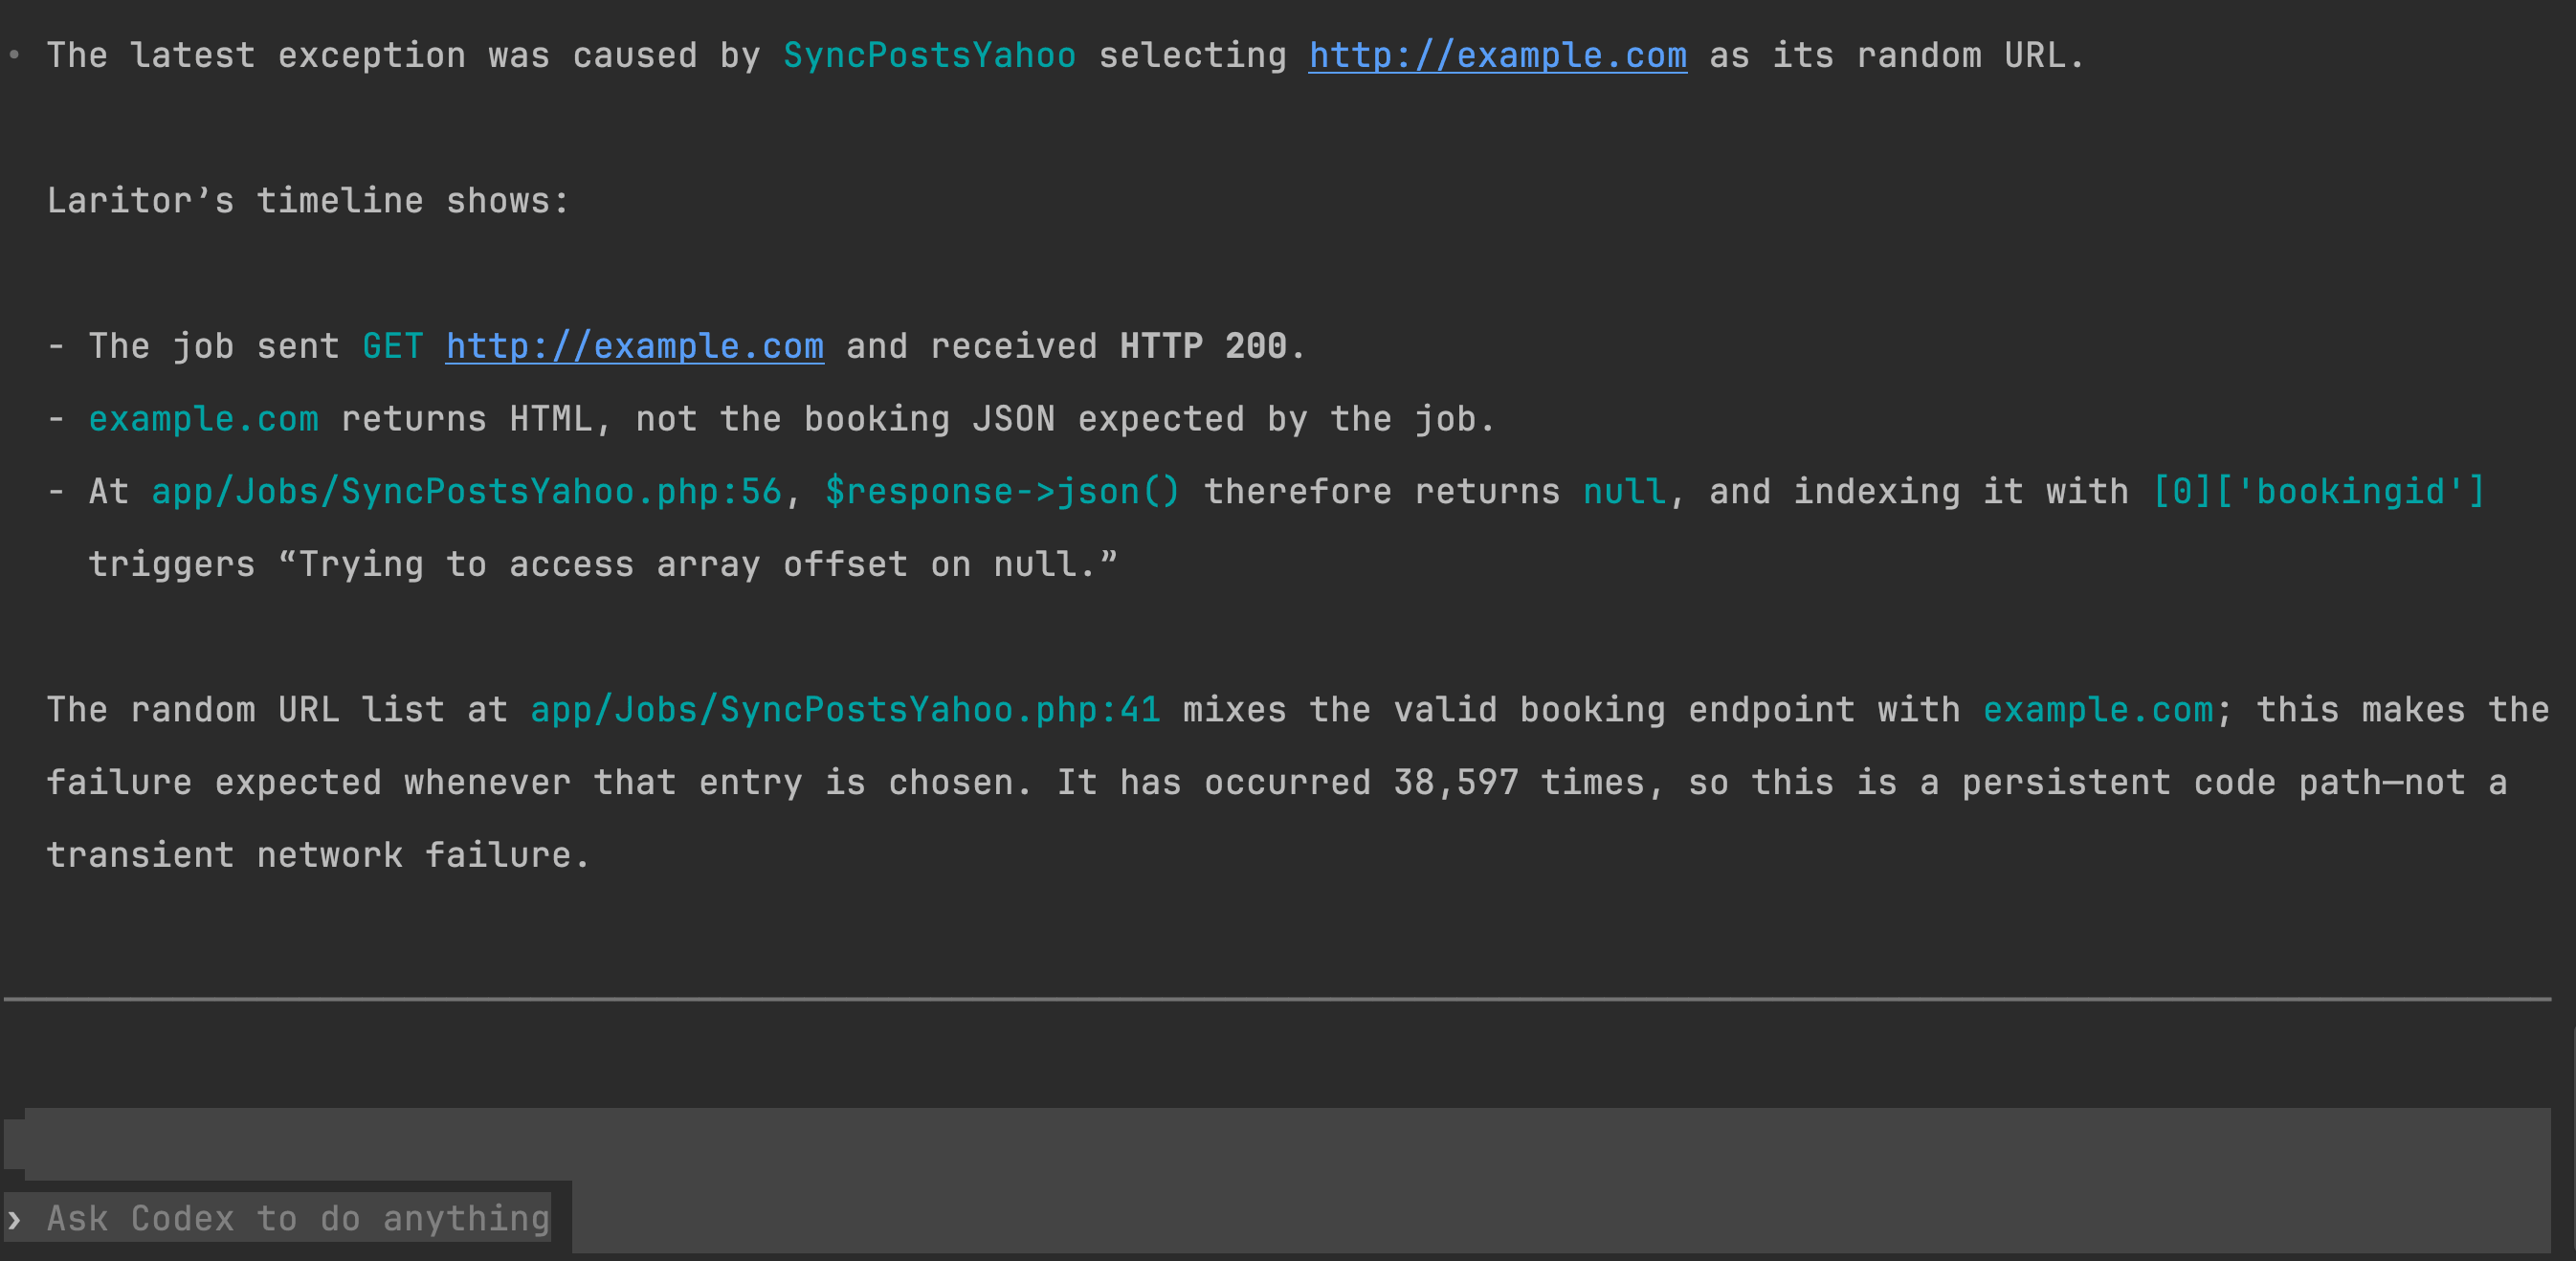
Follow customers, feature evaluations, and the milestones your team needs to debug.
Session journeys
Open a recorded Laravel session to inspect its retained requests. Add business milestones to see what the customer tried before an error.
Horizon job tags and captured context can identify relevant queue work. Laritor follows retained backend requests, session state, users, and custom events across a customer journey.
Feature flag performance
Inspect feature evaluations, activation, duration, and related failures. Review activity after a rollout through dedicated Laravel Pennant resources.
Horizon can tag jobs with business labels. Automatic Pennant evaluations and feature performance resources are outside its queue-focused scope.
Business events
Record checkout milestones, payment attempts, pricing decisions, and debugging metadata as custom events. Inspect them within retained execution journeys.
Horizon supports model/custom tags and available queue context. Laritor adds chronological custom events within recorded requests and job journeys.
Build Laravel dashboards, share performance snapshots, and choose what to record.
Custom dashboards
Choose from 85+ Laravel widgets for traffic, errors, queues, and application performance. Create unlimited dashboards and share them with your team.
Horizon has predefined queue/job/supervisor views and open source you can modify. Laritor includes a configurable dashboard builder with 85+ Laravel widgets.
Scheduled PDF reports
Customize application reports delivered by email, and share PDF snapshots without requiring every teammate to log in.
Horizon’s scheduled snapshots feed queue graphs. They do not deliver customizable application performance PDFs by email.
Recording and team costs
Keep exceptions and related events, expand to detected slow or failed work, or record all configured activity. Laritor’s paid plan uses one event allowance and includes unlimited apps and users.
Horizon has no software fee. Laritor’s paid plan includes hosted storage and broad Laravel investigations; it can run alongside Horizon’s worker management. Compare incremental monitoring costs, rather than charging existing queue infrastructure twice.
Evaluate Laritor in your app
Install Laritor alongside Horizon in a representative app. Compare the recorded events, overhead, and debugging workflow while Horizon continues managing your Redis workers.
Create a Laritor account, install the Composer package, add your ingest endpoint and key, and run the sync command.
composer require binarybuilds/laritor-clientStart with exception tracker, issue tracker, or full observability. Register the generated filter, then review the data and privacy settings for your app.
Configure recording filtersInspect a known exception or slow execution, test alert delivery, and compare measured overhead and billable event usage. If you run both tools, include their combined collection work in your evaluation.
Explore exception investigationCreate your dashboards, choose alert channels, schedule reports, and connect AI. Keep Horizon for worker supervision, balancing, and retries. Laritor builds a new record of configured application activity; there is no documented automatic history import.
Explore Laritor guidesQuestions before switching
Laritor is a strong choice for broader Laravel exception tracking, issue detection, and performance monitoring, with related events behind requests and jobs. Horizon runs and manages Redis queue workers. Laritor does not replace its supervisors, balancing, or retry controls. You can keep Horizon for queue operations and add Laritor for application investigations.
Yes. Both are designed for Laravel and install through Composer. Horizon is an official Laravel package; Laritor is an independent product. Horizon needs Redis queues and a running Horizon process. Laritor sends configured monitoring data to its hosted backend.
Yes. Keep Horizon running your Redis queue workers and install Laritor to record configured job/application activity. Evaluate representative jobs, exceptions, and slow requests; check worker restarts, recording settings, combined overhead, and alert delivery. Adding Laritor does not require removing Horizon or importing its history.
No. Horizon supervises workers, balances processes, and provides pause/resume, status, graceful termination, and retry workflows. Laritor monitors recorded activity and helps investigate why jobs or requests are slow or failing. Continue using Horizon or another appropriate worker/process system to run your queues.
The reviewed official guide requires Redis queues and says Horizon is not compatible with Redis Cluster. It is not a worker manager for database or SQS queues. Laritor’s documented job-details resource includes Redis, database, and SQS connection context; actual collection depends on supported versions, configuration, and worker behavior. Test your chosen connection.
Yes. Horizon provides job runtime, queue/job wait times, throughput, and failures. Configure its scheduled horizon:snapshot command to populate metric graphs. Laritor also shows recorded queue performance, adding related SQL, logs, API calls, and other events to investigate what happened during an execution.
Yes. Its failed-job records expose the stored exception, payload, available context, and retry details. Laritor’s advantage is broader exception grouping and investigation across requests, jobs, commands, and schedules, with related recorded execution events. It is not exclusive access to a failed-job exception or stack trace.
Yes. Horizon includes failed-job and batch retry workflows. Retrying runs application work again, so review the underlying failure and the job’s side effects first. Laritor helps inspect recorded causes but is not described here as a remote retry or batch-control replacement.
Horizon focuses on Redis queue operations. It does not provide general incoming request performance, SQL/API/cache event timelines, backend session journeys, or automatic Pennant resources in its reviewed core. Queued mail, notifications, and listeners can appear as jobs. Laritor adds dedicated resources for those application events and the rest of your recorded Laravel work.
Yes. Exceptions-only retains executions with exceptions and related configured events. Issues-only also keeps detected slow or failed work. Full observability records all configured activity. Horizon’s job silencing controls completed-job display by class, tags, or interface; it is not equivalent capture of related SQL/API/log events only around problematic executions. Filtered Laritor metrics describe retained activity.
Yes. Horizon documents long-wait notifications through configured mail, Slack, and SMS channels, with per-connection/queue thresholds. Laritor can alert on configured exceptions, failures, slow work, and other monitored application conditions. Notification prerequisites and alert scope differ. The comparison does not claim Horizon has no alerts.
Its reviewed default configuration trims recent/completed jobs after 60 minutes and failed/monitored jobs after 10,080 minutes, or seven days. These values are configurable. Metric graphs retain a configured number of snapshots, not a fixed number of days; history depends on snapshot frequency. Laritor’s paid plan includes 30-day retained-event history. Increasing Horizon history needs sufficient Redis capacity.
Yes. Horizon is MIT-licensed software with no subscription or per-job license fee. Redis capacity, application hosting, worker processes, and upkeep may still cost money, but an existing setup can cover them. The calculator starts Horizon’s incremental monitoring budget at $0 and does not invent a vendor charge. Laritor’s result is a hosted monitoring subscription.
Use one retained execution count and average related Laritor billable-event count. That calculates Laritor’s subscription. Horizon’s license stays $0 regardless of workload; its optional infrastructure and upkeep fields use only the incremental budgets you enter. They are not inferred from event volume. Horizon stores different data and manages workers, so this is not equal-storage or equal-feature pricing.
The calculator shows Ask for a quote strictly above $500 per month. Exactly $500 remains numeric. The modeled paid plan includes 20M billable events for $20, then $0.20 per started 100K. Horizon’s software license remains free regardless of execution count.
A dedicated in-app AI exception workflow or exception MCP server is not listed in the reviewed Horizon core. Laravel MCP and Boost are separate products, and custom integrations are possible. Laritor provides in-app recommendations with supported provider choices and a hosted read-only MCP that exposes exception details and retained execution context to coding agents.
Horizon can store queue payloads, exception messages, tags, and available captured context in Redis. Protect the dashboard through its authorization gate and review retention and application data design. Laritor can redact configured sensitive fields and control optional collection before exporting events. Self-hosting alone does not redact payloads; check what each configuration records.
About this comparison
Published by Laritor, independently of Laravel Horizon and the Laravel core team. The current Laravel 13 Horizon guide and official repository, MIT license, configuration, routes, job payload, failure, retry, and Redis storage implementation were reviewed on . This compares the documented Horizon core, not every community extension or separate Laravel product.
Both products are Laravel native. Horizon manages Redis queue workers and stores job metadata; Laritor records configured application events for investigation. The reviewed Horizon guide requires Redis and excludes Redis Cluster. Laritor does not replace worker supervision, balancing, retries, or hosting. Queued mail/notifications and job model tags already appear in Horizon; they differ from dedicated application delivery or session investigations.
Horizon’s default recent/completed trim is 60 minutes, with failed/monitored jobs at 10,080 minutes. These are configurable. Metric history uses a snapshot count, with the guide recommending snapshots every five minutes; it is not a fixed-day retention promise. Laritor’s paid plan includes 30-day retained-event history. Optional payload/output/server collection needs configuration, and conditional recording changes which activity your metrics describe.
The calculator uses one retained execution count and average related Laritor billable events, including 2 KB increments. Horizon has no software or per-job fee. Its optional monitoring infrastructure/upkeep inputs start at $0 and use only entered incremental budgets. They are not vendor prices or storage estimates derived from event volume. Do not count existing application/queue-worker costs twice or assume they disappear when adding Laritor. These figures represent different coverage and responsibilities. Trials, taxes, initial setup, and unentered operating costs are excluded. Laritor estimates strictly above $500 require a quote; exactly $500 remains numeric.
Protect Horizon’s application dashboard and stored payload/context through access controls and data design. Review Laritor collection/redaction before exporting events. Parallel evaluation should measure combined monitoring overhead and verify representative failures, queue jobs, alerts, and recorded volume.
Start with the data you need
Track exceptions, detect issues, and monitor performance.
Try Laritor with 300K events free.