
Laritor
Yes
Laritor vs Uptrace
Laritor tracks exceptions, detects issues, and monitors Laravel performance. Inspect requests, jobs, queries, API calls, logs, and user sessions in one place. Choose what to record, give your team full access, and debug with in-app AI or your coding agent through MCP.
Published by Laritor · Comparison checked · View comparison notes
Designed primarily for Laravel. All tools compared here support Laravel.
Yes
No
Why choose Laritor over Uptrace?
Uptrace combines traces, logs, and metrics across a wider OpenTelemetry stack, with Cloud and self-hosted options. Laritor gives Laravel teams dedicated views for exceptions, issues, requests, jobs, queries, sessions, and feature flags. Open a slow or failing execution, inspect its recorded events, and give your team the context needed to fix it.
The full feature comparison
Compare 41 capabilities. See where Laritor gives you more, where Uptrace has an advantage, and what both tools offer.
Uptrace supports Laravel instrumentation, grouped exceptions, full stack traces, custom dashboards, conditional trace-aware sampling, and MCP. “Not listed” means an equivalent dedicated Laravel resource was not found in the reviewed guides; custom spans, attributes, and logs can cover some needs. Collection detail and access features depend on instrumentation, configuration, and deployment or edition.
Composer installation, whole-execution recording presets, payload/output views, backend sessions, Pennant, Laravel widgets, PDF reports, and in-app AI choices.
| Capability | Laritor | Uptrace |
|---|---|---|
| Laravel Composer client installation | Install inside Laravel Install the Composer client and configure ingestion. No separate native PHP extension for application collection. | Documented Laravel auto-instrumentation uses a PHP extension plus Composer packages and OTLP configuration. Manual PHP instrumentation is also possible. |
| Whole-execution recording presets | Record what matters Exception tracker issue tracker, or full observability, retaining related configured events in matching executions. | Supports trace-aware conditional sampling and transforms, including keeping errors. Equivalent Laravel whole-execution exception/issue presets are not listed. |
| Dedicated Pennant feature flag insights | Understand feature rollouts Inspect evaluations, activation, duration, and related recorded failures. | Custom attributes, spans, and metrics can describe feature flags. A dedicated automatic Laravel Pennant resource is not listed. |
| Laravel backend session resources | Follow backend customer activity Follow retained requests, configured session context, users, and custom events within a Laravel session. | Can correlate traces using supplied user/session attributes. An equivalent dedicated Laravel session-state and cross-request journey resource is not listed. |
| Incoming request and response content views | Inspect the request content Optionally capture configured incoming headers, payload, and response content with sensitive-field controls. | Span attributes and custom instrumentation can carry request details. Equivalent automatic Laravel request/response content resources are not listed. |
| Outgoing API payload and response views | Find why API calls fail Optionally inspect outgoing headers, payload, response content, status, and duration. | HTTP spans and custom attributes provide call context. Equivalent dedicated automatic Laravel outgoing payload/response-body resources are not listed. |
| Dedicated Laravel job payload inspection | Inspect failing jobs Open a retained job’s configured payload and related queries, logs, API calls, and exceptions. | Laravel guidance includes custom job spans. An equivalent ready-made job payload investigation resource is not listed. |
| Artisan command output resources | Read failed command output Read configured command output beside duration, errors, and related recorded events. | Instrument CLI work and emit logs or custom spans. A dedicated Laravel Artisan-output resource is not listed. |
| Laravel scheduled-task resources | Inspect scheduled work Inspect retained scheduled executions, failures, timing, and related activity. | Instrument scheduled commands and define monitors. An equivalent dedicated Laravel scheduler execution resource is not listed. |
| Laravel mail and notification resources | Investigate delivery failures Inspect retained delivery activity, duration, failures, and related execution events. | Custom spans and logs can describe delivery work. Dedicated Laravel mail and notification resources are not listed. |
| Laravel cache-operation resources | Understand cache behavior Inspect recorded cache operations, keys, timing, and execution context. | Supports Redis metrics and custom spans. Equivalent ready-made Laravel cache-operation/key resources are not listed. |
| Database schema explorer | Use database context Browse application tables, columns, indexes, and relationships with AI assistance. | SQL spans and database metric templates are supported. An equivalent Laravel schema explorer is not listed. |
| Dependency health checks written in Laravel | Check inside your application Run built-in or custom PHP checks from your application and inspect result history. | Collector-based HTTP checks include response validation and TLS expiry. An equivalent built-in Laravel PHP dependency-check resource is not listed. |
| Ready-made Laravel widget library | Build useful team views Build unlimited custom dashboards using 85+ Laravel widgets. | Build custom dashboards in the UI or YAML and use infrastructure templates. An equivalent 85+ Laravel widget library is not listed. |
| Custom daily and weekly PDF reports | Share application snapshots Customize application snapshots, receive scheduled email reports, and share PDFs. | Dashboards can be exported as YAML and queried through MCP. Equivalent scheduled customizable Laravel performance PDFs are not listed. |
| In-app AI provider choice | Choose your AI workflow Use in-app recommendations with supported providers alongside hosted exception MCP. | MCP queries telemetry and manages dashboards through AI assistants. An equivalent in-app recommendations workflow with provider choices is not listed. |
| Dedicated Laravel bot traffic views | Understand automated traffic Inspect recorded bot and suspicious requests through dedicated views and filters. | Custom attributes, queries, and transforms can analyze traffic. Equivalent dedicated Laravel bot/suspicious-request resources are not listed. |
An open-source backend, self-hosted deployment, multiple languages, distributed traces, service graphs, Kubernetes, PromQL, Terraform/YAML, Grafana, browser source maps, and enterprise access.
| Capability | Laritor | Uptrace |
|---|---|---|
| Open-source monitoring backend | Hosted monitoring; an equivalent open-source backend distribution is not listed. | Inspect and run the AGPL-licensed backend. Community includes core features; paid editions add collaboration, security, and operations. |
| Self-hosted telemetry residency | Send configured events to Laritor’s hosted backend. | Run inside your infrastructure with ClickHouse, PostgreSQL, and Redis. You control hosting, storage, upgrades, and backups, or arrange managed service. |
| Multi-language instrumentation | Designed primarily for Laravel applications. | Use OpenTelemetry across PHP, Go, Java, Python, Node.js, .NET, and additional runtimes. |
| Distributed traces and service graphs | Retained Laravel execution context; equivalent cross-stack service maps are not listed. | Follow request traces across services and visualize dependencies, error rates, and latency from suitable span relationships. |
| Kubernetes and fleet infrastructure | Application events and optional server CPU, memory, and disk collection. | Use Collector receivers and templates for Kubernetes, hosts, containers, network, and process resources. |
| OpenTelemetry and Prometheus pipelines | A Laravel Composer client collects application activity. | Accept OTLP and Prometheus remote write and use PromQL-compatible metric queries with documented compatibility limits. |
| Version-controlled observability setup | Configure collection in Laravel and build team dashboards in the UI. | Manage organizations, projects, teams, monitors, and channels using Terraform, plus dashboards and transforms as YAML. |
| Keep existing Grafana views | Built-in Laravel dashboards; equivalent Grafana Prometheus/Tempo endpoints are not listed. | Query Uptrace telemetry from Grafana using Prometheus-compatible and Tempo-compatible HTTP endpoints. |
| Browser errors and source maps | Focuses on backend Laravel exceptions and executions. | Capture browser errors through appropriate SDKs and resolve minified JavaScript stack traces with source maps. |
| Enterprise access and self-hosted editions | Unlimited team users; equivalent public enterprise SSO/RBAC guides are not listed. | Paid self-hosted editions list RBAC, routing, and SSO at different tiers. Confirm Cloud entitlements and the required edition. |
Both support Laravel errors and full stack traces, requests, SQL/HTTP timing, instrumented jobs, logs, servers, custom dashboards, business context, alerts, conditional sampling, privacy, MCP, and hosted monitoring.
| Capability | Laritor | Uptrace |
|---|---|---|
| Laravel support | A client designed primarily for Laravel. | Publishes Laravel auto-instrumentation, custom spans, metrics, and job examples using OpenTelemetry. |
| Exception groups and full stack traces | Laravel exception groups, source file/line, full stack trace, and retained execution events. | Groups recorded exceptions with full stack traces, error trends, and distributed trace correlation. |
| Request performance and timelines | Laravel durations, percentiles, response codes, lifecycle timing, and related recorded events. | Operation metrics, latency percentiles, trace waterfalls, errors, and related telemetry. |
| SQL and outgoing HTTP timing | Inspect retained queries, API calls, duration, and related request or job context. | Laravel instrumentation can trace database and HTTP work; inspect span attributes and trace context. Coverage depends on packages. |
| Background-job instrumentation | Dedicated jobs and queues, failures, payloads, and related recorded events. | Laravel guidance demonstrates custom job spans. Add the required instrumentation; ready-made resources and collected details differ. |
| Logs linked to execution context | Recorded Laravel logs connect to retained requests, jobs, and exceptions. | Search structured logs and follow links to related spans/traces when context identifiers are supplied. |
| Server resource monitoring | Optionally collect application-server CPU, memory, and disk measurements. | Host metric collection and templates for CPU, memory, disk, filesystem, and network. |
| Custom dashboards | Unlimited dashboards with 85+ Laravel widgets in the paid plan. | Custom UI/YAML dashboards built from spans, events, logs, and metrics, with templates and grouping. |
| Custom business context | Record business milestones and debugging metadata as Laravel custom events. | Send custom spans, events, attributes, logs, or metrics and query business context. |
| Alerts and notification channels | Send configured alerts through supported integrations and webhooks. | Error/metric monitors with email, Slack, Teams, PagerDuty, Telegram, webhooks, and other supported channels. |
| Conditional sampling and filtering | Whole-execution presets, configurable filters, and collection settings. | Trace-aware sampling, error conditions, drops, and transforms. These are different from Laritor’s Laravel execution presets. |
| Sensitive-data controls | Redact configured sensitive fields and disable optional content capture before sending events. | Use SDK/Collector redaction before export and configured transformations. Self-hosting alone does not mask sensitive values. |
| MCP for AI assistants | Hosted read-only exception details and retained Laravel execution context, plus in-app AI. | MCP queries spans, traces, metrics, alerts, and monitors, and can create/update/delete dashboards according to user access. |
| Hosted monitoring with unlimited users | Hosted backend storage, unlimited apps and users sharing an event allowance. | Uptrace Cloud manages the backend and lists unlimited users, services, and hosts without per-seat/host fees. Self-hosted edition terms differ. |
Major difference
Laritor gives your team a managed service and ready-made application views from its Composer client. Spend less time configuring telemetry and more time understanding the recorded requests and jobs that need attention.
Laritor connects application events through its Laravel client. Uptrace uses OpenTelemetry instrumentation, export, resource attributes, and sampling configured for the applications you monitor.
Open queue wait, schedules, cache, backend sessions, Pennant, and custom event views directly. Uptrace’s general trace, log, and metric workflows do not list the same dedicated Laravel resource workspace.
Laritor operates storage, retention, and capacity. Self-hosted Uptrace adds backend and data services for your team to maintain; Uptrace Cloud also manages its backend, but still uses the broader OpenTelemetry workflow.
Why choose Laritor over Uptrace?
Track exceptions and investigate the slow or failing work around them. Follow requests, queues, queries, API calls, user sessions, and feature flags through Laravel views your team can use every day.
20M billable events, unlimited apps and users, and 30-day retention. Choose exceptions, detected issues, or all activity without a separate error or log quota.
Laritor’s $20 plan includes hosted storage, Laravel resource views, unlimited apps and users, and 30-day retention. Uptrace Cloud’s data-volume pricing can cost less for some workloads; metrics and longer history add separate charges. Self-hosted editions also need infrastructure. Compare the investigation detail, retained history, and measured usage you need below.
Cost calculator
Use one shared workload. Laritor bills recorded events. Uptrace Cloud bills span/log data volume and metric datapoints separately. This compares paid span/log usage before free credits, using its current public estimator’s tiers.
20,000,000 billable events
9.313 GB estimated ingestion
This is a span/log usage estimate, not a complete Uptrace bill. Metrics, extra retention, sampled-out records, optional text indexing, and network transfer are excluded. Self-hosted licenses and infrastructure use a different model.
Monthly USD before tax. Paid tiers follow Uptrace’s live estimator checked October 9, 2026; pricing text on its site advertises different starting rates and free allowances. No free credits or invented minimum bill are applied here. Volume discounts change the tier at its included-volume threshold, so a price can decrease when the next tier starts. Above the verified range, the last tier continues as a planning assumption. Metrics and longer history require another estimate. Laritor includes 20M billable events for $20 and adds $0.20 per started 100K; above $500/month it shows “Ask for a quote.” Exactly $500 stays numeric. Compare measured records, actual account rates, required features, and retained history.
Open the Laravel resource you need, then inspect the events behind slow or failing work.
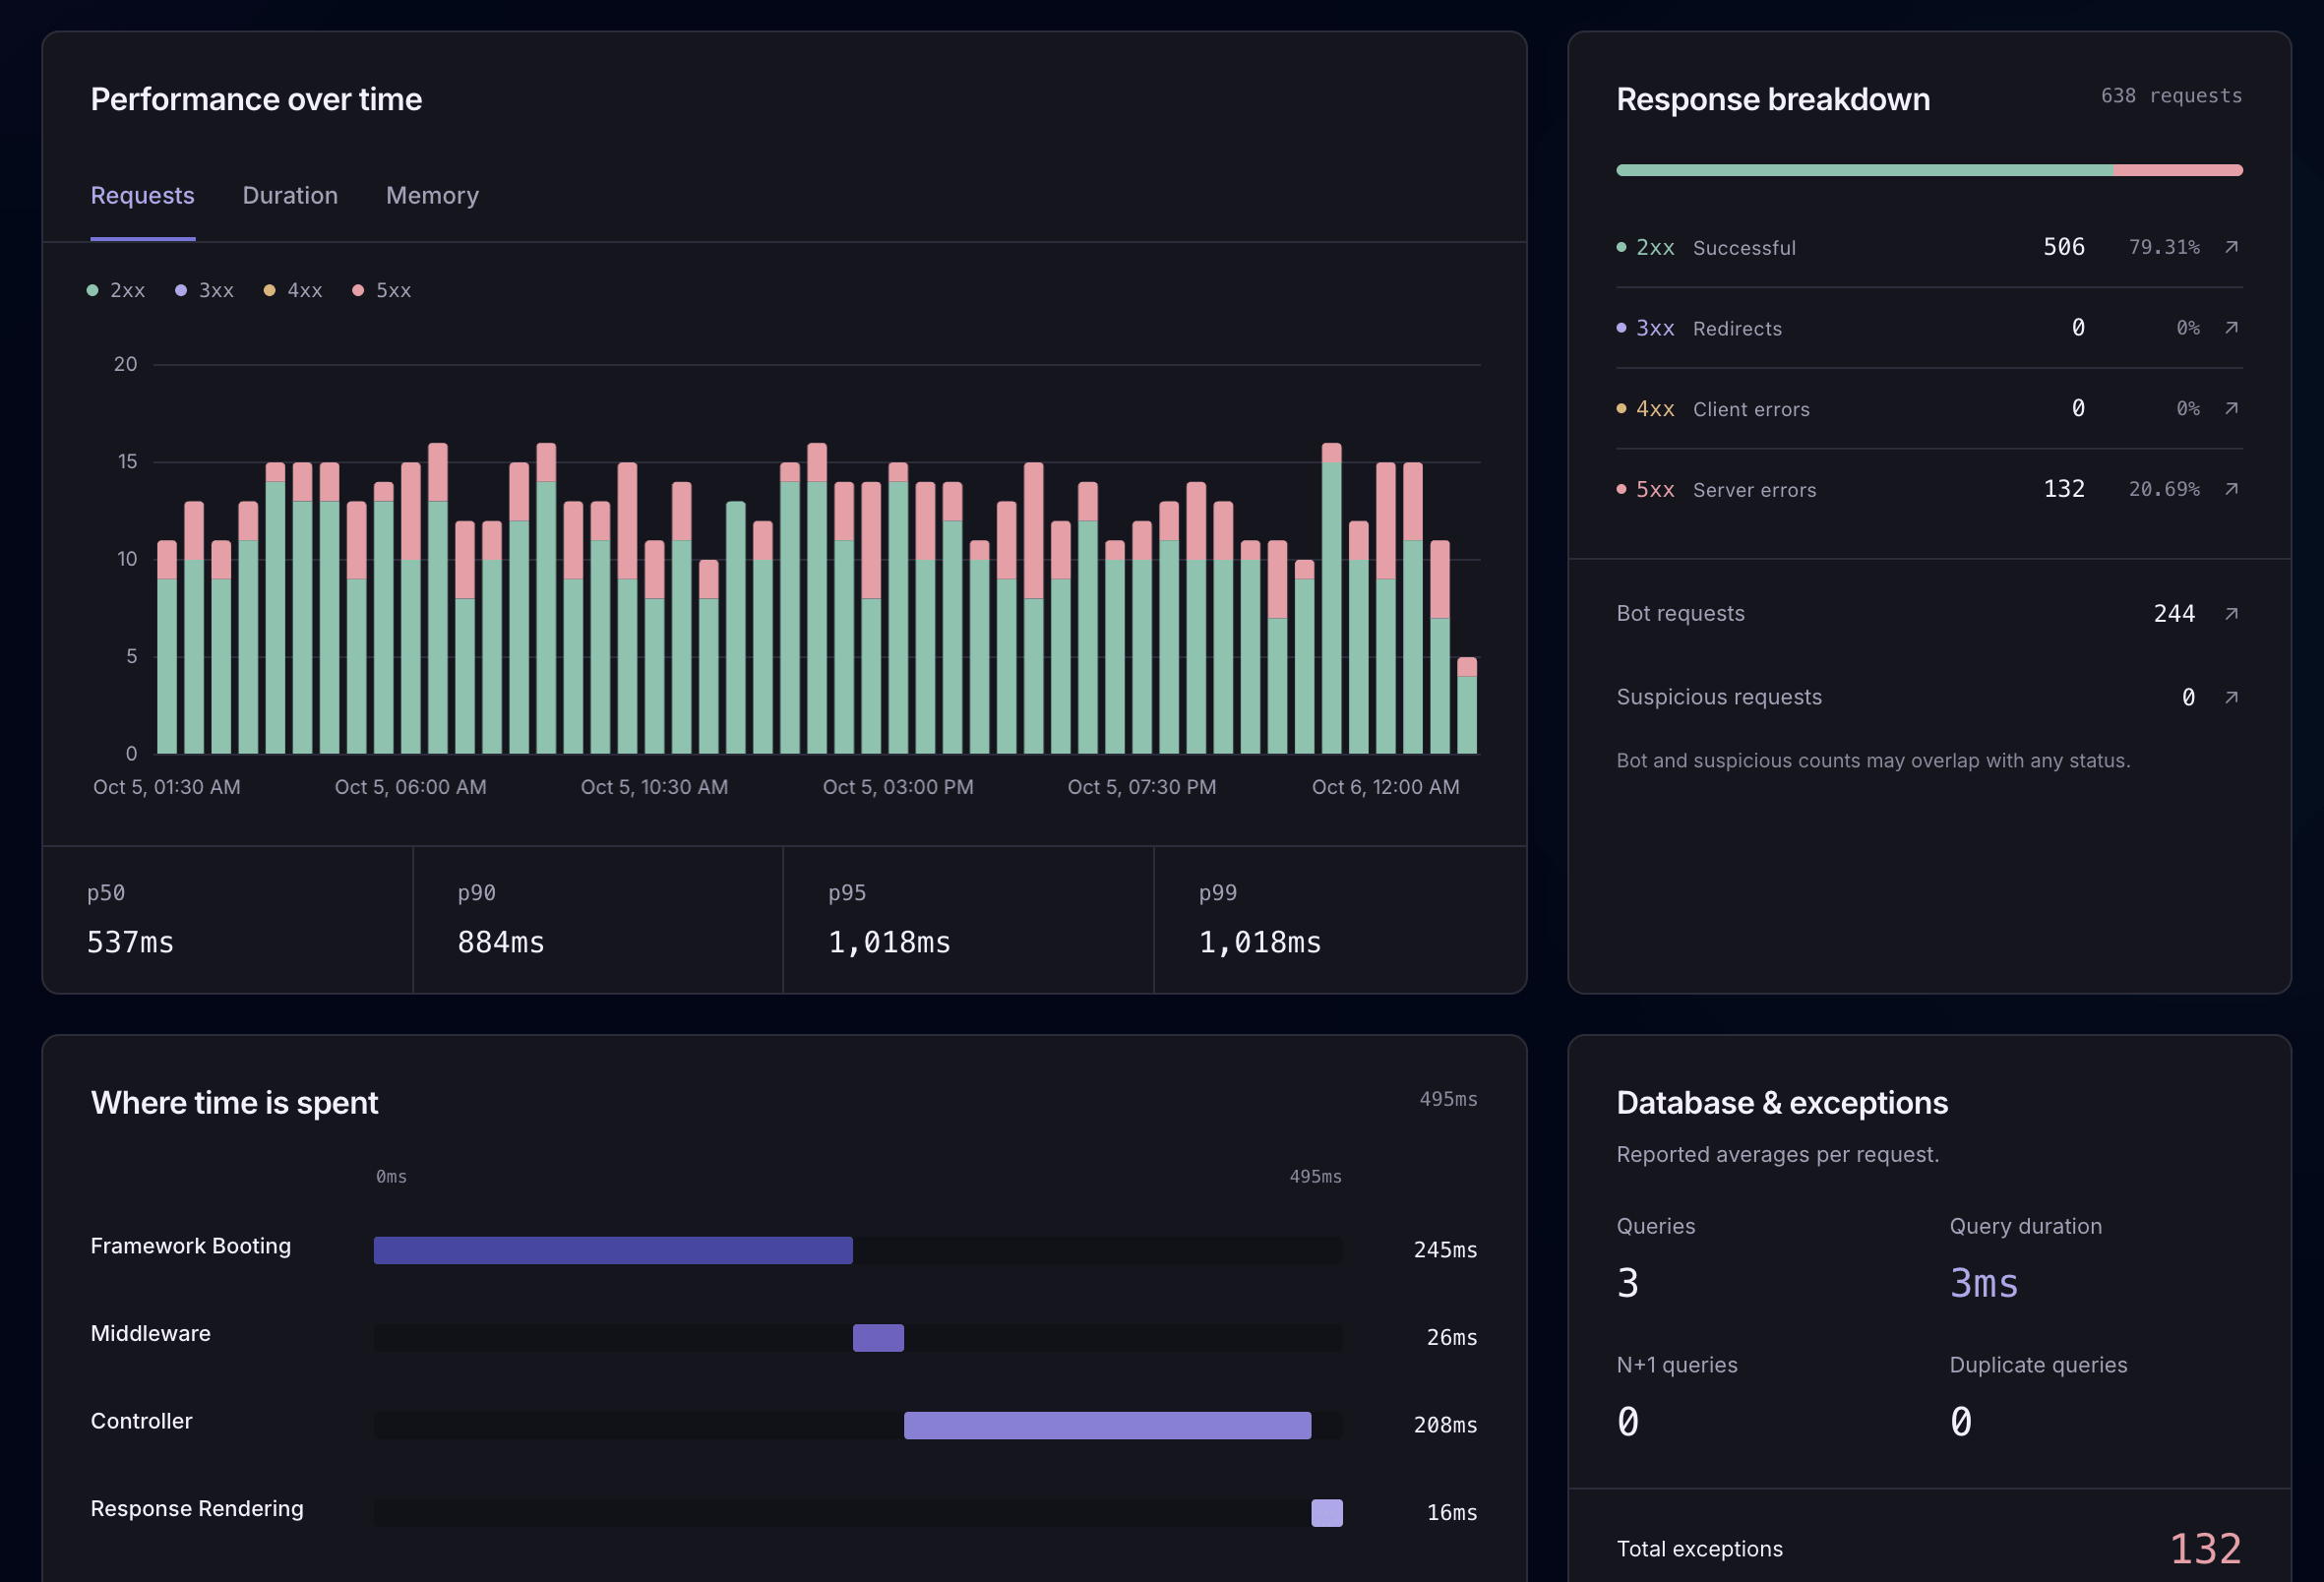
Request performance
Compare request volume, status codes, duration percentiles, and lifecycle timing. Open a retained request to inspect its recorded queries, logs, and API calls.
Uptrace also provides operation metrics, errors, waterfalls, and span attributes. Laritor adds configured Laravel content inspection and dedicated bot or suspicious traffic views.
Queue performance
Separate queue wait from job execution time. Inspect retained failures and configured payloads to understand why work is delayed or failing.
Uptrace’s Laravel guide demonstrates custom job spans. Laritor supplies dedicated jobs and queues, wait-time insights, payload inspection, and related recorded events without building that investigation from custom instrumentation.
Queries and server resources
Inspect slow and duplicate queries, then compare application activity with optional CPU, memory, and disk collection.
Uptrace combines SQL spans with broader database and host metric templates. Laritor adds dedicated Laravel query investigations and a schema explorer for tables, columns, and relationships.
Performance in context
Review request volume, status codes, duration percentiles, and where time is spent. Open a retained request to inspect its queries, logs, API calls, and other recorded events. Explore request monitoring
Move from an alert to the source line and the events that explain the failure.
Exception investigation
Open an exception group, source file, line, and full stack trace. Follow the retained request or job journey to inspect queries, logs, and other collected events.
Uptrace also groups exceptions with full stack traces and trace correlation. Laritor’s advantage is its ready-made Laravel workflow and exception recording preset, retaining related configured events for investigation.
API failures and command output
Enable the content you need to inspect outgoing payloads and responses, or read output from failed Artisan commands beside their recorded events. Redact sensitive fields before sending them.
Uptrace can trace HTTP and CLI work, while custom attributes and logs can carry more details. Equivalent automatic Laravel API-content and command-output resources are not listed.
AI and MCP
Use Laritor MCP to retrieve recorded exception details and execution events alongside your project’s code. In-app AI can recommend next steps with supported provider choices.
Uptrace also has MCP for querying telemetry and managing dashboards. Laritor’s hosted MCP focuses on retained Laravel exception context alongside in-app AI recommendations and supported provider choices.
Debug with your AI agent
Laritor MCP lets your agent retrieve exception details and the recorded execution timeline. It can inspect those events alongside your code to investigate the cause and work on a fix. In-app AI recommendations are available too.
Uptrace also has MCP for querying telemetry, inspecting alerts, and managing dashboards with a user token. Laritor’s read-only exception MCP provides retained Laravel context alongside in-app recommendations. Choose your in-app AI provider ↗
Read the Laritor MCP guide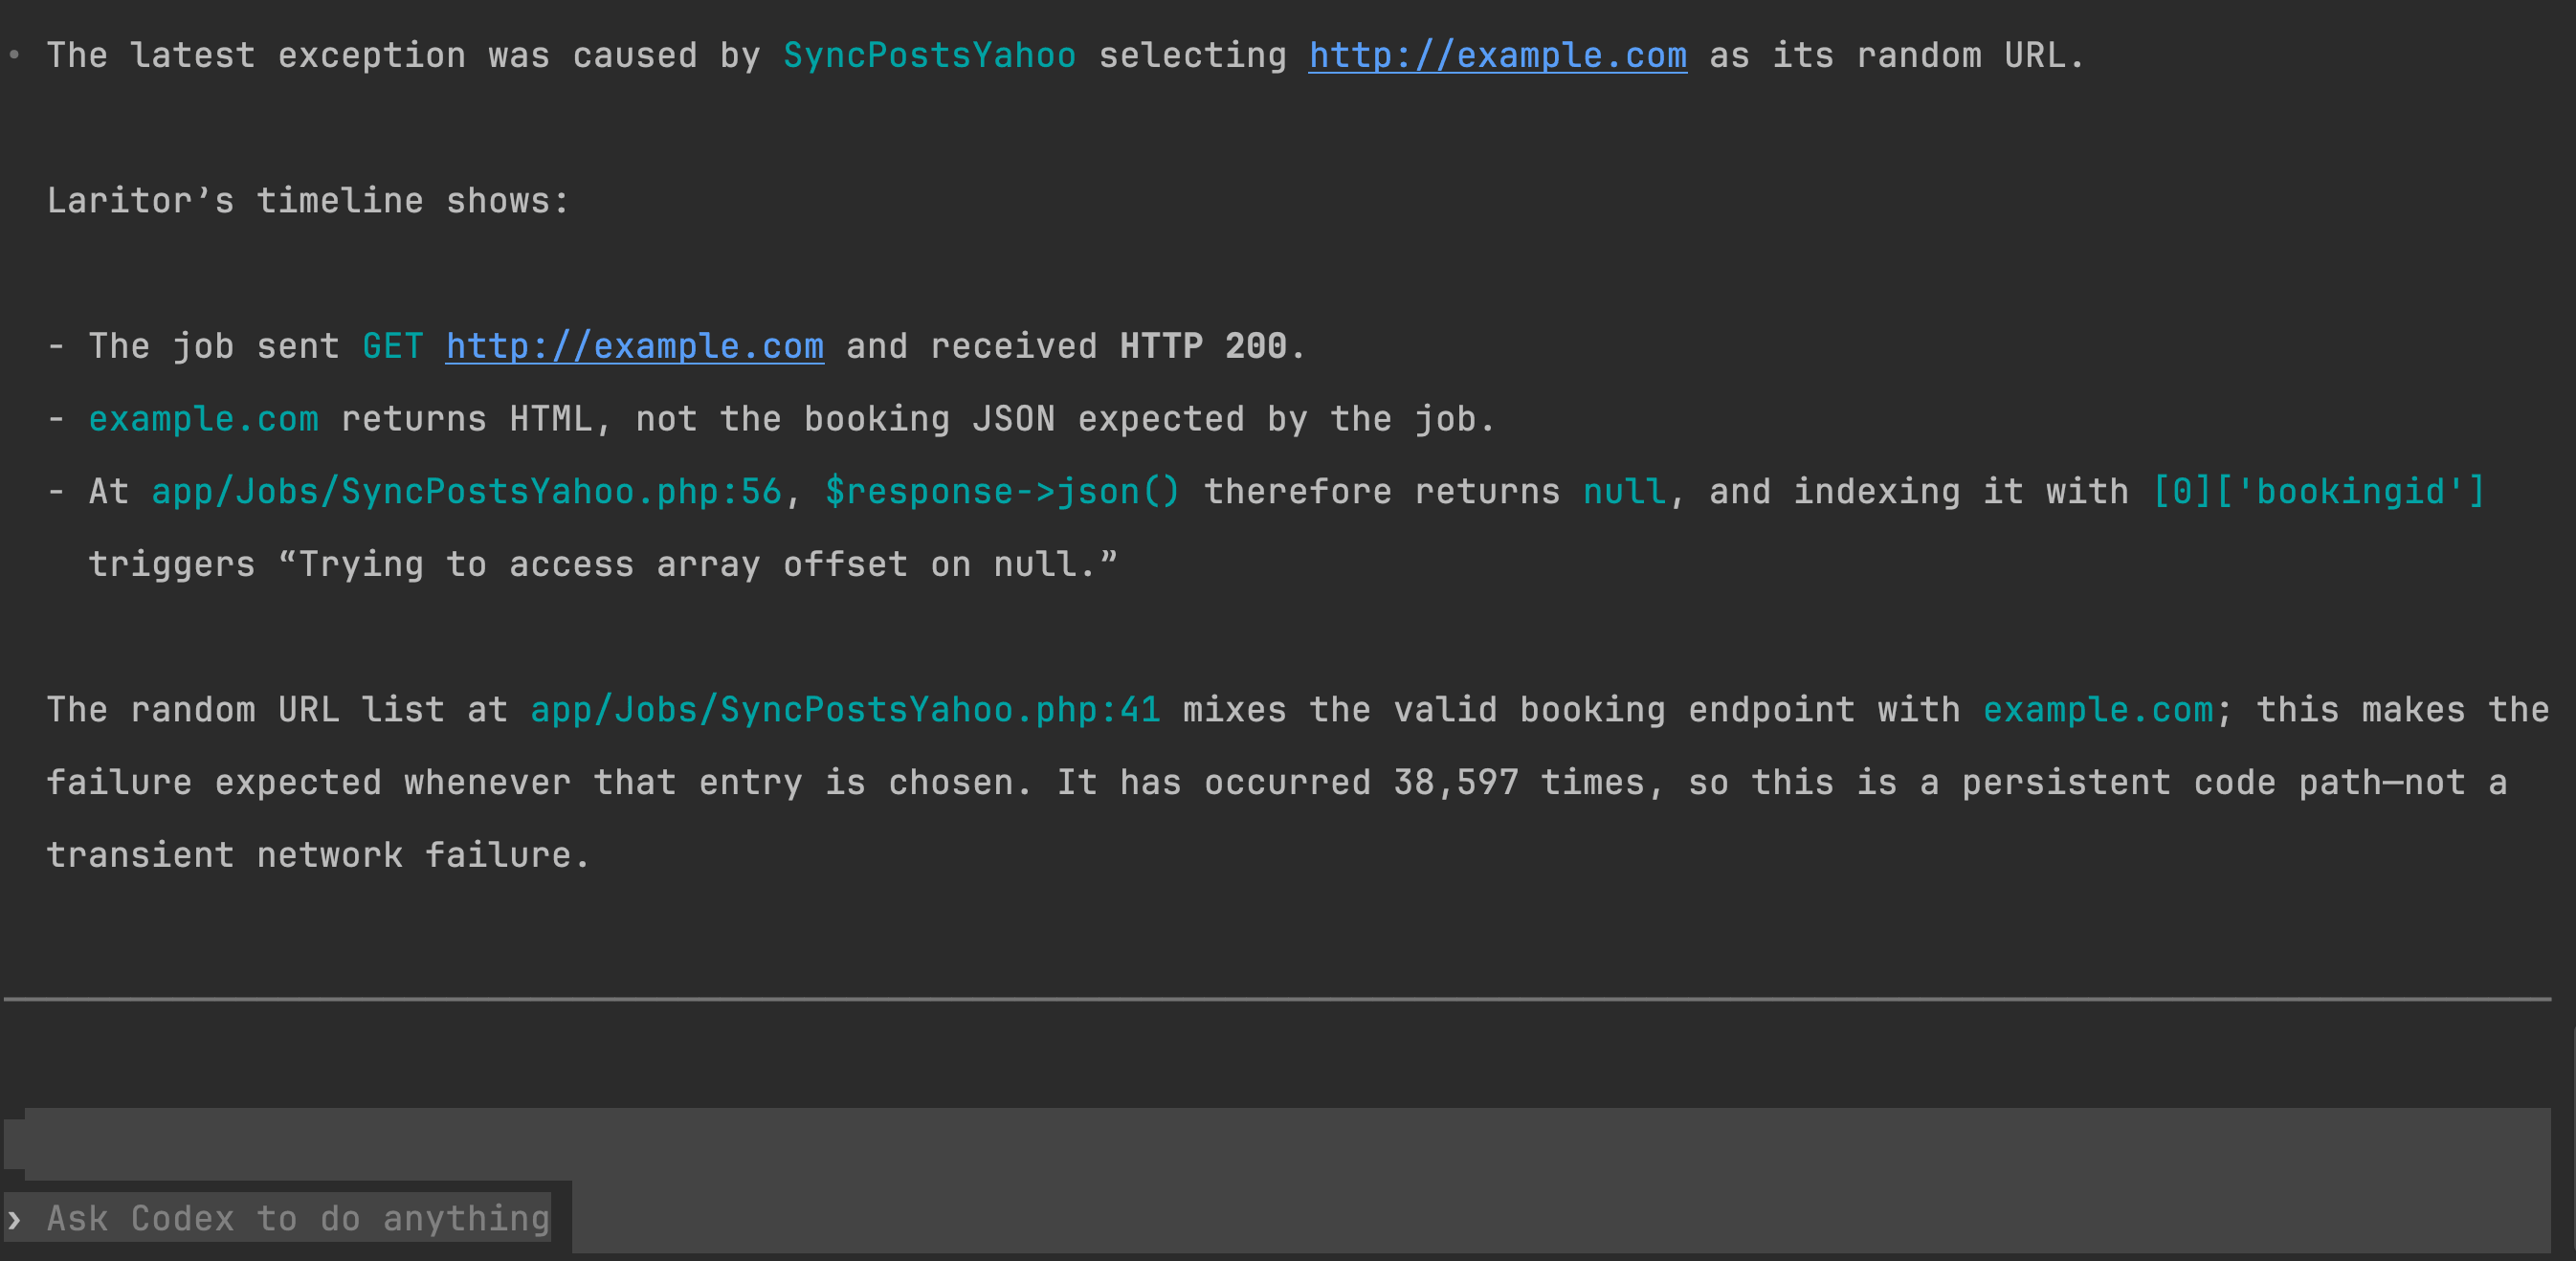
Follow customers, feature evaluations, and the milestones your team needs to debug.
Session journeys
Open a recorded Laravel session to inspect its retained requests. Add business milestones to see what the customer tried before an error.
Uptrace can query supplied user or session attributes across traces. Laritor provides dedicated backend Laravel session resources and configured session context for following recorded customer activity.
Feature flag performance
Inspect feature evaluations, activation, duration, and related failures. Review activity after a rollout through dedicated Laravel Pennant resources.
Uptrace supports custom spans, attributes, and metrics for business logic. An equivalent dedicated Laravel Pennant resource with automatic feature evaluation insights is not listed.
Business events
Record checkout milestones, payment attempts, pricing decisions, and debugging metadata as custom events. Inspect them within retained execution journeys.
Uptrace supports custom spans, events, attributes, logs, and business metrics. Laritor adds dedicated Laravel custom-event resources within retained execution journeys.
Build Laravel dashboards, share performance snapshots, and choose what to record.
Custom dashboards
Choose from 85+ Laravel widgets for traffic, errors, queues, and application performance. Create unlimited dashboards and share them with your team.
Uptrace also has custom dashboards, infrastructure templates, UI/YAML workflows, and MCP dashboard tools. Laritor’s distinction is its included 85+ Laravel widgets and dedicated application resources.
Scheduled PDF reports
Customize application reports delivered by email, and share PDF snapshots without requiring every teammate to log in.
Uptrace supports dashboard definitions and telemetry queries. Equivalent built-in delivery of customizable daily or weekly Laravel performance PDFs is not listed.
Recording and team costs
Keep exceptions and related events, expand to detected slow or failed work, or record all configured activity. Laritor’s paid plan uses one event allowance and includes unlimited apps and users.
Uptrace Cloud charges for telemetry volume, with separate metric datapoints and retention costs; its hosted service also includes unlimited users. Self-hosted editions have license and running costs. Compare measured usage, required detail, and hosting responsibilities.
Evaluate Laritor in your app
Use a representative app or environment to compare the details you receive, recording volume, and debugging workflow.
Create a Laritor account, install the Composer package, add your ingest endpoint and key, and run the sync command.
composer require binarybuilds/laritor-clientStart with exception tracker, issue tracker, or full observability. Register the generated filter, then review the data and privacy settings for your app.
Configure recording filtersInspect a known exception or slow execution, test alert delivery, and compare measured overhead and billable event usage. If you run both tools, include their combined collection work in your evaluation.
Explore exception investigationCreate your dashboards, choose alert channels, schedule reports, and connect AI. Keep access to your existing Uptrace history while Laritor builds a new record of your application’s activity. There is no documented automatic history import.
Explore Laritor guidesQuestions before switching
Laritor is a strong fit when you want ready-made Laravel exception tracking, issue detection, and performance monitoring with a Composer client. It adds dedicated resource views, recording modes, Pennant, backend sessions, widgets, PDF reports, and in-app AI. Uptrace suits wider OpenTelemetry stacks, distributed tracing, advanced metric queries, infrastructure monitoring, and teams that need a self-hosted backend.
Yes. Uptrace publishes Laravel auto-instrumentation and custom job, span, and metric examples using OpenTelemetry. Its documented auto-instrumentation setup uses a PHP extension and Composer packages; manual instrumentation is another option. Laravel native here means primarily designed for Laravel. Laritor has that focus, while Uptrace supports multiple languages and infrastructure signals.
Yes. Uptrace documents exception grouping, stack traces, trends, and trace correlation. Laritor provides Laravel exception groups, source file and line details, full stack traces, and retained execution events. The distinction is Laritor’s Laravel investigation and conditional recording workflow, not exclusive support for errors or stack traces.
No. Uptrace Cloud manages the backend and bills telemetry usage. Self-hosted Uptrace runs in your infrastructure with ClickHouse, PostgreSQL, and Redis, using Community or paid editions. Paid licenses and infrastructure costs are separate. Laritor is hosted, with backend storage included in its subscription. Compare the deployment you intend to use.
Yes. Exceptions-only keeps executions with an exception and their related configured events. Issues-only also keeps detected slow or failed work. Full observability records all configured activity. Uptrace supports trace-aware conditional sampling and error-preserving rules, so it also provides recording controls. An equivalent ready-made Laravel execution preset is not listed. Filtered Laritor metrics describe retained activity.
Yes. Its Laravel guide demonstrates custom spans around job processing and describes background-work monitoring. Coverage depends on instrumentation and worker configuration. Laritor adds dedicated queue/job views, wait-time insights, configured payloads, failures, and related execution events. Compare a real job to see the investigation detail you receive.
Yes. Uptrace dashboards can be built in the UI or defined in YAML using spans, events, logs, and metrics. It also provides templates and MCP dashboard management. Laritor includes unlimited dashboards and 85+ Laravel widgets. Its advantage is the ready-made Laravel widget library and resource context, not exclusive dashboard customization.
One execution count and average event count create a shared record scenario. Laritor prices billable events. Uptrace’s Cloud estimate uses that same count plus an editable average record size in bytes, converted with 1 GB equal to 1,073,741,824 bytes as in its current calculator. Paid span/log usage tiers were checked against its public estimator. Free credits, metric datapoints, extra retention, sampled-out data, networking, and self-hosted costs are excluded.
The current page advertises a free allowance and different starting-rate statements, while its live calculator returns paid tier thresholds and rates. This comparison uses the live estimator’s paid span/log tier calculation, without applying free credits or inventing a minimum bill. It is a planning example, not a quote. Confirm your account’s actual pricing and credits before buying.
No. It estimates the shared span/log record scenario only. Uptrace prices metric datapoints separately, with collection interval affecting the number of datapoints. Add those and any additional signals when comparing your actual invoice. Laritor’s allowance is shared across its billable event types. The calculator does not turn raw metric datapoints into identical Laritor events.
Laritor includes 30-day recorded-event retention. Uptrace Cloud’s current pricing FAQ says 28 days by default, with additional retention charges. Self-hosted Community lists 14 days; paid editions offer custom retention subject to your storage and terms. The calculator uses Cloud’s default history and excludes extended retention. A longer history needs a separate estimate.
The calculator shows Ask for a quote strictly above $500 per month. Exactly $500 remains numeric. Laritor’s modeled paid plan includes 20M billable events for $20 and adds $0.20 per started 100K above that allowance. Uptrace’s paid usage estimate continues to use its verified volume tiers.
Yes. Laritor’s hosted MCP supplies read-only exception details and retained Laravel execution context, alongside in-app AI provider choices. Uptrace’s MCP queries spans, traces, metrics, alerts, and monitors and can manage dashboards using a user token. Its dashboard tools can write changes, so review that user’s access. The available context and workflow differ.
Laritor has dedicated backend session resources and Pennant feature-flag insights. Uptrace can query user/session attributes, custom spans, and business metrics when you instrument them. Equivalent ready-made Laravel session-state and automatic Pennant resources are not listed. Laritor’s session view follows retained backend requests and custom events; it is not browser session replay.
Yes. Laritor records custom business events and metadata within retained Laravel execution journeys. Uptrace supports custom spans, events, attributes, logs, and metrics. Laritor adds a dedicated Laravel custom-event investigation workflow. Configure the milestones and debugging context that matter to your application.
Configure collection before exporting telemetry. Laritor can redact configured sensitive fields and disable optional content capture. Uptrace can use OpenTelemetry SDK/Collector filtering and redaction, plus configured transformations. Self-hosting controls residency but does not itself hide fields from teammates or connected AI. Review exported values and user access.
Yes. Keep your Uptrace instrumentation and install the Laritor client in a representative environment. Compare a known exception, slow request, job, alerts, measured overhead, and recorded usage. Uptrace can cover a wider stack while Laritor provides focused Laravel investigations. Verify compatibility with your PHP instrumentation and account for combined collection work.
An automatic Uptrace history import is not documented. Laritor begins recording after client installation and configuration. Keep existing Uptrace history or exports available for older investigations, then configure Laritor modes, dashboards, alerts, reports, and AI. Distributed telemetry and Laravel event resources need not have identical data models.
About this comparison
Published by Laritor, independently of Uptrace. Official Cloud pricing, self-hosted editions, Laravel/PHP instrumentation, exceptions, traces, logs, metrics, dashboards, infrastructure, alerting, transformations, Terraform, Grafana, source maps, and MCP guides were reviewed on . Features depend on instrumentation, configuration, edition, and hosting agreement.
“Laravel native” means primarily designed for Laravel. Uptrace supports Laravel through OpenTelemetry, including custom job spans and business instrumentation. It also groups exceptions with stack traces, provides custom dashboards, and supports trace-aware sampling and MCP. “Not listed” describes dedicated Laravel resources, rather than the ability to instrument code yourself. Optional Laritor content and server metrics need configured collection.
The calculator models paid Uptrace Cloud span/log usage with default 28-day history, before free allowances or credits. The current pricing page’s public estimator returns a $0.10/GB initial rate and automatic volume tiers, while page text advertises other starting rates and a free allowance. This example follows the live calculator’s paid tier calculation, checked on the date above, and invents no minimum monthly bill. Its GB unit is 1,073,741,824 bytes. Tier thresholds and bundled amounts are applied as returned by that estimator; estimates may decrease at a volume-tier boundary.
One retained execution count and related-event average drive both sides, with an explicit average Uptrace record-size assumption. Actual collected records and billed bytes can differ. Uptrace metrics, extended retention, sampled-out records, optional text indexing, cloud transfer, taxes, discounts, free credits, and self-hosted licenses/infrastructure are excluded. These are usage charges, not a complete invoice or a matching-feature guarantee. At higher volumes the last verified tier is continued as a planning assumption. Laritor prices above $500 require a quote; exactly $500 remains numeric. Confirm current rates, credits, history, and required features before purchasing.
Start with the data you need
Track exceptions, detect issues, and monitor performance.
Try Laritor with 300K events free.