
Laritor
Yes
Laritor vs Dynatrace
Laritor tracks exceptions, detects issues, and monitors Laravel performance. Inspect requests, jobs, queries, API calls, logs, and user sessions in one place. Choose what to record, give your team full access, and debug with in-app AI or your coding agent through MCP.
Published by Laritor · Comparison checked · View comparison notes
Designed primarily for Laravel. All tools compared here support Laravel.
Yes
No
Why choose Laritor over Dynatrace?
Dynatrace monitors applications and infrastructure across many languages, including PHP and Laravel. Laritor is built around Laravel: inspect a failed job, find a slow query, follow a user’s requests, or understand a Pennant rollout. Start with a Composer client and choose the activity you want to retain.
The full feature comparison
Compare 40 capabilities. See where Laritor gives you more, where Dynatrace has an advantage, and what both tools offer.
“Not listed” means an equivalent dedicated feature was not found in the public documentation reviewed. Custom instrumentation may meet that need. Dynatrace supports Laravel/PHP, SQL and HTTP timing, configurable context, custom business events, dashboards, AI, and MCP. Its PHP CLI deep monitoring is opt-in Early Access. Laravel-specific resources are compared separately from general telemetry capabilities.
Composer installation, Laravel queue views, payloads, Pennant insights, backend sessions, PDF delivery, and recording presets.
| Capability | Laritor | Dynatrace |
|---|---|---|
| Laravel Composer installation | Install inside Laravel Install the Laravel client without a native PHP extension or separate ingestion agent. | OneAgent automatically instruments supported PHP runtimes. OpenTelemetry is another collection route with its own instrumentation setup. |
| Three ready-to-use recording modes | Choose what to record Exception tracker issue tracker, or full observability. Retained executions include their related configured events. | Adaptive trace sampling, capture rules, and configurable retention. Equivalent Laravel exception/issue execution recording presets are not listed. |
| Application billing without an annual platform commitment | Plan around your app $20/month includes 20M billable events, all standard features, unlimited apps, and unlimited users. | DPS uses an annual minimum platform spend commitment. Full-Stack hosts, additional trace usage, logs, and other capabilities have separate consumption units. |
| Automatic Laravel Pennant insights | Understand your existing flags Dedicated flag evaluations, activation rates, timing, and related error views for Laravel Pennant. | Custom attributes and business events can describe flag state. Automatic Pennant instrumentation and a dedicated Laravel flag resource are not listed. |
| Laravel backend session journeys | Follow backend activity Follow retained requests in the same Laravel session with users and custom events. | RUM follows frontend user sessions and supports backend trace linking. An equivalent automatic Laravel server-session resource is not listed. |
| Configured Laravel request and response content | Read the request context Inspect optional incoming headers, payloads, response content, and related retained events. | Request attributes and business-event body capture on supported technologies, including webservers. An equivalent dedicated Laravel request/response resource is not listed. |
| Outbound Laravel API payload and response views | Find why API calls fail Inspect configured outbound headers, payloads, response content, status, and duration. | Supported PHP outgoing-call tracing and custom attributes. Documented OneAgent outgoing business-event body capture lists Java HTTP clients, not PHP. |
| Dedicated Laravel job payload inspection | Inspect a failing job Job payloads and execution details beside retained queries, logs, and API calls. | Opt-in Early Access PHP CLI monitoring and custom service detection. An automatic Laravel job payload resource is not listed. |
| Automatic Laravel queue performance views | Understand busy queues Job failures, throughput, dispatch delay, and wait time in dedicated Laravel queue views. | General messaging instrumentation and custom telemetry. Automatic Laravel Queue/Horizon wait-time and throughput resources are not listed. |
| Artisan command output capture | Read a failed command’s output Inspect recorded command output, exceptions, and related execution events. | PHP CLI deep monitoring requires opt-in configuration. Automatic Artisan stdout collection in a dedicated execution resource is not listed; logs can be collected separately. |
| Dedicated Laravel scheduler views | Inspect scheduled work Inspect scheduled executions, failures, timing, and related recorded activity. | CLI monitoring, custom services, and alerts can describe scheduled work. A dedicated Laravel scheduler execution resource is not listed. |
| Laravel mail and notification resources | Investigate delivery activity Inspect recorded mail and notification activity within retained requests and jobs. | Custom tracing and log analytics can describe delivery. Dedicated Laravel mail and notification resources are not listed. |
| Custom health checks written in Laravel | Check from inside the app Run built-in or custom PHP dependency checks inside the app with result history and alerts. | Synthetic HTTP/browser tests and infrastructure checks cover availability. An equivalent Laravel PHP health-check resource is not listed. |
| Choose your in-app AI provider | Choose how you debug Included recommendations or your preferred supported provider and model, plus read-only exception MCP context. | Dynatrace Intelligence, Assist, and a hosted MCP server. An equivalent in-app provider selector is not listed; AI availability and metering depend on capability and access path. |
| Daily and weekly PDF report delivery | Receive application snapshots Custom application snapshots delivered by email as shareable PDF reports. | Classic dashboards offer weekly/monthly email links and manual PDF printing. Equivalent built-in daily/weekly PDF attachment delivery is not listed in the reviewed dashboard guides. |
| Laravel backend bot traffic views | Understand request traffic Inspect bot and suspicious request activity alongside Laravel performance, with recording filters. | RUM can exclude robots, spiders, and selected IP addresses. Equivalent dedicated Laravel backend bot analytics are not listed. |
Multi-language monitoring, distributed tracing, frontend replay, infrastructure, synthetics, profiling, database operations, root-cause analysis, and wider MCP tools.
| Capability | Laritor | Dynatrace |
|---|---|---|
| Monitoring across languages and services | Designed around Laravel applications. | Multi-language monitoring across PHP, Java, Go, Python, .NET, Node.js, and other supported technologies. |
| Distributed tracing across service boundaries | Laravel execution timelines and outbound call context. | Distributed traces across supported services and OpenTelemetry, with frontend-to-backend linking. |
| Browser and mobile session replay | Backend Laravel requests, sessions, users, and custom events. | Frontend RUM and visual Session Replay on supported web/mobile technologies with client instrumentation. |
| Kubernetes and wider infrastructure | Optional Laravel host CPU, memory, and disk collection. | Dedicated monitoring for hosts, VMs, processes, containers, Kubernetes, clouds, and networks. |
| External synthetic user journeys | PHP dependency checks run inside Laravel. | Scripted browser journeys and HTTP availability checks from synthetic monitoring locations. |
| PHP method-level profiling | Recorded execution timing and query investigation. | PHP response hotspots, method call hierarchies, execution/compile timing, and CPU profiling on supported runtimes. |
| Deep database operations monitoring | Query events and a Laravel schema explorer with tables, indexes, columns, and relationships. | Database health, resource metrics, waits, blocking/deadlocks, indexes, and execution plans where supported by the database extension. |
| OpenTelemetry collection ecosystem | Laravel-specific client and event resources. | Direct OTLP ingestion, standard collectors, and a supported Dynatrace OTel Collector across multiple telemetry signals. |
| Topology-based root-cause analysis | Exception context, execution timelines, issue detection, and AI recommendations for Laravel. | Dynatrace Intelligence correlates anomalies and dependencies across the stack to identify likely causes and affected entities. |
| Selective long-term trace retention | 30-day event retention on the standard plan. | Ten days included for traces, with configurable extended retention up to ten years at additional storage rates. |
| Broader operational MCP tools | Focused read-only exception details and retained Laravel execution context. | Hosted MCP tools for Grail queries, problem investigation, vulnerabilities, forecasts, and other operational data. Tool availability and permissions vary. |
Both offer Laravel performance and exception investigation, logs, SQL, custom events, dashboards, host metrics, privacy controls, alerts, unlimited users, AI, and MCP.
| Capability | Laritor | Dynatrace |
|---|---|---|
| Laravel exception investigation | Grouped exceptions, stack traces, file/line, and retained execution context. | PHP error/exception detection, configurable service failure rules, and trace investigation. The investigation views and collection rules differ. |
| Request performance monitoring | Request durations, percentiles, status codes, failures, and related recorded events. | Supported Laravel/PHP request monitoring, response timing, service failures, and trace analysis. |
| SQL query timing | Queries, SQL, bindings, timing, and retained context with collection controls. | Supported PHP PDO, MySQLi, and other database instrumentation with SQL timing and request context. |
| Outbound HTTP timing | Outgoing calls linked to the request or job that made them. | Supported PHP cURL and SOAP outgoing-call instrumentation and distributed trace context. |
| Redis and cache activity | Recorded Laravel cache and Redis events in retained executions. | Redis/Predis and Memcached instrumentation. General datastore spans and Laravel cache resources use different views. |
| Application log collection | Search recorded logs and inspect related request/job events. | Configured log collection with analytics and application correlation. Log ingest, storage, and queries have separate rates. |
| Custom business context | Named custom events with metadata, timing, dedicated views, and widgets. | Custom business events, request attributes, SDK tracing, and OpenTelemetry can describe application operations. |
| Customizable dashboards | Unlimited dashboards built from 85+ Laravel widgets. | Custom dashboards with visual exploration, configurable tiles, layouts, variables, DQL, and code functions. |
| Host CPU, memory, and disk | Optional scheduled host collection and server charts. | Host resource metrics through Infrastructure or eligible Full-Stack monitoring. |
| Alerts and notification integrations | Exception and issue alerts through configured delivery integrations. | Problem alerts, integrations, notification rules, and workflow-based delivery. |
| Sensitive data and collection controls | Client-side redaction, resource settings, recording filters, and sampling. | OneAgent-side privacy masking, configurable capture rules, confidential attributes, and log controls. |
| Unlimited user access | Unlimited users on the standard plan. | DPS includes unlimited seats without per-user fees. Permissions determine data and tool access. |
| In-app AI and MCP | In-app recommendations, supported provider choices, and exception context through MCP. | Dynatrace Intelligence/Assist and a hosted MCP server. Tools, availability, permissions, and AI billing vary. |
Major difference
Laritor gives Laravel developers direct access to application problems without an environment-wide monitoring rollout. Start with the Composer client and investigate the recorded work your app performs.
Laritor does not require a OneAgent deployment for application event monitoring. Dynatrace’s OneAgent route adds host and process monitoring configuration to your setup.
Use dedicated queue wait, schedule, backend session, Pennant, and custom event views. Dynatrace’s broader discovery and topology workflow does not offer the same ready-made Laravel resource organization.
Use Laritor’s 85+ widgets and scheduled PDF reports to keep teammates informed. Your team can monitor the Laravel application without first configuring an estate-wide observability workflow.
Why choose Laritor over Dynatrace?
Inspect the data behind a problem, follow backend session journeys, review feature flags, and give every teammate access to the same Laravel monitoring workspace.
20M billable events, unlimited apps and users, and 30-day retention. Choose exceptions, detected issues, or all activity without a separate error or log quota.
Laritor bills for recorded events. Dynatrace DPS combines an annual platform commitment with usage-based capabilities. Compare a Full-Stack host and trace scenario below, extended to 30 days of trace retention.
Cost calculator
Use one workload estimate for both tools. Compare Laritor with Dynatrace Full-Stack usage on physical or VM hosts, including a 30-day trace retention scenario.
20,000,000 billable events
3 hosts · 24 billable GiB · 38.15 GiB trace ingest
2,673.34 GiB eligible trace allowance in this constant-traffic scenario.
Dynatrace requires an annual minimum platform spend commitment. This is a consumption estimate, not a subscription quote. Its contract minimum is excluded. Native OneAgent normally samples traces to stay within its allowance; this scenario models eligible enriched or explicitly extended trace ingest. Logs, other products, billed DQL scans, and AI usage are excluded.
Published DPS rates: $0.01 per memory-GiB-hour, $0.20/GiB additional trace ingest, and $0.0007/GiB-day extended retention. Host RAM is rounded up to 0.25 GiB with a 4 GiB minimum. Eligible Full-Stack trace allowance is 200 KiB/minute per billable GiB, with a 64,000 KiB/minute environment minimum. Allowances expire every 15 minutes; this estimate assumes constant traffic during the monitored hours, identical hosts, and properly enriched traces qualifying for that allowance. Bursts and unenriched/external spans can increase ingest charges. Ten days of trace storage are included. The 30-day estimate adds 20 days of storage at steady state and assumes stored uncompressed bytes equal ingest bytes; processing and first-month buildup can change retention costs. Services and Distributed Tracing app analyses are included; other billable DQL scans are excluded. Shared volume = executions × average events, rounded up; trace GiB = shared volume × KiB ÷ 1,048,576. These vendor records are not interchangeable. Measure actual counts and sizes. Contract commitments, negotiated rates, autoscaling, container/serverless pricing, additional telemetry, products, and taxes are excluded. Laritor adds $0.20 per started 100K billable events above 20M and shows “Ask for a quote” above $500.
Choose recording rules and investigate using resources your team already understands.
Laravel installation
Install Laritor’s Composer package, configure your endpoint and key, run the sync command, and choose a recording filter. Collection happens inside Laravel.
Dynatrace OneAgent automatically instruments supported PHP runtimes and discovers a wider stack. OpenTelemetry provides another route. Laritor keeps setup centered on your Laravel application.
Recording controls
Exceptions-only retains configured events from executions containing exceptions. Issues-only captures detected problems such as failed jobs or slow requests. Full observability records all configured activity.
Dynatrace offers adaptive sampling and other capture controls. Laritor makes these three Laravel monitoring needs ready-to-use recording choices.
Application dependencies
Write a PHP health check for the dependency your application needs. Review its history and alerts alongside your application data.
Dynatrace synthetic tests check availability and user journeys from outside the application. Laritor’s checks tell you whether a dependency works from inside your Laravel app.
Read the data that explains a failed request, job, or command.
Outgoing requests
A service can return a successful status with unexpected content. Laritor can retain the configured outgoing payload and response beside queries, logs, and exceptions.
Dynatrace traces supported PHP outgoing calls and supports custom attributes. Its documented OneAgent outgoing business-event body capture lists Java clients rather than PHP. Laritor provides dedicated Laravel API content views.
Jobs and commands
Inspect a job’s recorded payload or a command’s output, then follow the queries, logs, and API calls from that execution. Review queue throughput and wait time in Laravel-specific views.
Dynatrace PHP CLI deep monitoring is an opt-in Early Access feature with process and custom service rules. Equivalent automatic Laravel Queue/Horizon payload and wait-time resources are not listed in the reviewed guides.
AI debugging
Use Laritor’s recommendations or choose a supported AI provider and model. Give your coding agent read-only exception and retained execution context through Laritor MCP so it can investigate alongside your code.
Dynatrace also offers an in-app assistant and a hosted MCP server, with wider operational tools. Laritor focuses on Laravel exception context and your choice of in-app provider.
Debug with your AI agent
Laritor MCP lets your agent retrieve exception details and the recorded execution timeline. It can inspect those events alongside your code to investigate the cause and work on a fix. In-app AI recommendations are available too.
Both tools offer in-app AI and MCP. Laritor provides focused read-only exception context and lets you choose your in-app provider. Dynatrace Intelligence and its hosted MCP cover a wider operational scope. Tool availability, access, and AI metering depend on configuration. Choose your in-app AI provider ↗
Read the Laritor MCP guide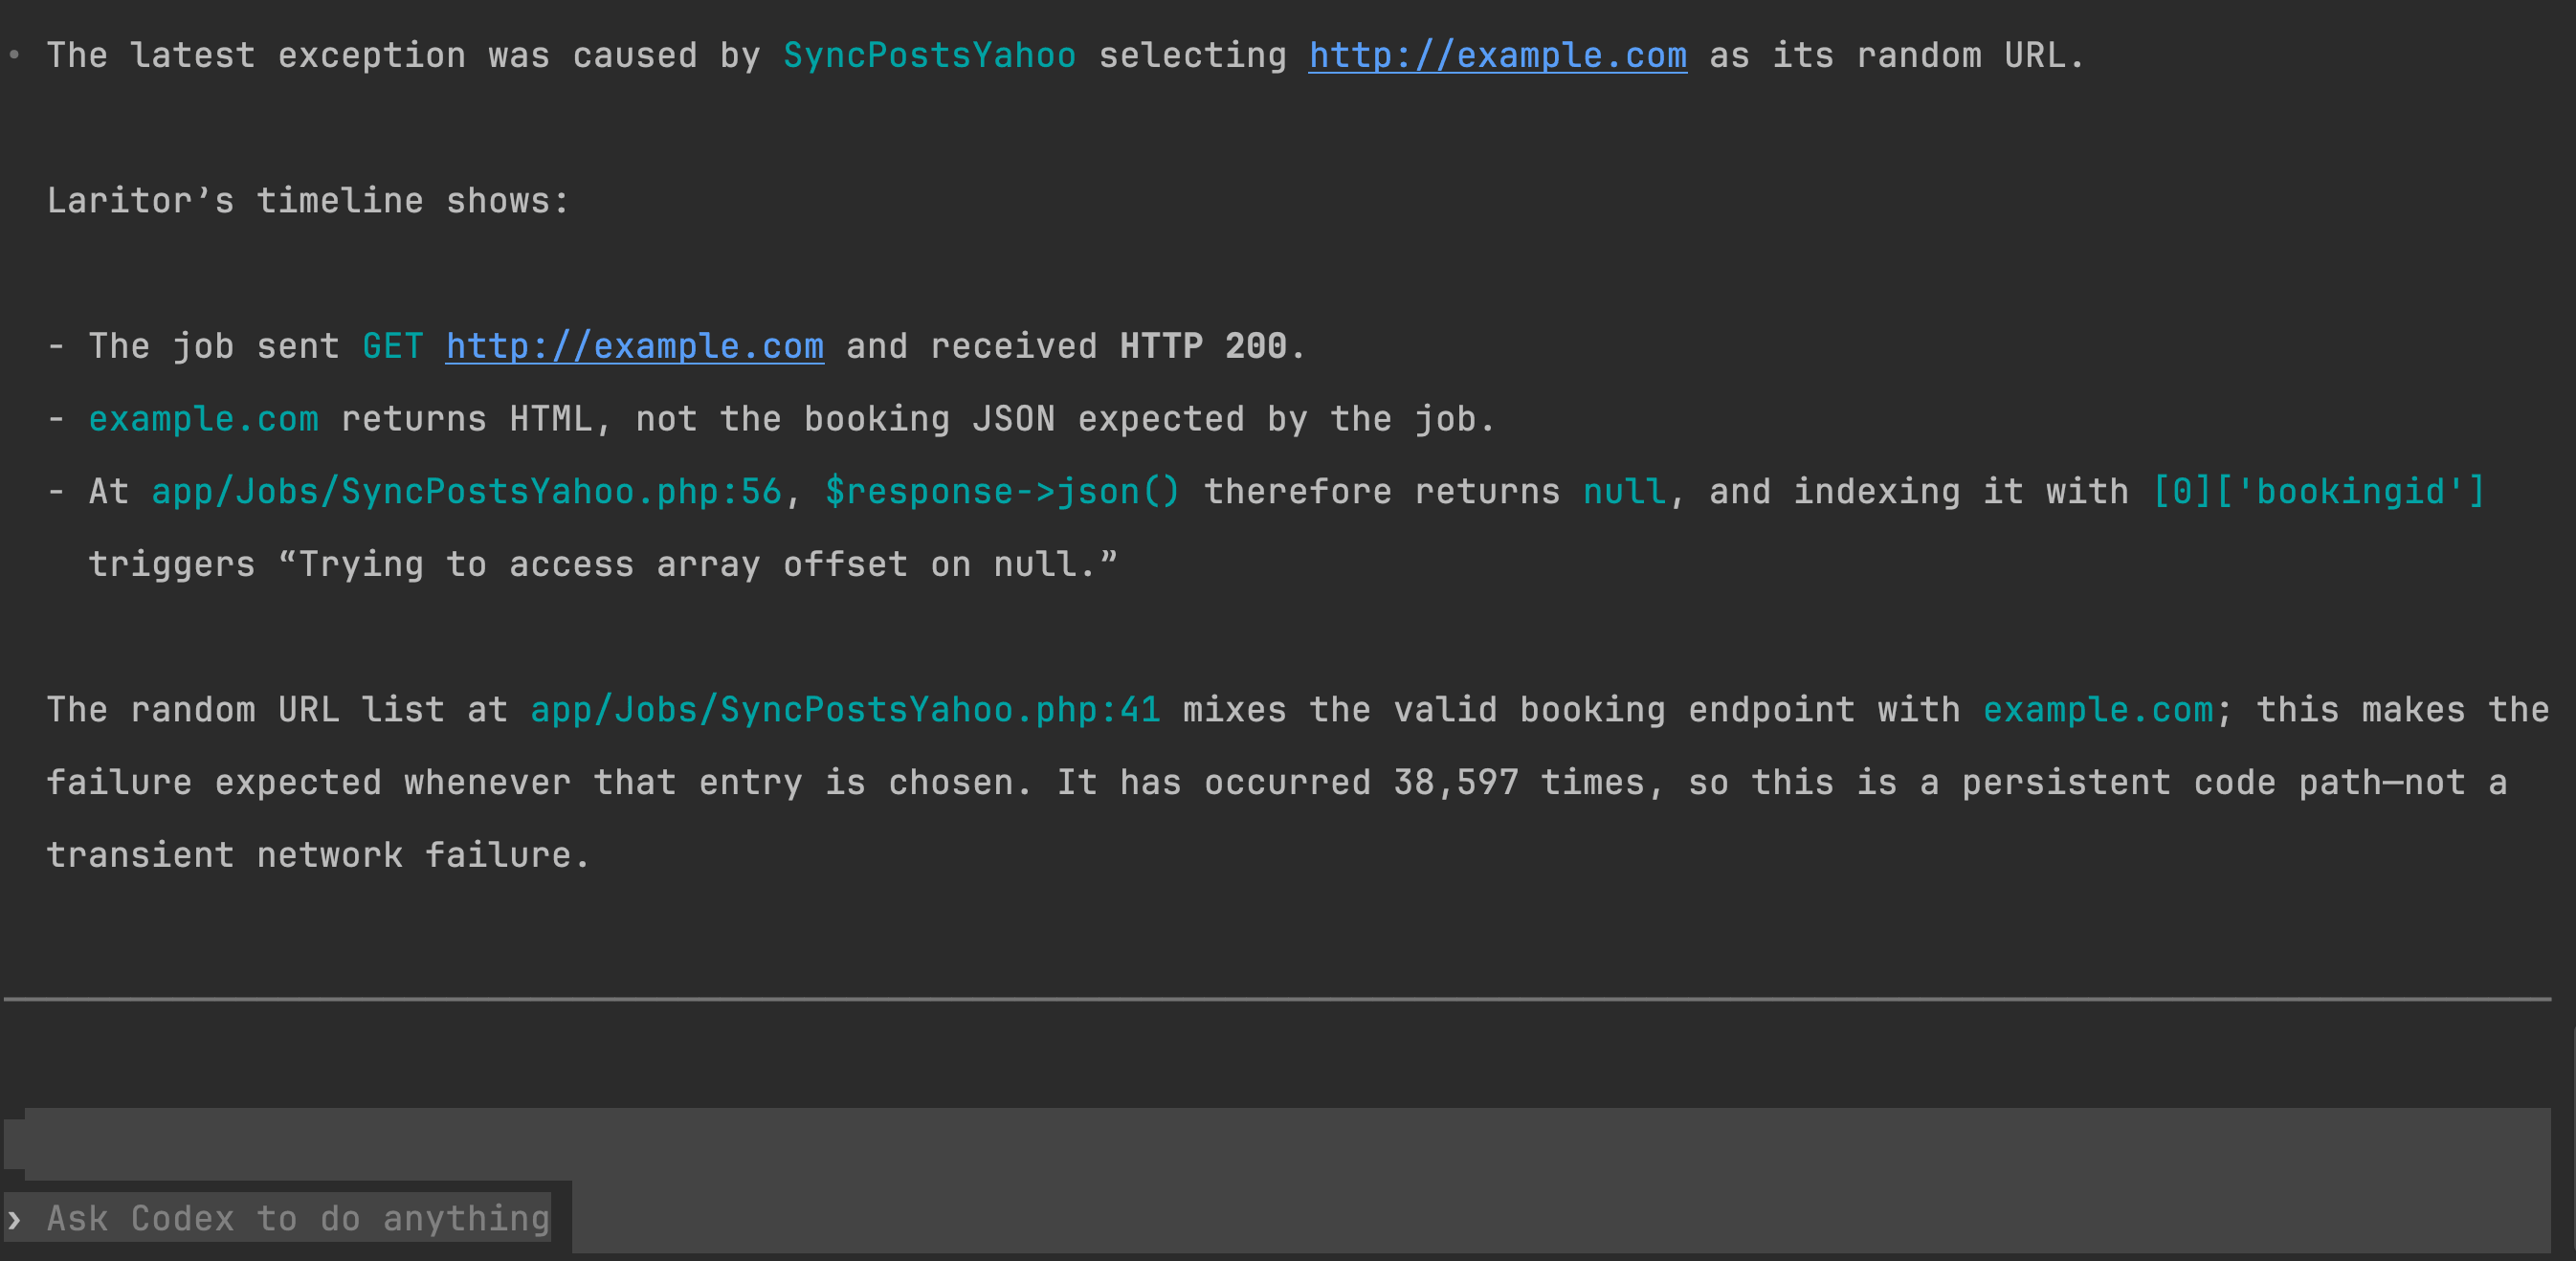
Follow requests, backend sessions, queues, and feature evaluations through dedicated views.
Session journeys
Open a Laravel session to inspect its retained requests. Add custom events for a checkout attempt, payment result, or subscription change, then drill into the execution behind each step.
Dynatrace RUM and Session Replay follow frontend activity and can link it to backend traces. Laritor’s session view is organized around Laravel’s backend session and recorded events.
Laravel feature flags
Review Laravel Pennant evaluations, activation rates, timing, and related errors without building a custom telemetry model for each flag.
Dynatrace request attributes and business events can carry flag state. An equivalent automatic Pennant resource with dedicated Laravel flag performance views is not listed.
Custom events
Record named events and debugging metadata for application steps such as order validation, pricing decisions, or payment attempts. Inspect them inside retained execution journeys and dedicated event views.
Dynatrace also supports custom business events, SDK instrumentation, and OpenTelemetry. Laritor places those business milestones within its Laravel monitoring workflow.
Performance in context
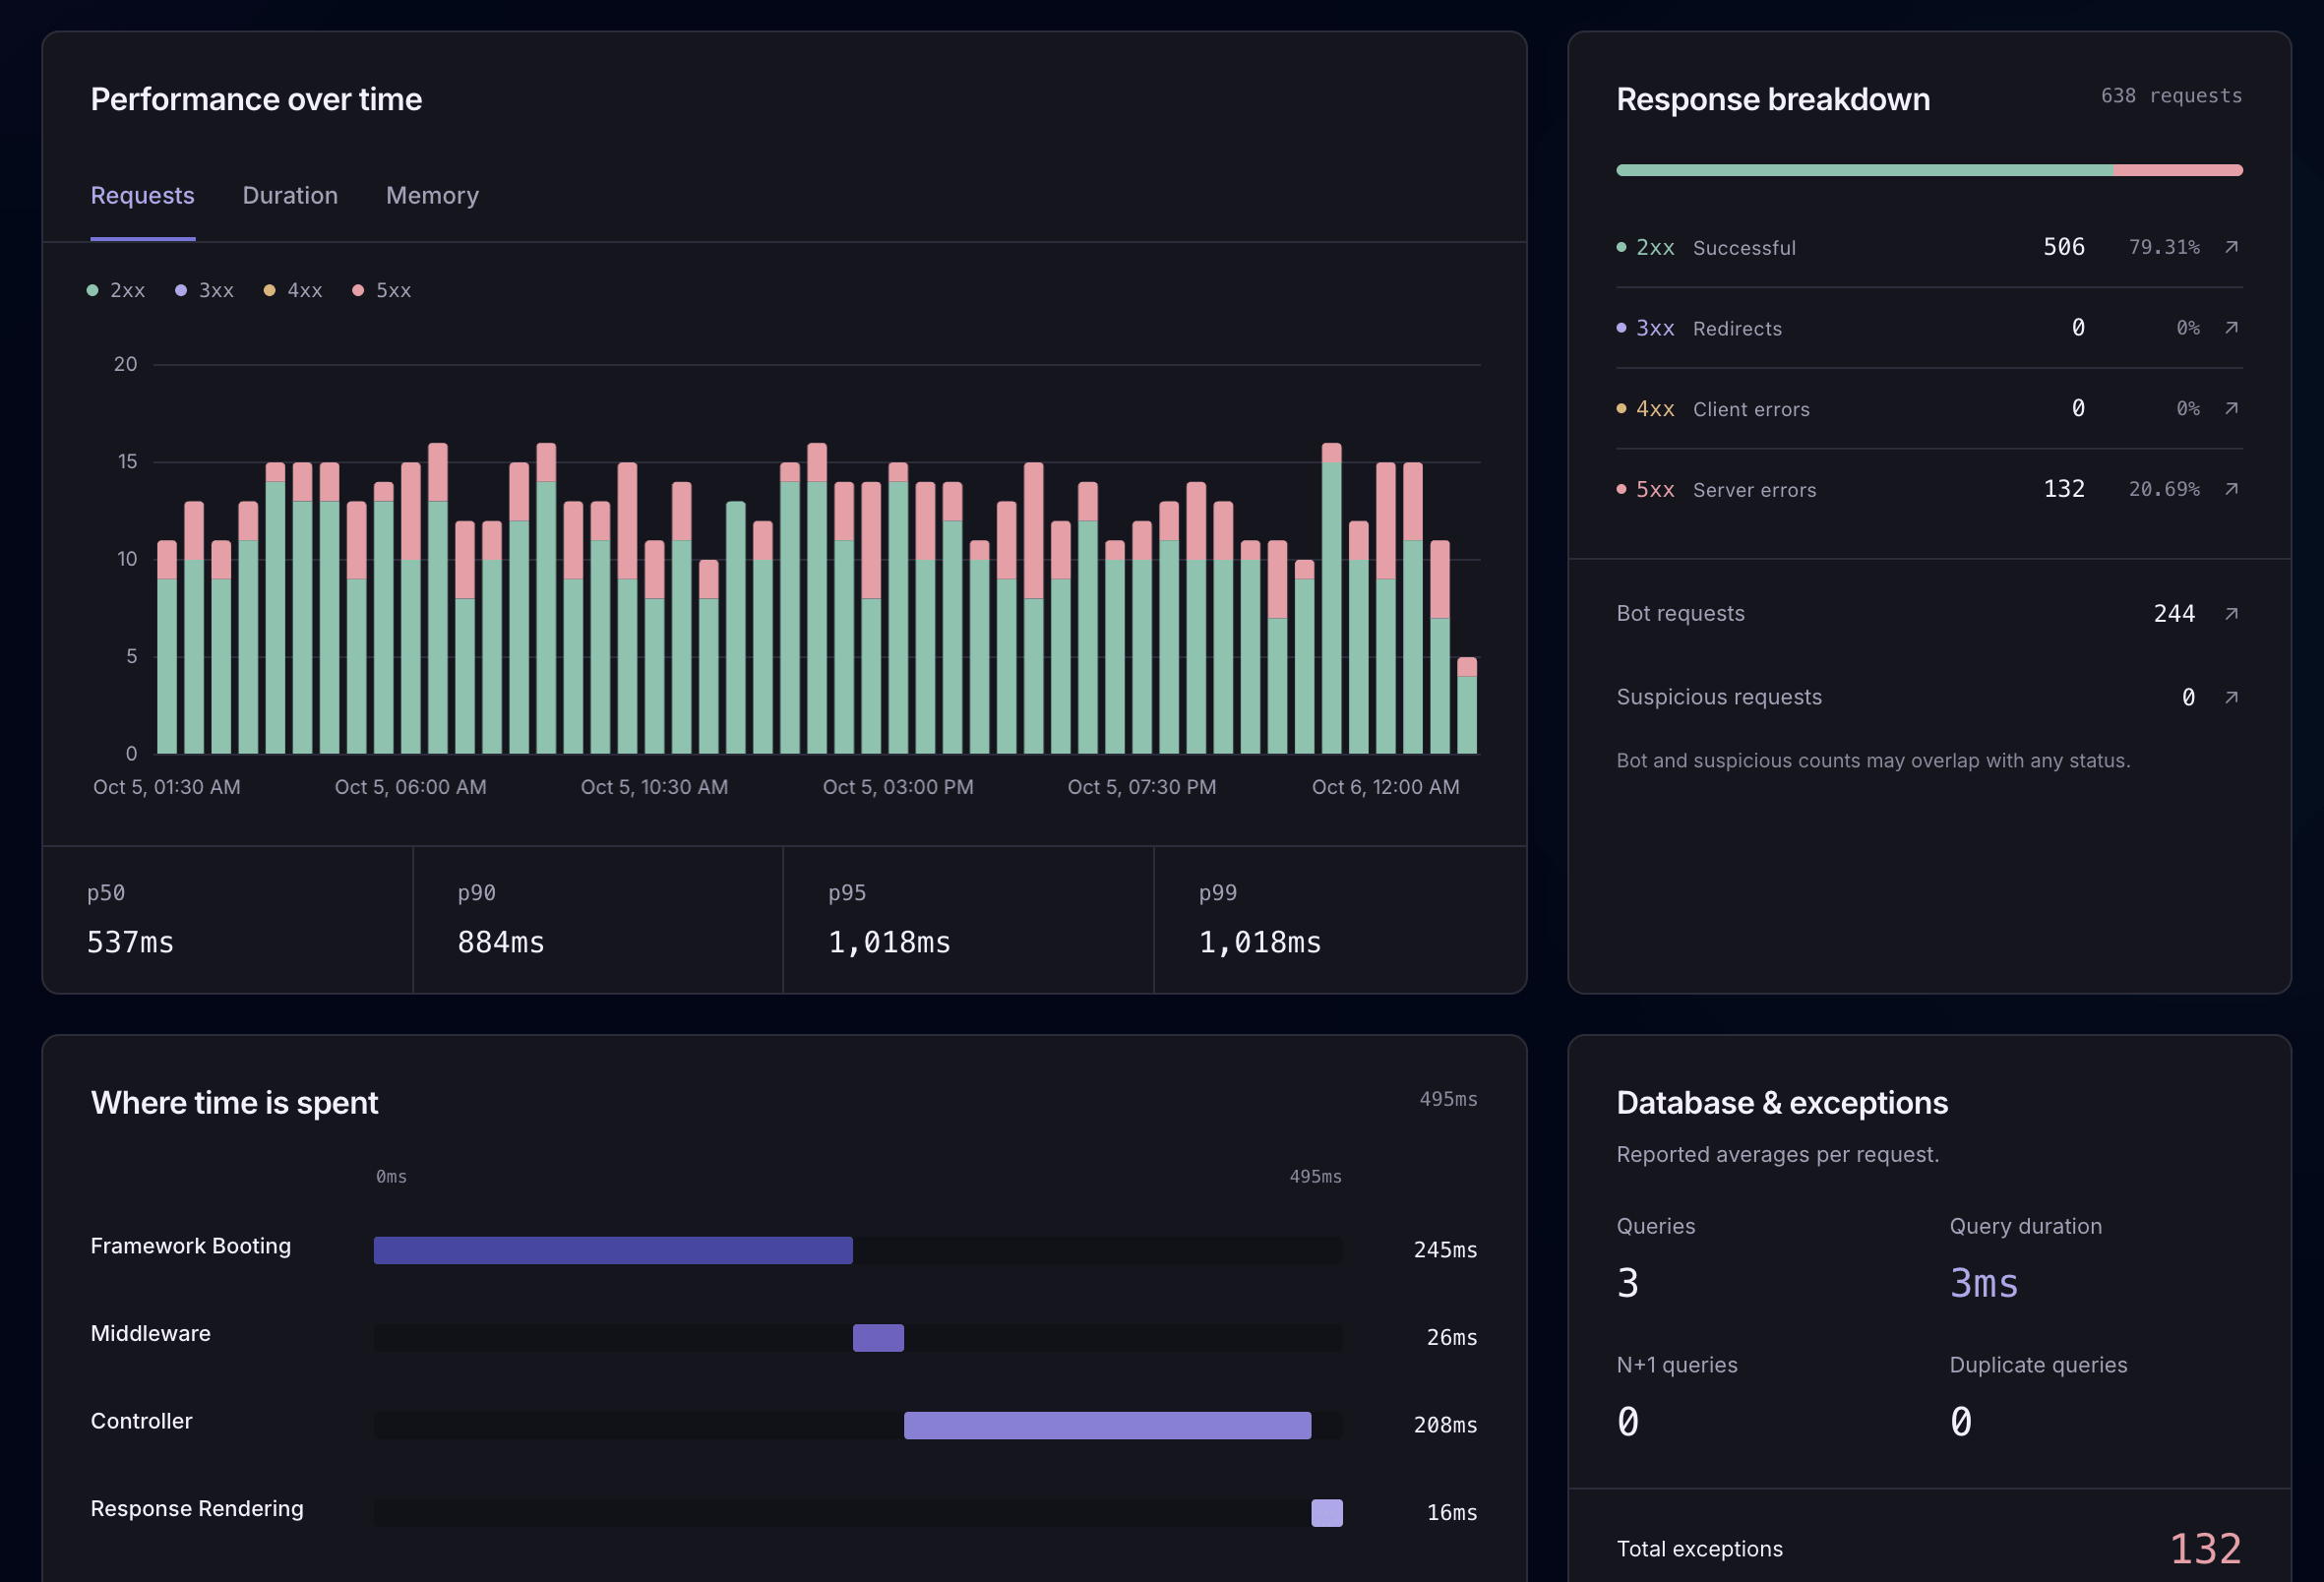
Review request volume, status codes, duration percentiles, and where time is spent. Open a retained request to inspect its queries, logs, API calls, and other recorded events. Explore request monitoring
Build useful application views and receive snapshots without opening the monitoring app.
Custom dashboards
Choose from 85+ Laravel widgets and create dashboards for your application, queues, traffic, or feature rollout. Share the monitoring workspace with unlimited teammates.
Dynatrace also offers customizable dashboards, visual exploration, DQL, and unlimited DPS seats. Laritor’s advantage is its ready-made Laravel widget library and application-focused workflow.
Scheduled reports
Schedule a custom application performance report by email. Keep tabs on your app without signing in, or share its PDF snapshot with teammates.
Dynatrace Classic offers weekly/monthly email links to reports and manual dashboard PDF printing. The reviewed guides do not list equivalent built-in daily/weekly PDF attachment delivery. Custom automation may meet that need.
Evaluate Laritor in your app
Use a representative app or environment to compare the details you receive, recording volume, and debugging workflow.
Create a Laritor account, install the Composer package, add your ingest endpoint and key, and run the sync command.
composer require binarybuilds/laritor-clientStart with exception tracker, issue tracker, or full observability. Register the generated filter, then review the data and privacy settings for your app.
Configure recording filtersInspect a known exception or slow execution, test alert delivery, and compare measured overhead and billable event usage. If you run both tools, include their combined collection work in your evaluation.
Explore exception investigationCreate your dashboards, choose alert channels, schedule reports, and connect AI. Keep access to your existing Dynatrace history while Laritor builds a new record of your application’s activity. There is no documented automatic history import.
Explore Laritor guidesQuestions before switching
Laritor is a strong fit when your team wants Laravel exception tracking, issue tracking, and performance monitoring with dedicated request, job, query, session, and feature flag views. Dynatrace covers a wider stack with distributed tracing, infrastructure, frontend replay, profiling, and topology-based root-cause analysis. Choose based on the workflows you need.
Dynatrace supports Laravel within its PHP monitoring capabilities, but it is a general-purpose, multi-language platform. Laritor is designed primarily for Laravel. Here, Laravel native describes the product’s primary focus, rather than whether it can monitor Laravel.
Yes. Laritor offers exceptions-only, issues-only, and full observability recording filters. Retained requests, jobs, and commands include their related configured events. Dynatrace supports adaptive sampling, capture controls, and retention configuration; equivalent Laravel execution recording presets are not listed in the reviewed documentation.
Laritor costs $20/month for 20M billable events, then $0.20 per started 100K additional events, with unlimited apps and users and 30-day retention. Dynatrace DPS has an annual minimum platform commitment and consumption-based capabilities. Published Full-Stack usage costs $0.01 per memory-GiB-hour, with eligible trace allowances and ten days of trace retention included. The calculator models physical/VM hosts, qualifying trace ingest, and extended retention to 30 days. It excludes the contract minimum, additional products, and billable DQL scans.
No. Laritor counts each event in 2 KB billing increments. Dynatrace trace charges use data volume in GiB and eligible Full-Stack allowances. The calculator uses one shared workload count as a scenario proxy, assuming one Dynatrace span per shared unit with an editable size. Actual instrumentation produces different records and volumes, so use measured usage when evaluating costs.
No. It estimates a month of published DPS consumption, not the minimum subscription contract. Dynatrace requires an annual platform spend commitment and does not publish a minimum dollar amount on the reviewed pricing page. Negotiated terms, telemetry configuration, additional capabilities, and actual usage can change the amount payable.
The calculator shows Ask for a quote when Laritor’s calculated price is greater than $500/month. At exactly $500 it still shows the numeric price. Contact Laritor to discuss pricing for higher volumes.
Dynatrace documents opt-in Early Access PHP CLI deep monitoring with process and custom service detection rules, as well as custom messaging instrumentation. The reviewed guides do not list automatic Laravel Queue/Horizon payload, dispatch-delay, or wait-time resources. Laritor provides dedicated Laravel job and queue performance views. Validate your worker runtime and instrumentation before comparing coverage.
Yes. Laritor offers in-app recommendations, supported provider choices, and read-only exception context through MCP. Dynatrace offers Dynatrace Intelligence, Assist, and a hosted MCP server with broader operational tools. Availability, permissions, and metering vary: AI Exploration is included, while some AgenticOps paths consume billed AI units. Do not assume every Dynatrace AI interaction is separately billed.
Yes. Laritor records Pennant evaluations and provides activation, timing, and related error insights. Dynatrace custom attributes and business events can record flag state, but an equivalent automatic Pennant resource is not listed in the reviewed documentation. Laritor observes existing flags; it is not a replacement flag-management service.
Both offer customizable dashboards and unlimited user access under the plans compared. Laritor has 85+ Laravel widgets and daily/weekly PDF email reports. Dynatrace dashboards support visual exploration, tiles, variables, DQL, and code functions. Classic dashboards also offer weekly/monthly email report links and manual PDF printing. Equivalent automatic PDF attachment delivery is not listed in the reviewed dashboard guides.
Laritor follows retained backend requests in a Laravel session with users and custom events. Dynatrace RUM follows frontend user sessions, can link them to backend traces, and offers visual replay on supported technologies. Laritor’s backend journey view does not reproduce browser clicks or screen recordings.
Yes. Laritor provides bot and suspicious request views beside application performance, with controls over which requests you record. Dynatrace RUM also has robot, spider, and IP exclusions. Laritor’s Laravel backend analytics and recording filters help investigation and volume control; they do not block attacks or replace a WAF.
Yes. Configure client-side redaction, resource collection settings, recording filters, and sampling. Review headers, payloads, responses, logs, and custom event metadata before enabling collection. Dynatrace also provides OneAgent-side privacy masking and configurable collection controls. Both tools require an appropriate configuration for your data.
Yes. You can evaluate Laritor alongside Dynatrace in a representative environment. Review both collection configurations, test exception and slow-execution investigations, verify alert delivery, and measure combined overhead and actual billable usage before changing your production setup.
There is no documented automatic Dynatrace history import. Keep access to existing records while Laritor starts collecting new application activity, then configure your dashboards, alerts, reports, and AI workflow.
About this comparison
Published by Laritor, independently of Dynatrace. Official DPS pricing and billing, PHP/Laravel support, CLI instrumentation, custom context, business events, dashboards, reports, infrastructure, database monitoring, OpenTelemetry, privacy, and AI/MCP documentation were reviewed on . Feature availability depends on technology and agent versions, permissions, configuration, and product access.
“Laravel native” means primarily designed for Laravel. Dynatrace supports Laravel within a wider platform. “Not listed” refers to an equivalent dedicated resource not found in the reviewed guides; custom instrumentation or integrations may meet the need. Pennant monitoring is distinguished from custom flag metadata, Laravel backend session journeys from frontend RUM/replay, and automatic PDF delivery from Classic email links and manual PDF printing. Both platforms have customizable dashboards, unlimited seats under the compared plans, privacy controls, AI, and MCP.
The calculator estimates DPS consumption for identical physical/VM Full-Stack hosts in one environment, with constant traffic and qualifying enriched or explicitly extended trace ingestion. Native OneAgent normally uses adaptive sampling within its included allowance; higher traffic does not automatically mean extra ingest charges. Allowances expire per 15-minute interval. The 30-day retention model assumes steady-state storage and equal stored/ingest byte volumes. The annual minimum platform commitment is not included, and no minimum dollar amount is published on the reviewed pricing page. Additional products, logs, billed DQL scans, AI usage, taxes, and negotiated terms are excluded. One shared record count is a scenario proxy, not a claim that vendor records are equivalent. This is a consumption estimate, not a subscription quote or a universal savings claim.
Start with the data you need
Track exceptions, detect issues, and monitor performance.
Try Laritor with 300K events free.