
Laritor
Yes
Laritor vs Bugsink
Laritor tracks exceptions, detects issues, and monitors Laravel performance. Inspect requests, jobs, queries, API calls, logs, and user sessions in one place. Choose what to record, give your team full access, and debug with in-app AI or your coding agent through MCP.
Published by Laritor · Comparison checked · View comparison notes
Designed primarily for Laravel. All tools compared here support Laravel.
Yes
No
Why choose Laritor over Bugsink?
Bugsink focuses on reported errors, stack traces, and debugging context. Laritor can start with exception tracking and also help you find slow requests, queue delays, expensive queries, and other application issues. Laritor gives Laravel teams dedicated views for exceptions, issues, requests, jobs, queries, sessions, and feature flags. Open a slow or failing execution, inspect its recorded events, and give your team the context needed to fix it.
The full feature comparison
Compare 41 capabilities. See where Laritor gives you more, where Bugsink has an advantage, and what both tools offer.
Bugsink accepts Laravel error reports from Sentry-compatible SDKs, including stack traces, breadcrumbs, request/user context, and custom data. Its current documentation explicitly excludes performance transactions, traces, metrics, and other event types. A compatible SDK does not add every Sentry product to Bugsink. “Not listed” refers to equivalent dedicated Laravel resources in the reviewed guides; error context can still be useful without those views.
Performance and issue monitoring alongside exceptions, Laravel resource views, queues, sessions, Pennant, 85+ dashboard widgets, reports, in-app AI, and included hosted MCP.
| Capability | Laritor | Bugsink |
|---|---|---|
| Laravel performance monitoring | Monitor performance as well as exceptions Monitor request timing, percentiles, throughput, and retained execution activity. | Focuses on error events. Performance transactions, tracing, and metrics are not supported. |
| Three ready-made recording modes | Choose what to record Keep exceptions, detected issues, or all configured activity with related events in retained executions. | Error capture and SDK filtering are supported. Equivalent issue-triggered and all-activity Laravel recording modes are not listed. |
| Failed and slow execution workspace | Find issues beyond exceptions Investigate failed requests/jobs and slow work in a dedicated Issues workspace. | Groups reported errors as issues. Slow or unsuccessful executions without an error report are outside its error-only scope. |
| Dedicated Laravel resource views | Explore your whole application Explore requests, routes, jobs, commands, schedules, queries, cache, mail, notifications, and more. | Explore error issues and events. Equivalent dedicated views for these Laravel resources are not listed. |
| SQL performance and duplicate-query analysis | Find expensive database work Find slow/duplicate queries and inspect timing, configured bindings, and related executions. | SQL breadcrumbs may accompany an error. A database performance or N+1 investigation product is not supported. |
| Queue wait time and throughput | Understand queue delays Separate queue waiting from execution and inspect retained job failures and payloads. | Receives job exceptions and SDK context. Dedicated queue performance and throughput monitoring are not listed. |
| Artisan command output | Read failed command output Inspect configured output, timing, failures, and related command events. | Command information may accompany errors. A dedicated command-output investigation resource is not listed. |
| Scheduled-task monitoring | Understand scheduled work Investigate retained schedule runs, timing, output, failures, and related activity. | Captures reported errors. Dedicated Laravel schedule-run and missed-execution monitoring are not listed. |
| Incoming request content views | Inspect configured request content Optionally inspect retained request headers, payload, and response content beside related events. | SDK request context may be included in an error. Equivalent request-response content resource views are not listed. |
| Outbound API payload and response views | Find why API calls fail Optionally record outbound headers, payload, response, status, and timing in a Laravel execution. | SDK HTTP breadcrumbs may appear with an error. Dedicated outgoing payload/response resources are not listed. |
| Backend sessions and user journeys | Follow backend user journeys Follow retained session requests, configured session data, users, and business milestones. | Error user/context metadata is supported. Dedicated backend Laravel session journeys are not listed. |
| Automatic Laravel Pennant insights | Understand feature rollouts Inspect feature evaluations, activation, duration, and related recorded failures. | Custom error tags can describe a feature decision. Automatic Pennant performance views are not listed. |
| Dedicated business-event resources | Follow business milestones Record milestones and debugging information in a custom-event index and retained execution journeys. | Custom metadata can be attached to errors. Standalone Laravel business-event monitoring is not listed. |
| Dedicated cache investigations | More Laravel context Inspect configured cache key/value context and hit/miss insights. | The SDK can attach cache breadcrumbs to errors. Dedicated cache performance/resource views are not listed. |
| Mail and notification resources | More Laravel context Connect retained mail and notification activity to its surrounding execution. | SDK notification breadcrumbs can accompany errors. Dedicated Laravel delivery investigations are not listed. |
| Database schema explorer | Explore your database structure Browse tables, columns, indexes, and relationships beside Laravel queries. | An error tracker; a database schema explorer is not listed. |
| Custom dashboards and 85+ widgets | Build dashboards tailored to your team Build unlimited dashboards from ready-made Laravel widgets. | Error search and trends are available. An equivalent application performance dashboard builder is not listed. |
| Scheduled performance PDF reports | Keep tabs without logging in Customize daily/weekly snapshots, receive them by email, and share PDFs with teammates. | Error alerts are supported. Scheduled Laravel performance PDF snapshots are not listed. |
| In-app exception recommendations | Debug inside Laritor or your editor Use a supported provider for exception recommendations inside Laritor, alongside your external agent. | Provides data to your chosen external assistant; its own in-app AI debugging service is not offered. |
| Included hosted exception MCP | Connect directly to Laritor MCP Connect your agent to read-only exception details and retained Laravel execution context. | Agents can use the REST API or third-party MCP adapters. Bugsink does not currently ship its own MCP server. |
| Server CPU, memory, and disk views | Compare code and server resources Optionally collect server resources beside Laravel performance investigations. | Host resource monitoring is outside the documented error-only product. |
| Suspicious and bot traffic views | Understand the traffic reaching your app Inspect retained bot/suspicious requests alongside application performance. | Request context may accompany errors. A bot-traffic investigation view is not listed. |
| Custom application health checks | Check your application dependencies Define checks for dependencies and business-specific application conditions. | Health-check monitoring is outside the documented error-only product. |
| Searchable application log monitoring | Find logs around the failure Browse recorded logs and follow their related execution events. | SDK log breadcrumbs or reported message errors can provide context. General standalone log ingestion/search is outside its supported error-event scope. |
Source-available self-hosting, a compact deployment, multi-language error SDKs, a lower paid starting subscription, relevance-based retention, Markdown exports, and scoped API issue automation.
| Capability | Laritor | Bugsink |
|---|---|---|
| Source-available self-hosted backend | Hosted Laravel monitoring; a self-hosted Laritor backend is not listed. | Self-host source-available software under PolyForm Shield, with non-compete terms. This is not an MIT or unrestricted open-source license. |
| Compact self-hosted deployment | Use the managed Laritor backend. | A Docker evaluation can run with SQLite; MySQL/PostgreSQL options and production workers are documented. Your team owns storage and operations. |
| Error tracking across multiple languages | Primarily designed for Laravel applications. | Sentry-compatible SDKs cover PHP, Python, JavaScript, Java, Ruby, and more. Error compatibility does not imply APM support. |
| Lower paid entry subscription | Starts at $20/month with 20M related billable events. | Hosted paid plans start at $16/month with 75K error events. Event units and retention models differ. |
| Relevance-based smart retention | Includes 30-day recorded-event history. | Prioritizes stored errors using frequency and age instead of a fixed history window; older useful events can remain. This does not guarantee every event for a set number of days. |
| Agent-ready Markdown exports | Read-only exception MCP supplies recorded Laravel context. An equivalent event-stack Markdown export is not listed. | The UI and API expose stacktrace/source context and recorded locals as Markdown for your own coding assistant. |
| Scoped API issue-lifecycle automation | Laritor MCP exposes read-only exception context. Equivalent MCP issue-status actions are not listed. | Project-scoped API capabilities can resolve, reopen, mute/unmute issues, and add comments when permitted. |
Both support Laravel error reporting, grouped exceptions, stack traces and context, custom metadata, chat/email alerts, local privacy controls, paid unlimited users, and managed hosting.
| Capability | Laritor | Bugsink |
|---|---|---|
| Laravel Composer setup | Install and configure binarybuilds/laritor-client. | Use the compatible sentry/sentry-laravel Composer SDK with a Bugsink DSN and error reporting enabled. Disable unsupported tracing. |
| Grouped exception issues | Group repeated exceptions for investigation. | Groups repeated errors and normalizes changing values such as IDs or addresses to reduce fragmentation. |
| Stack traces and error details | Source file/line, stack trace, and retained Laravel context. | Recorded stack frames, source context, and local variables where the SDK/platform provides them. |
| Context around a reported error | Related recorded events show what happened in the retained execution. | SDK breadcrumbs, request/user context, and event data support error investigation; this is not full performance tracing. |
| Custom error and user metadata | Attach configured custom events and user/application metadata. | SDK tags and custom/user context can enrich error events. |
| Exception capture in Laravel requests and jobs | Capture configured exceptions from requests, jobs, and commands. | Compatible Laravel error reporting can send exceptions from these executions; performance transactions remain unsupported. |
| Error alerts and chat integrations | Exception/issue alerts through supported channels. | Email, Slack, Discord, Mattermost, Teams, Telegram, and webhooks for new issues, regressions, and qualifying unmuted errors. |
| Local filtering and privacy controls | Redaction, exclusions, optional content collection, and sampling. | The compatible SDK can discard or scrub error data before sending it. Review PII collection options for your deployment. |
| Unlimited users on paid hosted plans | Unlimited apps and users share the paid event allowance. | Published hosted paid tiers include unlimited users. |
| Managed hosting option | Hosted monitoring and managed event storage. | Managed Bugsink is available in the EU; self-hosting is optional and operated separately. |
Major difference
Laritor combines Laravel exception tracking with execution issues and performance monitoring. Your developers can inspect recorded application activity and find problems that never become an exception.
Laritor monitors requests, queries, queue delays, and other execution issues. Bugsink is deliberately focused on error reports and debugging context rather than application performance monitoring.
See related queries, API calls, cache events, logs, and custom events in Laritor. Bugsink’s stack traces and error context do not replace these dedicated Laravel performance and resource investigations.
Laritor includes in-app recommendations and a hosted exception MCP server. Bugsink provides exports and an API for external agents; its reviewed product does not include a native MCP server, and third-party adapters are separate.
Why choose Laritor over Bugsink?
Track exceptions and investigate the slow or failing work around them. Follow requests, queues, queries, API calls, user sessions, and feature flags through Laravel views your team can use every day.
20M billable events, unlimited apps and users, and 30-day retention. Choose exceptions, detected issues, or all activity without a separate error or log quota.
Bugsink hosted paid plans start at $16/month for 75K error events. Laritor starts at $20/month for 20M related billable events and 30-day history. Bugsink counts reported errors; Laritor also counts the related activity it records. Bugsink’s stored-event allowances and smart retention differ from a fixed history window. Compare your exception workload below; the cheaper option depends on your volume and recorded context.
Cost calculator
Use the same exception count for both tools. Bugsink counts reported error events, including their diagnostic context. Laritor counts the exception and its related recorded events. The calculator chooses a published paid Bugsink plan that covers your volume.
2,000,000 billable events · 30-day history
100,000 error occurrences · 600,000 monthly events included
Count-based smart retention, without a fixed-day history promise
Monthly USD before tax. This compares exception tracking. Laritor also includes issue and performance monitoring. Monthly error allowance, stored-event capacity, and days of history are different measures.
Hosted USD monthly paid rates checked October 10, 2026: 75K errors $16, 600K $50, 3M $158, 15M $568, 50M $1,288. The calculator chooses the smallest sufficient published tier without a free-plan baseline or assumed per-event overage rate. Above 50M errors, confirm Bugsink pricing. Its 75K/600K/3M cards list matching retained-event allowances; higher-volume storage allowances require confirmation. Smart retention uses relevance, frequency, and age rather than promising every event for a fixed number of days. The estimate excludes additional reported errors/messages, other projects’ usage, self-hosted infrastructure/support, annual or legacy terms, custom contracts, trials, and tax. Laritor includes 20M events for $20 plus $0.20 per started 100K; strictly above $500 it shows “Ask for a quote.” Exactly $500 stays numeric. Published Bugsink prices above $500 stay numeric. Avoid counting shared context twice when several exceptions occur in one execution.
Open the Laravel resource you need, then inspect the events behind slow or failing work.
Request performance
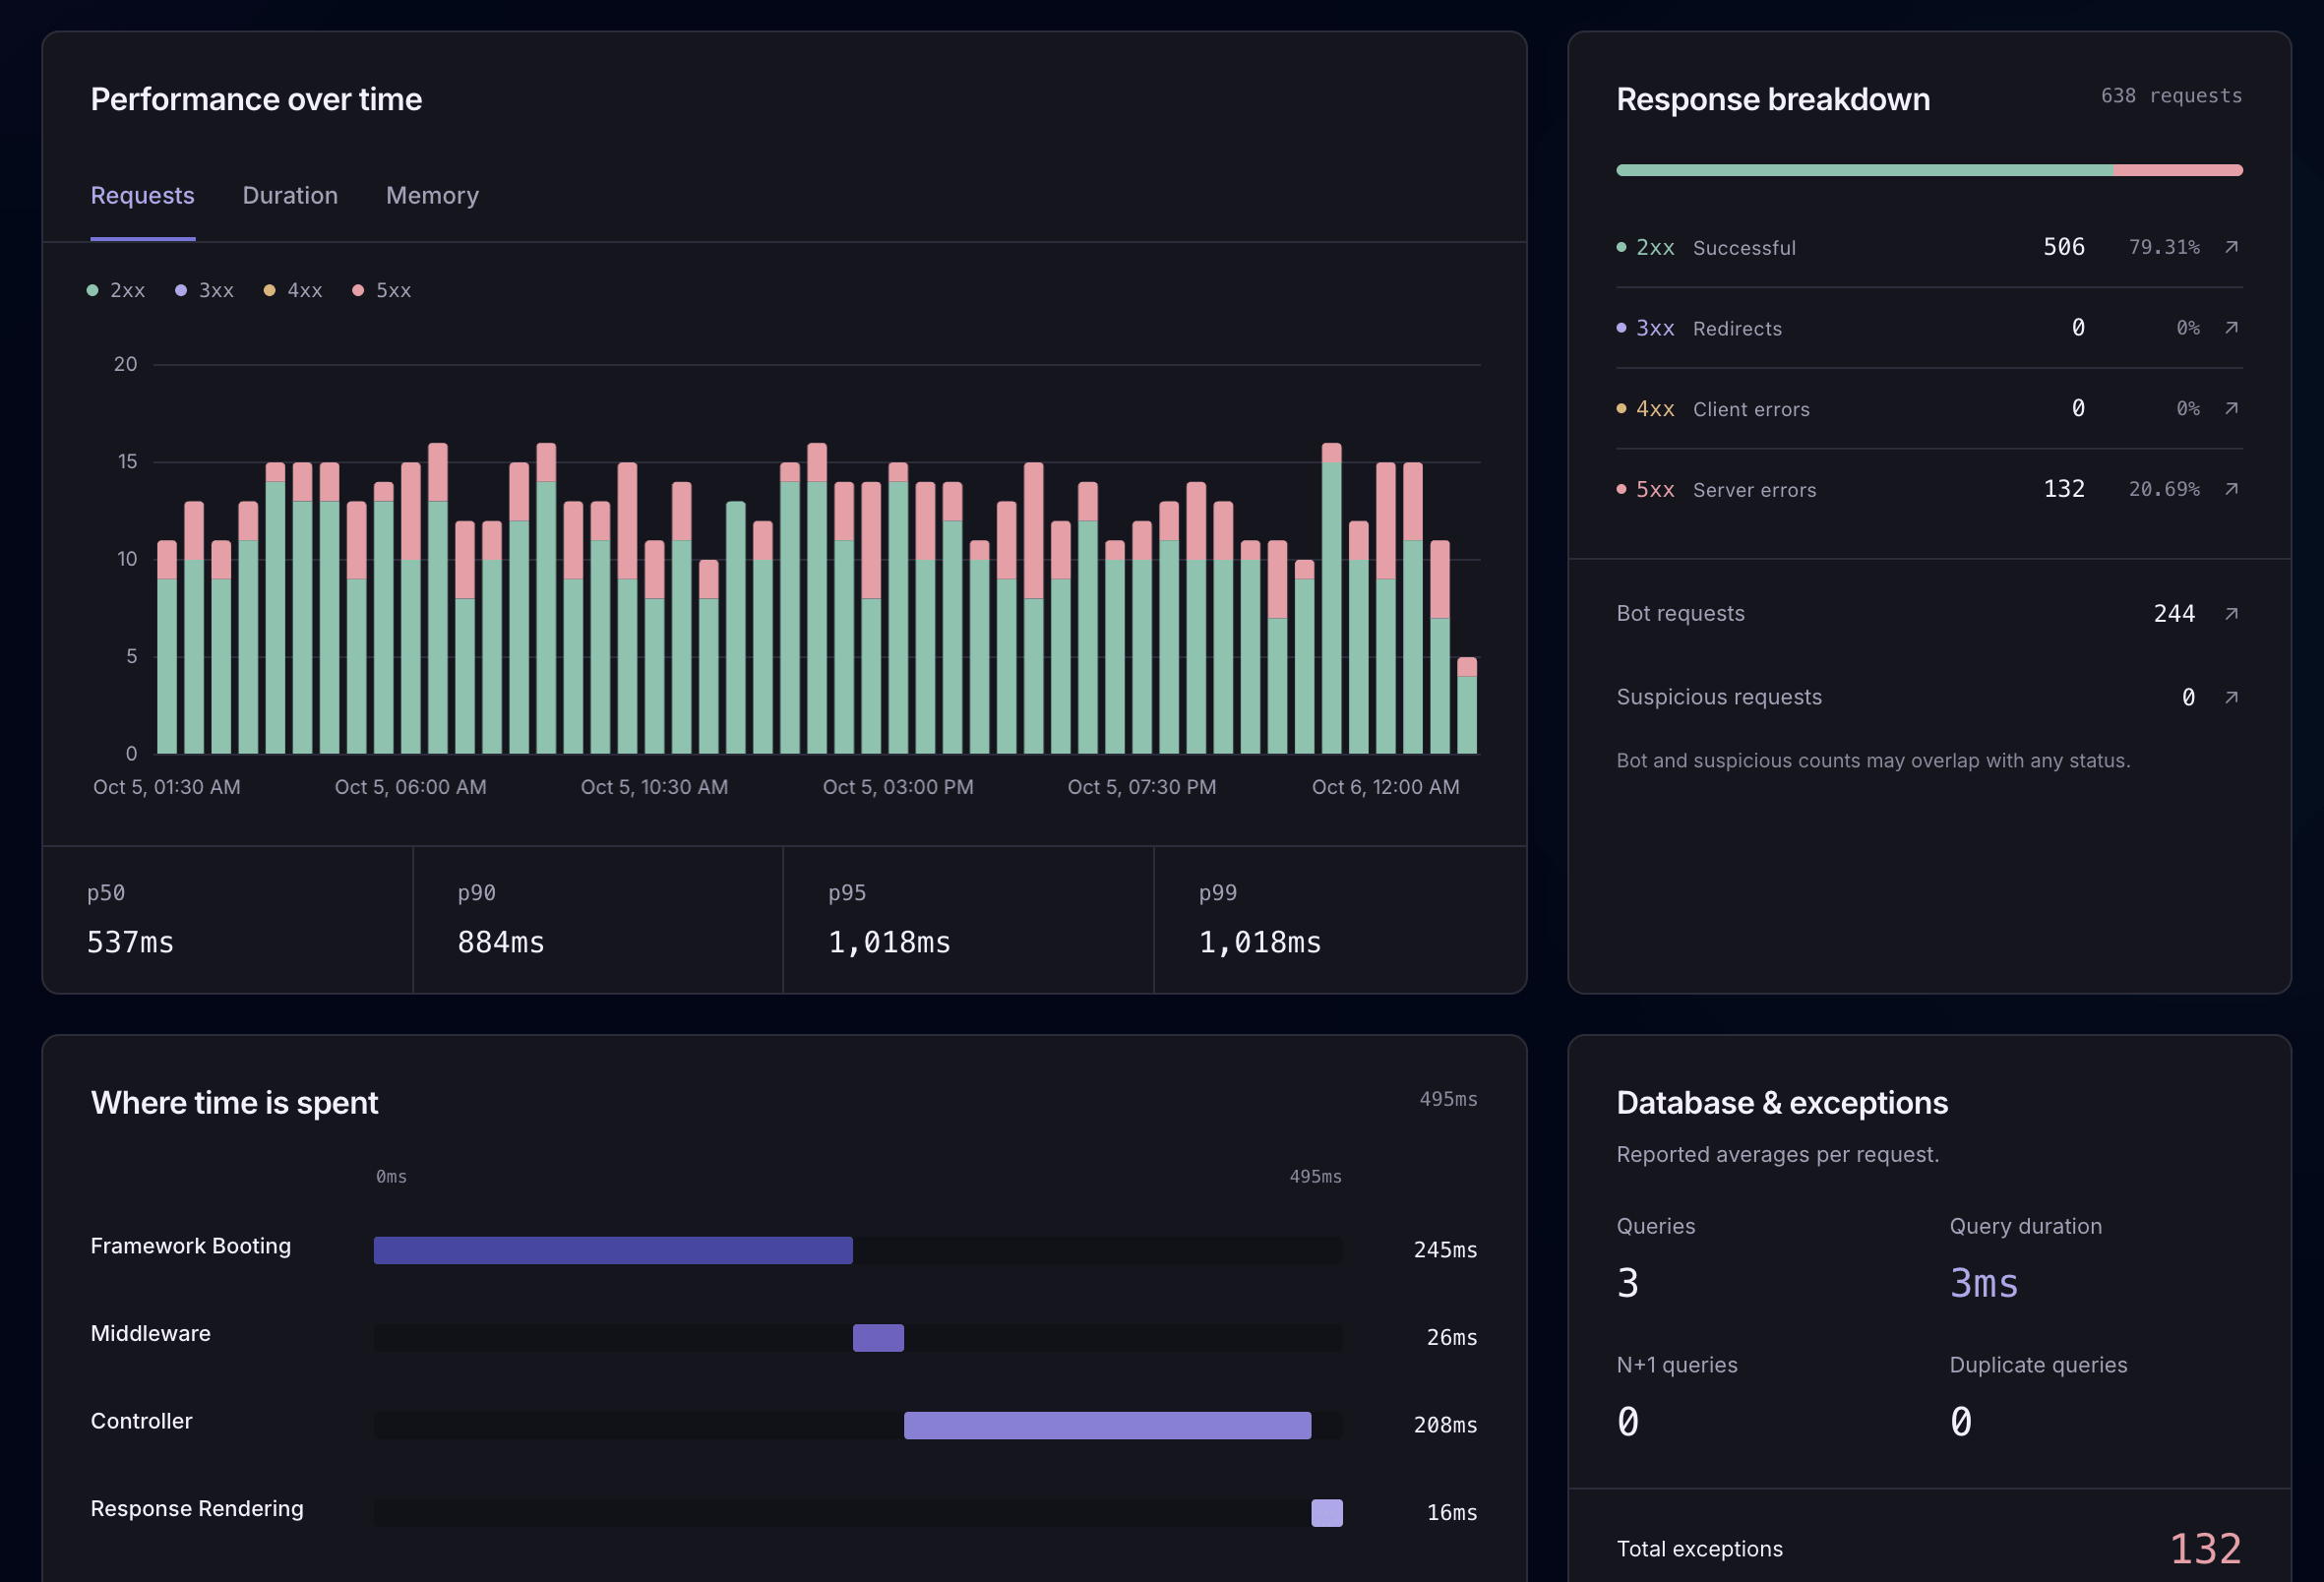
Compare request volume, status codes, duration percentiles, and lifecycle timing. Open a retained request to inspect its recorded queries, logs, and API calls.
Bugsink focuses on reported errors and does not process performance transactions. Laritor also monitors slow requests, lifecycle timing, bot traffic, and configured request content.
Queue performance
Separate queue wait from job execution time. Inspect retained failures and configured payloads to understand why work is delayed or failing.
Bugsink can receive exceptions and queue breadcrumbs through the Laravel SDK. Laritor adds queue performance, wait-time, throughput, payload, and retained-event investigations.
Queries and server resources
Inspect slow and duplicate queries, then compare application activity with optional CPU, memory, and disk collection.
Bugsink can show query breadcrumbs attached to an error, but it does not provide database APM or host metrics. Laritor connects query performance with optional server CPU, memory, and disk views.
Performance in context
Review request volume, status codes, duration percentiles, and where time is spent. Open a retained request to inspect its queries, logs, API calls, and other recorded events. Explore request monitoring
Move from an alert to the source line and the events that explain the failure.
Exception investigation
Open an exception group, source file, line, and full stack trace. Follow the retained request or job journey to inspect queries, logs, and other collected events.
Bugsink also groups errors and shows recorded stack traces, request data, and SDK breadcrumbs. Laritor adds dedicated Laravel execution timelines and linked resource investigations.
API failures and command output
Enable the content you need to inspect outgoing payloads and responses, or read output from failed Artisan commands beside their recorded events. Redact sensitive fields before sending them.
Bugsink can show HTTP or command context attached to errors. Dedicated outgoing payload/response, performance, and Artisan-output resources are not listed.
AI and MCP
Use Laritor MCP to retrieve recorded exception details and execution events alongside your project’s code. In-app AI can recommend next steps with supported provider choices.
Bugsink supports external agents through Markdown, its API, and third-party MCP adapters; it does not ship its own MCP server. Laritor adds in-app recommendations and hosted read-only exception MCP.
Debug with your AI agent
Laritor MCP lets your agent retrieve exception details and the recorded execution timeline. It can inspect those events alongside your code to investigate the cause and work on a fix. In-app AI recommendations are available too.
Bugsink also supports your external assistant through Markdown, its REST API, and third-party MCP adapters. It does not currently ship an official MCP server. Laritor includes hosted read-only exception MCP and in-app recommendations with supported provider choices. Choose your in-app AI provider ↗
Read the Laritor MCP guide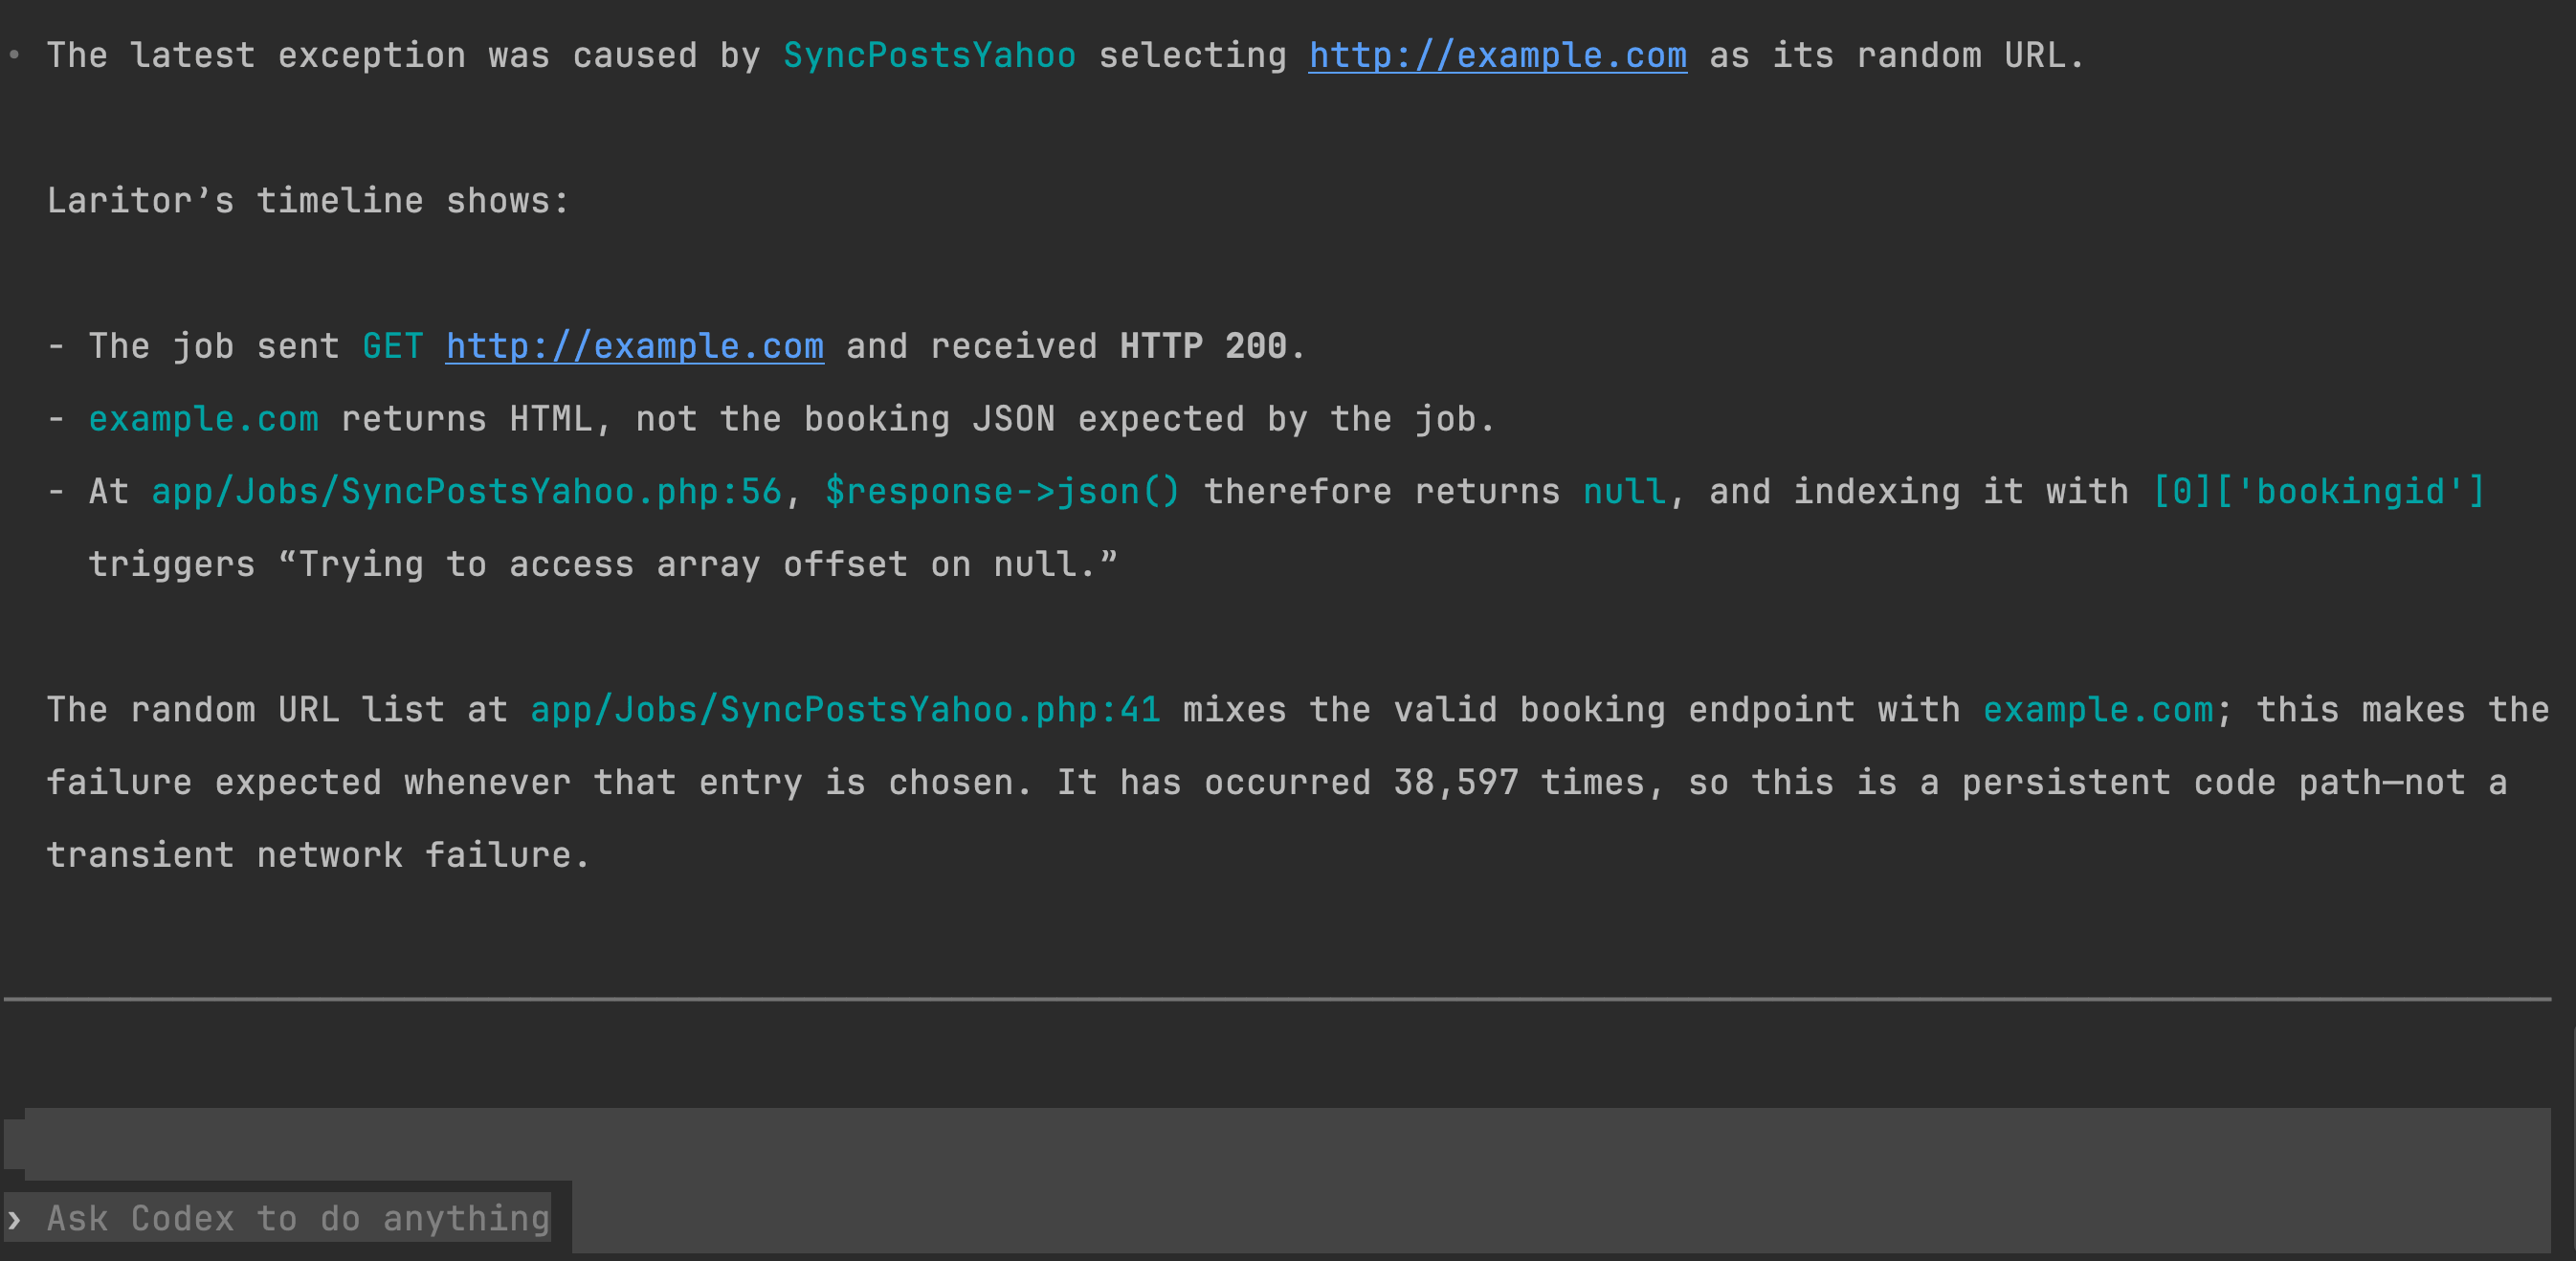
Follow customers, feature evaluations, and the milestones your team needs to debug.
Session journeys
Open a recorded Laravel session to inspect its retained requests. Add business milestones to see what the customer tried before an error.
Bugsink can display user context attached to errors. Laritor also provides dedicated backend session journeys and configured session state, across retained requests.
Feature flag performance
Inspect feature evaluations, activation, duration, and related failures. Review activity after a rollout through dedicated Laravel Pennant resources.
Bugsink can receive feature decisions as custom error tags. Laritor provides automatic Pennant evaluations and feature-performance investigations.
Business events
Record checkout milestones, payment attempts, pricing decisions, and debugging metadata as custom events. Inspect them within retained execution journeys.
Bugsink accepts custom debugging data in error events. Laritor also tracks business milestones as a dedicated resource, including work that finishes successfully.
Build Laravel dashboards, share performance snapshots, and choose what to record.
Custom dashboards
Choose from 85+ Laravel widgets for traffic, errors, queues, and application performance. Create unlimited dashboards and share them with your team.
Bugsink provides error search and trends. Laritor adds unlimited customizable dashboards with 85+ Laravel widgets for broader application activity.
Scheduled PDF reports
Customize application reports delivered by email, and share PDF snapshots without requiring every teammate to log in.
Bugsink sends error alerts. Laritor also delivers customizable daily/weekly application performance PDFs that your team can share.
Recording and team costs
Keep exceptions and related events, expand to detected slow or failed work, or record all configured activity. Laritor’s paid plan uses one event allowance and includes unlimited apps and users.
Bugsink is an error-focused product with SDK filters. Laritor lets you start with exceptions and related events, expand to slow or failed work, or monitor all configured activity.
Evaluate Laritor in your app
Use a representative app or environment to compare the details you receive, recording volume, and debugging workflow.
Create a Laritor account, install the Composer package, add your ingest endpoint and key, and run the sync command.
composer require binarybuilds/laritor-clientStart with exception tracker, issue tracker, or full observability. Register the generated filter, then review the data and privacy settings for your app.
Configure recording filtersInspect a known exception or slow execution, test alert delivery, and compare measured overhead and billable event usage. If you run both tools, include their combined collection work in your evaluation.
Explore exception investigationCreate your dashboards, choose alert channels, schedule reports, and connect AI. Keep access to your existing Bugsink history while Laritor builds a new record of your application’s activity. There is no documented automatic history import.
Explore Laritor guidesQuestions before switching
Laritor suits Laravel teams that want exception tracking, issue detection, and performance monitoring together. Start with exceptions and their related events, then add slow/failed executions, queues, SQL, API calls, sessions, flags, dashboards, and reports. Bugsink suits teams that want an error-focused product, compatible multi-language SDKs, or a backend they can operate themselves.
Yes. Bugsink accepts errors from Sentry-compatible PHP SDKs, including sentry/sentry-laravel. Configure its DSN and Laravel exception reporting, and disable unsupported tracing. Laravel native here means primarily built for Laravel: Laritor has that focus, while Bugsink supports multiple languages and frameworks. SDK and server compatibility still depend on version and configuration.
No. Its current SDK recommendations explicitly limit the product to error events and exclude traces, metrics, and other event types. Sending Sentry SDK performance transactions does not add APM to Bugsink. Laritor monitors request timing, queues, queries, outgoing HTTP calls, and other retained Laravel activity, alongside errors and detected issues.
Both group repeated errors and show recorded stack traces and context. Bugsink puts reported errors, source context, SDK breadcrumbs, tags, and local variables where available first. Laritor also links retained requests, queries, logs, API calls, and other Laravel resources in an execution journey. Both depend on what their client recorded and what history remains.
Yes. Exceptions-only mode retains configured events from an execution when an exception occurs. You can later choose issues-only for detected failed/slow work or full observability for all configured activity. Bugsink captures error events and supports SDK filtering; it does not provide performance monitoring simply because the same SDK can send traces.
Yes, when the compatible Laravel SDK reports those exceptions. It can include queue/command breadcrumbs and custom error context. That is different from monitoring queue throughput, wait time, successful commands, printed output, or schedule performance. Laritor provides dedicated resources for those retained executions.
One monthly exception-occurrence count drives both estimates. Bugsink counts the error events it receives; stack traces, breadcrumbs, and custom context do not multiply an error into separate monthly events. Laritor counts the exception and related billable events, including 2 KB increments. The average-events input estimates that related activity. The calculator selects the smallest published paid Bugsink tier that covers the count.
The reviewed USD monthly tiers are $16 for 75K error events, $50 for 600K, $158 for 3M, $568 for 15M, and $1,288 for 50M. Laritor starts at $20 for 20M related billable events. These are different billing units. Free plans, trials, legacy prices, annual terms, support purchases, and tax are excluded from the comparison.
Laritor shows Ask for a quote strictly above $500 per month; exactly $500 stays numeric. Bugsink shows Ask Bugsink for a quote above 50M modeled monthly errors, beyond the largest reviewed public tier. Its published $568 and $1,288 tiers remain numeric: the $500 rule applies only to Laritor. This is a pricing verification boundary rather than a claimed server capacity limit.
The modeled hosted allowance is for reported error events. An error’s stack, breadcrumbs, tags, and diagnostic context are part of that event, not extra occurrences. Bugsink does not process performance traces or general standalone logs. Additional reported message/error events consume the allowance. Measure actual error volume and avoid counting shared Laravel execution context twice when several exceptions arise in one run.
No fixed-day promise is modeled. Bugsink uses relevance-based smart retention influenced by event frequency and age, within configured stored-event capacity. The 75K/600K/3M hosted cards list matching retained-event allowances; the reviewed higher-volume pricing list does not specify those storage allowances, so the calculator asks you to confirm them. Laritor includes 30-day history. An event-count allowance is not a guaranteed 30- or 90-day window.
You can self-host it under its source-available PolyForm Shield license, which includes non-compete terms. It is not the same as an unrestricted MIT or OSI open-source license. Self-hosting requires storage, backups, upgrades, capacity planning, and operations; optional paid support has a separate cost. The calculator compares hosted subscriptions and does not invent an infrastructure bill.
Its documented evaluation can run in Docker with SQLite, and MySQL/PostgreSQL options are available. Production settings include a background worker and proxy/TLS configuration. Error-event limits and retention are configurable, and capacity depends on event size, traffic, hardware, and history. A vendor benchmark is not a guaranteed monthly hosting budget. Laritor’s hosted service manages its monitoring backend for you.
Yes. Laritor provides hosted read-only exception MCP with retained Laravel events and supported in-app AI recommendations. Bugsink exposes event/stack Markdown and a canonical REST API for your chosen agent. Its October 6, 2026 guide explicitly says it does not currently ship an MCP server, while acknowledging third-party implementations. Those adapters require their own installation and configuration.
Yes, if its API token has the appropriate capabilities and permissions. Bugsink’s API can resolve, reopen, mute/unmute issues, and add comments; tokens can be scoped to one project and read-only investigation is supported. Laritor MCP is read-only exception context. The workflow and authority of each integration differ, so do not treat every agent connection as read-only.
Laritor follows retained backend session requests and configured session state, adds automatic Pennant insights and business-event resources, and includes unlimited dashboards with 85+ Laravel widgets. Customizable daily/weekly PDF performance snapshots help your team keep tabs without logging in. Bugsink focuses on reported errors; equivalent application performance resources are not listed.
Laritor supports redaction, exclusions, and optional content collection before data leaves your app. The compatible Sentry Laravel SDK can scrub or discard error data before sending it to Bugsink. Review request data, SQL bindings, stack variables, custom context, PII settings, and what you share with an AI assistant. Self-hosting controls where the backend runs; it does not automatically remove sensitive fields from an error.
Yes. Keep Bugsink error reporting while installing Laritor in the same Laravel app or a representative environment. Compare known exceptions, captured context, alert delivery, billed usage, and combined client overhead. Keep unsupported Bugsink tracing disabled and review redaction in both clients. Retain access to your existing Bugsink history while Laritor builds new history; no automatic history import is documented.
About this comparison
Published by Laritor, independently of Bugsink. Official product and hosted pricing, SDK compatibility/recommendations, grouping, alerts, API, coding-agent guidance, installation, settings, retention, releases, source maps, and source-license documents were reviewed on . Capabilities depend on compatible versions, collection, configuration, and retained data.
“Laravel native” means primarily built for Laravel. Bugsink genuinely accepts Laravel errors through sentry/sentry-laravel. The SDK can attach exception stacks, breadcrumbs, request/user data, and custom context. That does not imply performance tracing, standalone log monitoring, metrics, or every Sentry server-side feature. Bugsink explicitly focuses on error events and recommends disabling unsupported traces.
The calculator uses one exception-occurrence count for both tools. An error’s diagnostic metadata does not multiply it into extra Bugsink errors. Laritor also bills related recorded events, including 2 KB size increments; use your measured average. Several exceptions can arise in one execution, so avoid counting shared context twice. The estimate selects the smallest sufficient published monthly paid Bugsink tier, including the 15M and 50M tiers. It excludes free/trial plans, legacy subscriptions, additional message/error events, tax, annual/custom terms, support purchases, and self-hosted operations. No automatic per-event overage price is invented.
Above 50M modeled monthly errors, confirm Bugsink volume pricing. Its published $568 and $1,288 subscriptions remain numeric. Only Laritor strictly above $500 requires a quote; exactly $500 stays numeric. Bugsink separates monthly ingestion from stored-event allowances. Its public 75K/600K/3M cards list matching retained-event capacities, while the reviewed higher-volume list does not publish those capacities. Smart retention prioritizes relevance using frequency and age; it is not a promise to keep every event for 30 or 90 days. Laritor includes 30-day history.
Bugsink’s October 6, 2026 agent guide supports Markdown, the canonical REST API, and third-party MCP adapters; it explicitly says there is no official Bugsink MCP server. API capabilities can be scoped to a project and include issue-status changes when granted. Laritor MCP is hosted read-only exception context; in-app AI is an additional Laritor workflow. Adapter installation and AI-provider costs are excluded from the price estimate.
Bugsink is source-available under PolyForm Shield with non-compete terms, rather than an unrestricted MIT or OSI open-source license. Self-hosting places infrastructure, backups, upgrades, storage, retention settings, and operating work with your team. Its compact installation options and benchmarks do not establish a guaranteed hosting bill or unlimited default ingest capacity. Both products offer managed hosting, and paid hosted Bugsink plans include unlimited users.
Start with the data you need
Track exceptions, detect issues, and monitor performance.
Try Laritor with 300K events free.