Blog · 15 min read
How We Are Processing 1B+ Events Per Month With Minimal Performance Impact
If you are not familiar with Laritor, Laritor is a production performance monitoring and observability platform built specifically for Laravel applications. Every performance monitoring tool comes with a slight performance trade-off. Our mission is to reduce that impact to the point where it's negligible and unnoticeable.
That mission drives every architectural decision we make. At production scale, once you're capturing everything from requests and queries to jobs and logs, collecting the data isn't really the hard part anymore. It's doing it reliably, without observability itself becoming a new source of latency, lock contention, or memory growth.
The Core Observability Problem
A very basic observability processing flow looks like this: a request comes in, the Laravel application processes the request in 200ms, and then the observability package collects the data and sends it to an ingestion server, taking another 100ms. Only after that is the response returned to the user. That means the total response time becomes 300ms, where 200ms is actual request processing and 100ms is the user waiting for observability ingestion to complete.
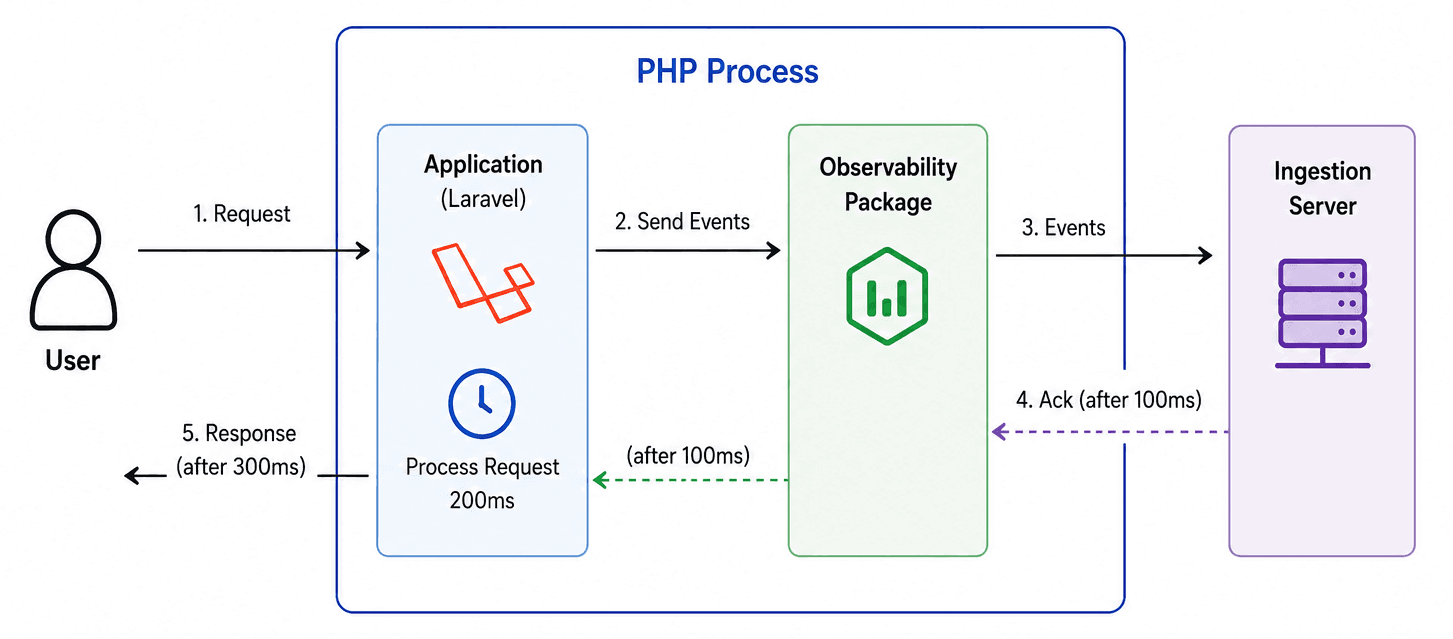
That extra 100ms might not matter much at low traffic. But multiply it across every single request at production scale, and it becomes a real tax on application performance, exactly the kind of overhead we're trying to avoid.
A High-Level View of the Pipeline
Why I Avoided Agents
Traditional observability platforms usually solve this by introducing a sidecar agent or background service running alongside your application. Your Laravel app sends events to that local agent, and the agent handles batching, processing, and forwarding asynchronously.
That approach does reduce the amount of blocking work on the request path, but it introduces a different set of operational problems. The developer is now responsible for setting up the agent, monitoring its uptime, and making sure it is running 24/7. On smaller servers, these agents also compete with the application itself for CPU, memory, and network resources.
I decided to avoid the agent approach because I wanted Laritor to be easy to adopt and easy to trust in production, and an agent adds unnecessary operational responsibility on developers who now have to run, maintain, and monitor another moving part just to get observability.
Deferred Ingestion
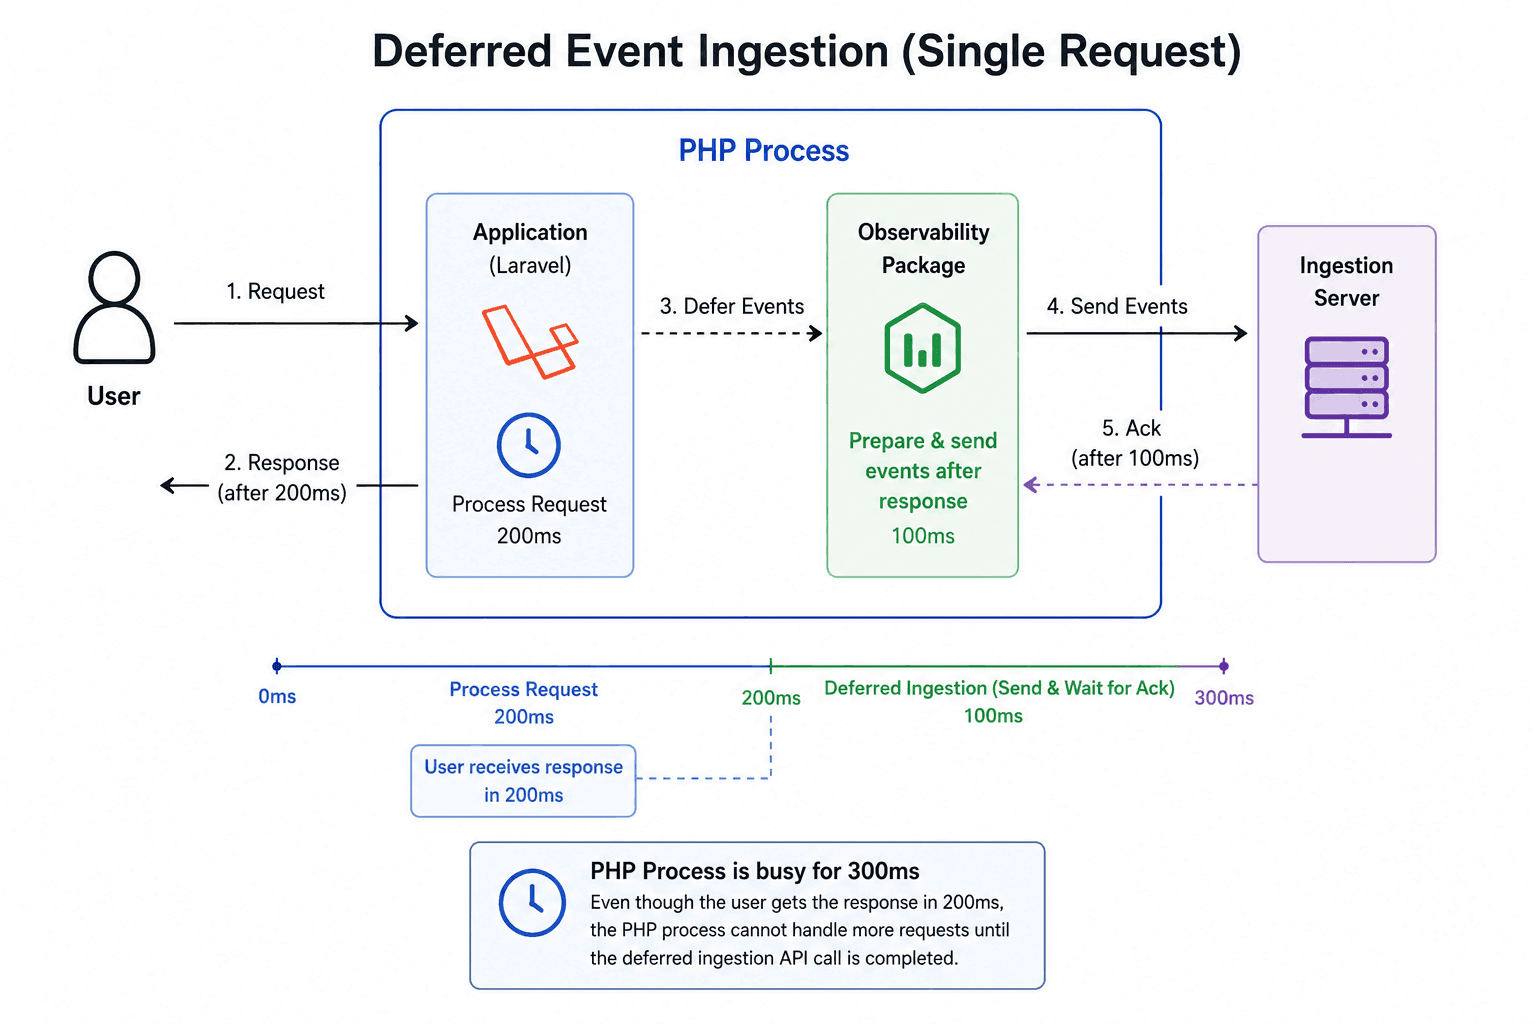
My initial approach was much simpler. Instead of sending events before the response is finished, we defer that work until after the response has already been returned to the user. We do this by leveraging Laravel's app-terminating callback, which runs once the response has been sent to the user.
$this->app->terminating(function (){
    app(Laritor::class)->sendEvents();
});
With this approach, the user still receives the response in 200ms, or whatever the actual request processing time was. Event shipping happens only after the response has been sent, which removes the observability ingestion delay from the user-facing response time.
This gives us an immediate improvement over the naive blocking model because observability work is moved out of the critical response path without forcing developers to deploy an additional local agent.
However, there is a tradeoff here. Even though the response is returned to the user, the underlying PHP process is still busy and cannot handle another incoming request until observability ingestion is completed. In the above example, the PHP process cannot handle another request until 100ms after the response is returned to the user.
This does not usually cause any issues for low-traffic applications. But for applications with high concurrent traffic, it becomes extremely important for the PHP process to handle other incoming requests as soon as possible.
Moreover, the latency increases depending on the location of the ingestion server and the application. For example, latency can increase significantly if the ingestion server is in the United States while the application sending events is running in Europe or Asia.
Edge Ingestion with Cloudflare Workers
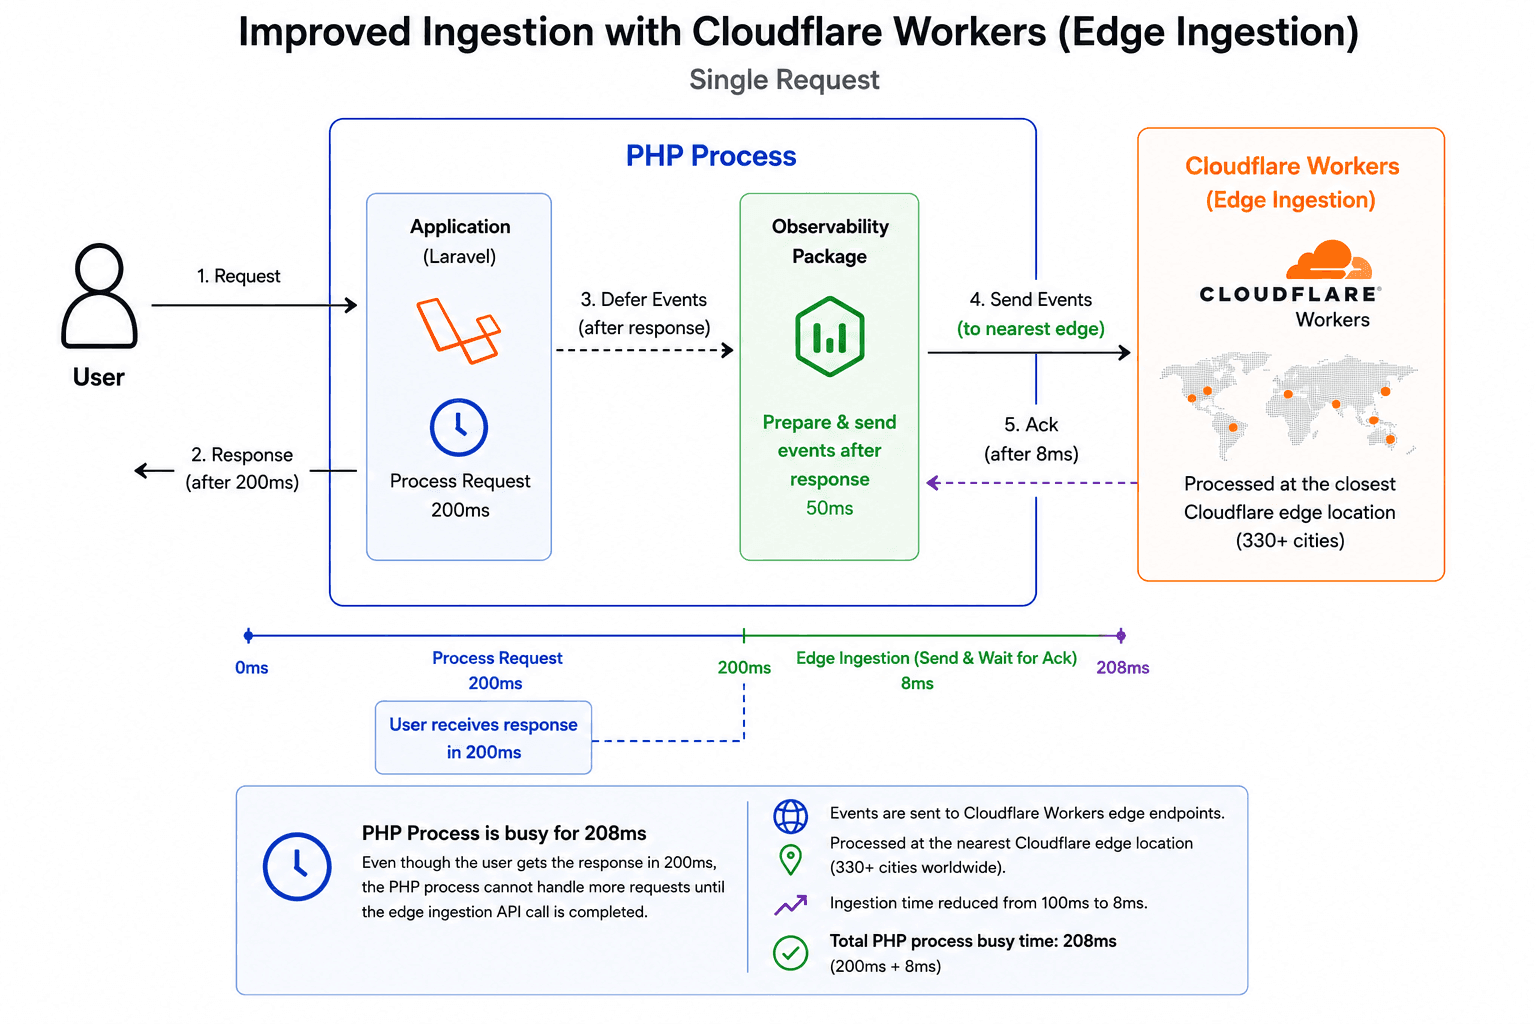
I solved this problem by introducing edge ingestion using Cloudflare Workers. Event data is sent to Cloudflare Workers instead of a centralized ingestion server. This allows us to ingest events and respond back to the application from one of the closest Cloudflare locations to where the application is running.
Cloudflare has a vast network of 330+ cities where Workers are executed, so event ingestion can happen at a location close to the user's application. This greatly reduces the latency for ingestion and makes the deferred model much more practical for production use.
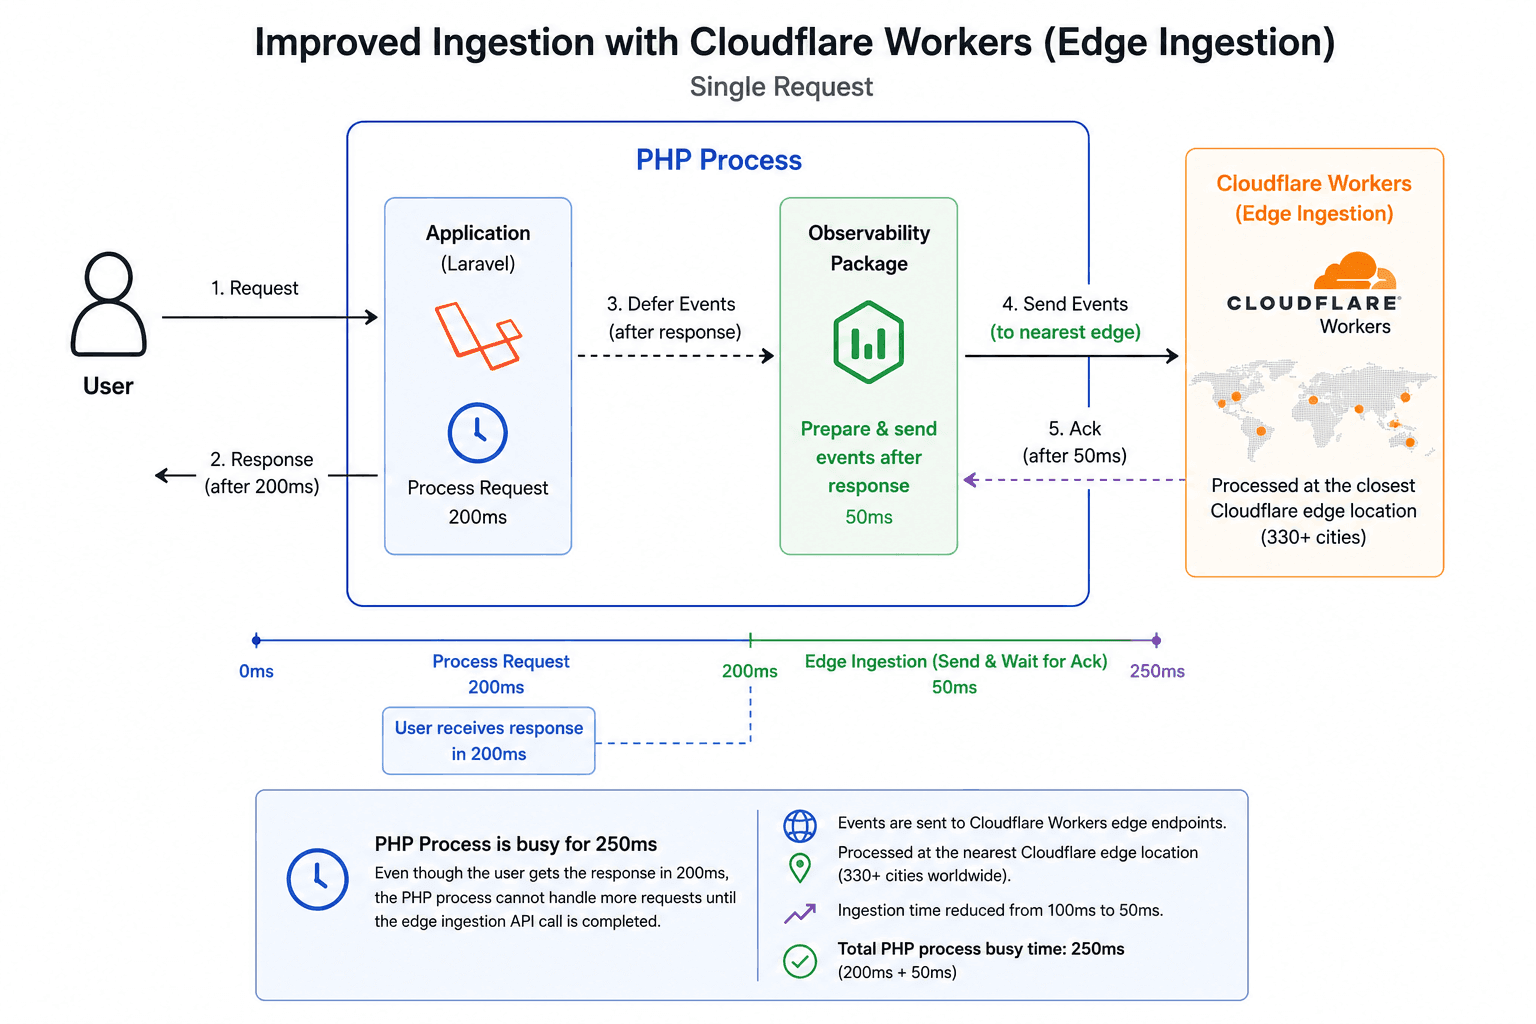
In the example above, the total time for the PHP process to stay busy is reduced from 300ms to 250ms, made up of 200ms for request processing and 50ms for observability event ingestion.
I was still not satisfied with that. My goal is to keep the impact as minimal as possible, so I started looking deeper into optimizing our ingestion worker, which is responsible for receiving event data and pushing it into a queue for downstream processing.
Eliminating Centralized Edge Dependencies
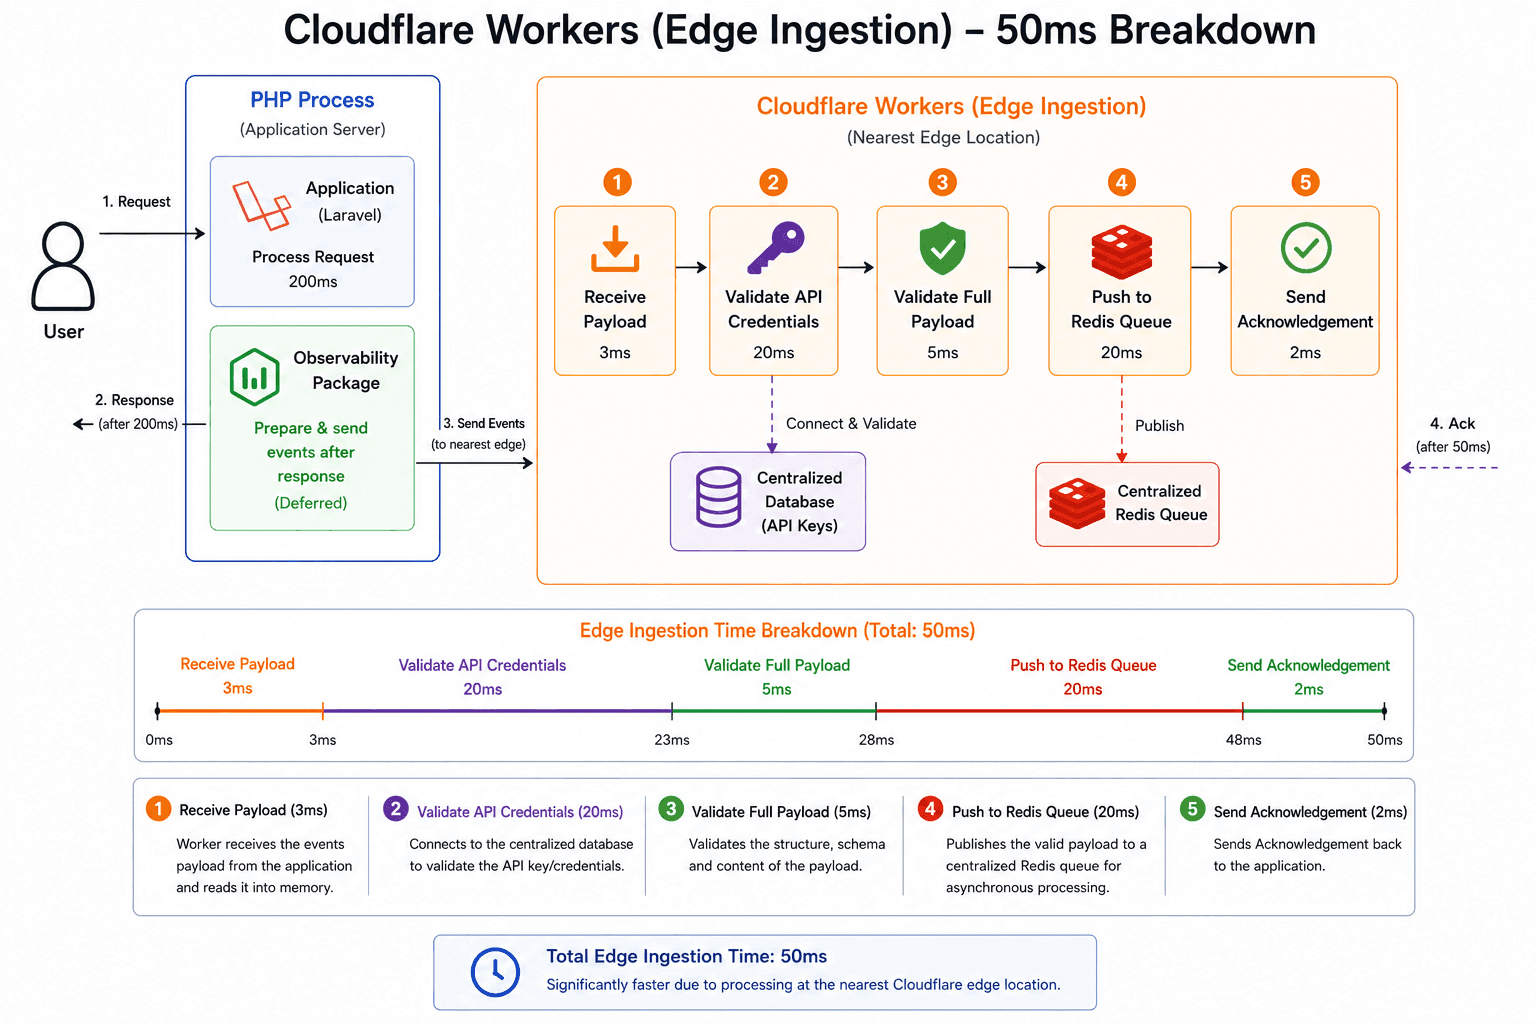
From the example above, once the payload is received, the worker first validates the API credentials by connecting to our centralized database. If the credentials are valid, it then validates the payload and pushes the events to a centralized queue for processing.
Even though the worker is running at an edge location, it is still trying to connect to a database at a central location and push events to a queue at a central location. That increases the total time the worker spends before it can return a response because it still depends on a round trip to centralized infrastructure. Depending on where the worker is executed, this can significantly increase response time.
I overcame this by leaning further into Cloudflare's native edge services. We use Cloudflare Workers KV for API key validation and Cloudflare Queues for pushing events into the processing queue. Because KV and Queues are globally available across Cloudflare's edge network, requests to these services can be handled at a nearby location instead of always reaching back to a centralized store.
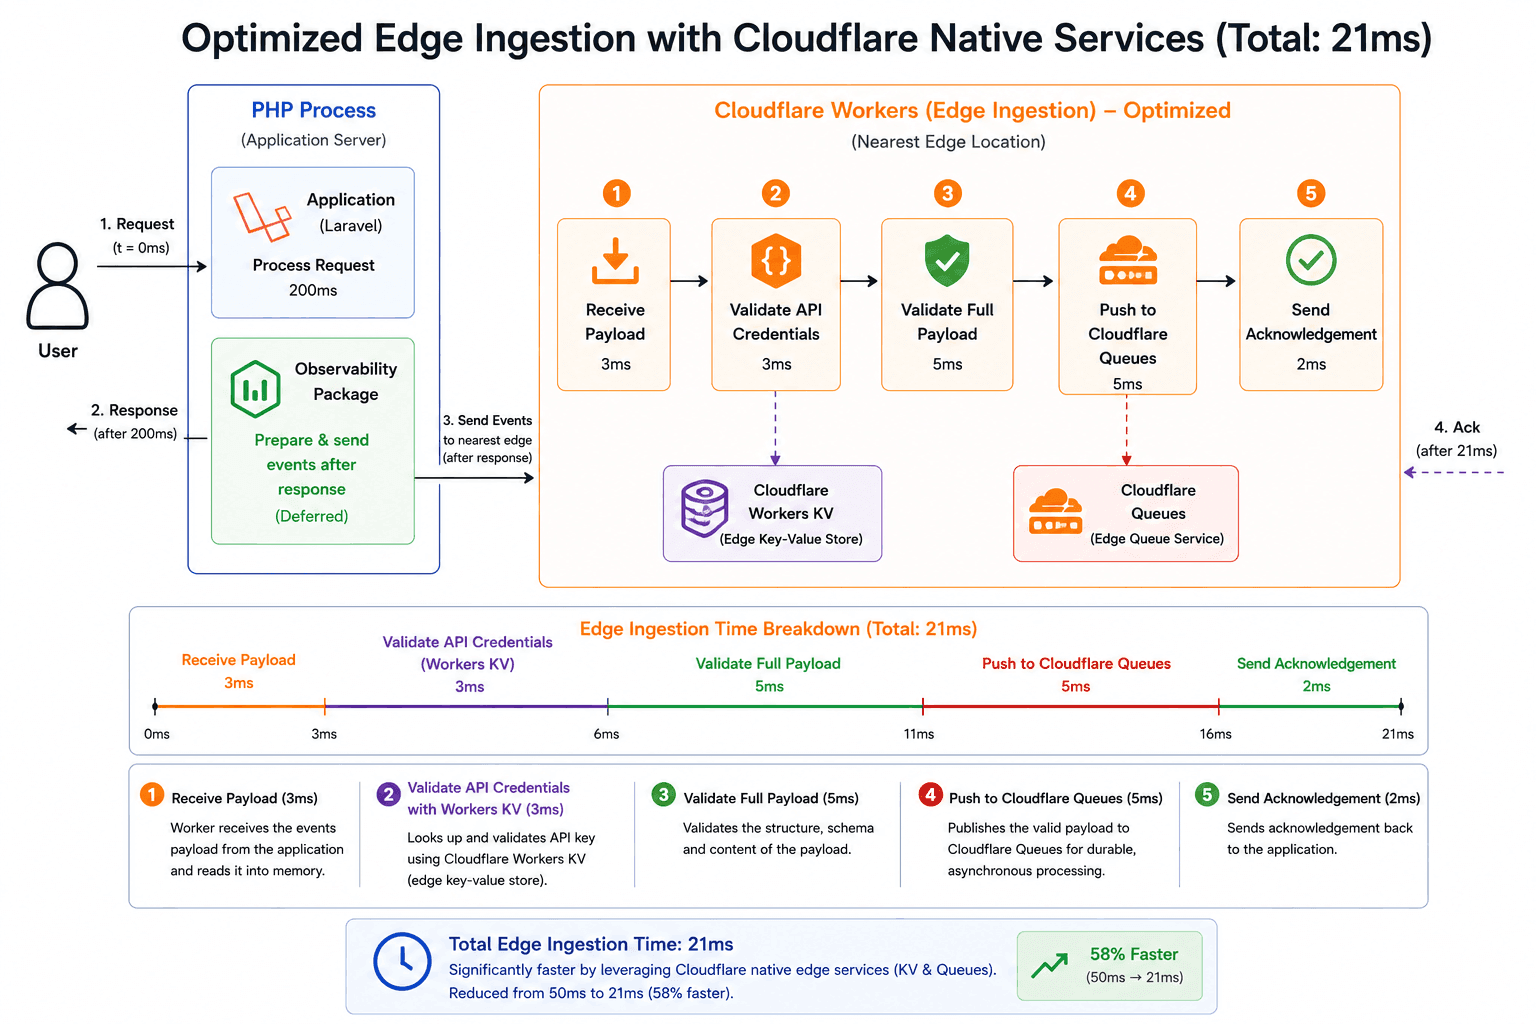
By leveraging Cloudflare KV and Queues, I was able to reduce the worker processing time from approximately 50ms to 21ms.
Asynchronous Worker Completion
This worker is called by our Laravel client ingest package, which is already responsible for making sure the payload is valid before it reaches the edge. Moreover, if validation fails at the worker level, there is nothing useful the package can do with that failure in real time.
Because of that, we do not actually need to wait for payload validation and queue insertion before responding to the request. We can respond immediately and let the worker continue processing the remaining tasks asynchronously.
I leveraged Cloudflare's ctx.waitUntil() feature for this. It allows the worker to
return a response immediately while keeping the underlying worker alive long enough to finish
other tasks asynchronously.
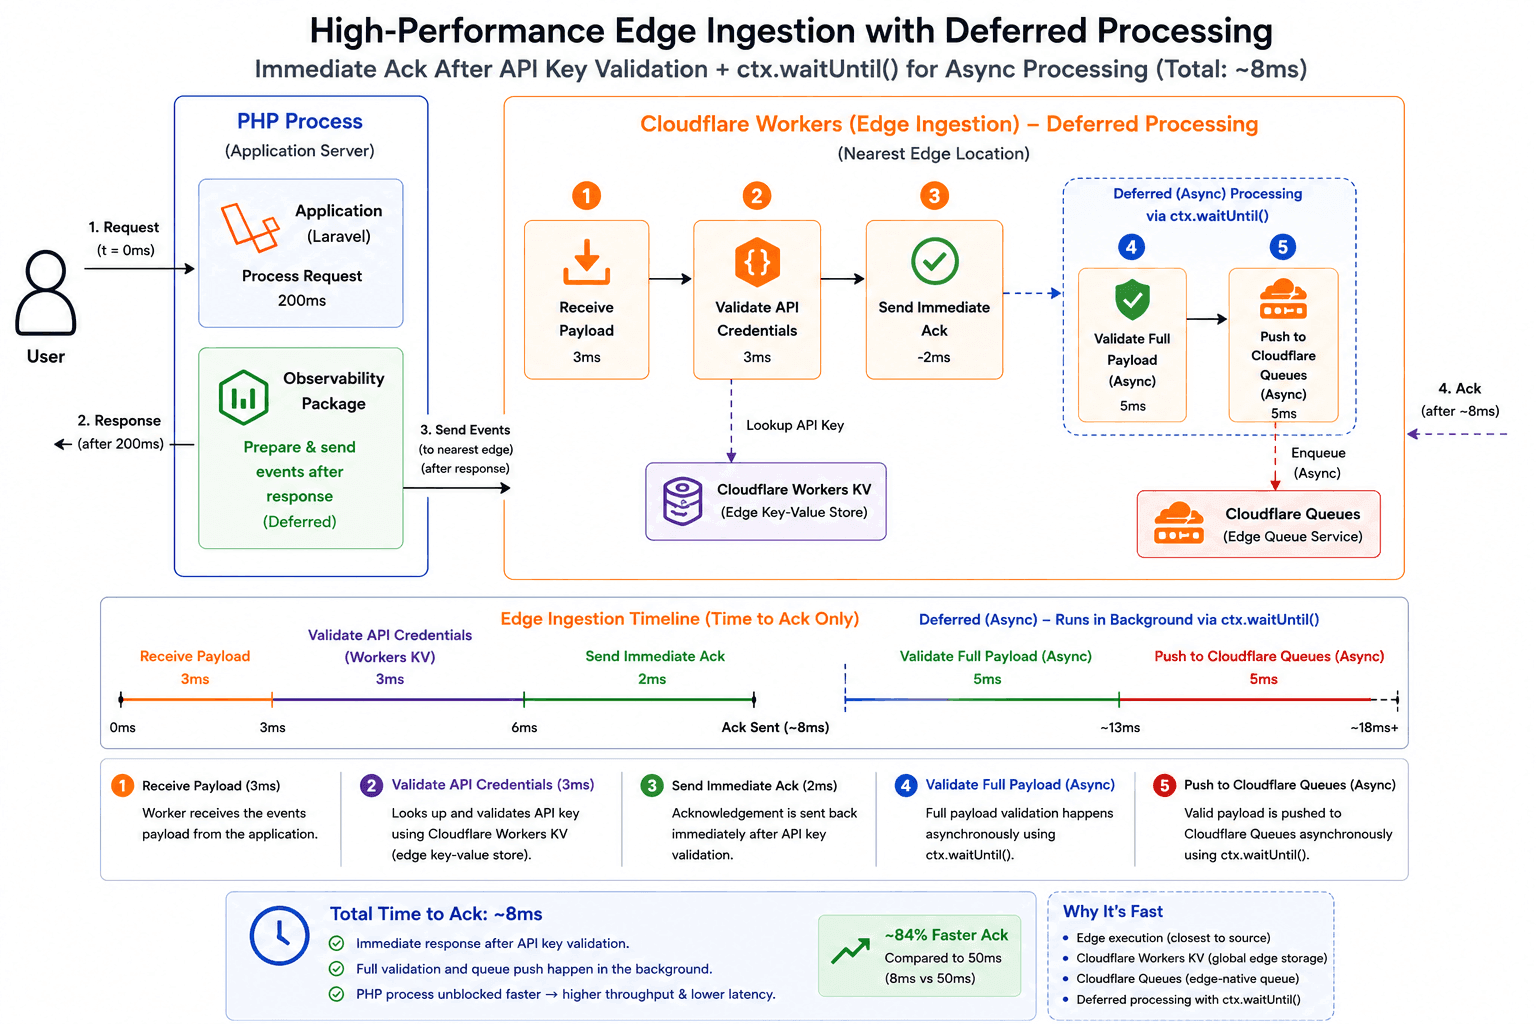
By leveraging this approach, I was able to further reduce the worker processing time from approximately 21ms to 8ms.
With the above improvements, I was able to bring the PHP process busy time down from roughly 300ms to under 208ms, with the observability portion of that, even under high concurrent traffic, down to just under 8ms.
With deferred event ingestion, we were always able to respond to the user within the actual request processing time without adding extra response overhead. For most applications, there is effectively no noticeable performance impact.
Consumer Workers for Near Real-Time Processing
So far, we have only covered the part where events are ingested and pushed to a queue. But at the scale of processing 1B+ events, the speed at which those events are processed and made available in the dashboard is just as important.
Since we were already storing events in a Cloudflare Queue, I decided to leverage a Cloudflare consumer worker as a proxy that forwards those events to our Laravel backend (specifically database). I opted for this approach because Cloudflare Queues can bind a worker as a consumer. Once a worker is bound to a queue, messages can be processed almost instantly as soon as they are pushed.
Cloudflare Queues are also highly scalable. They can process billions of messages in near real time because each message can spin up an individual worker instance for processing rather than depending on a single long-running consumer instance. That makes Cloudflare consumer workers a strong fit for ingesting 1B+ events in near real time.
The consumer worker itself is intentionally simple. It mostly acts as a backend proxy in front of our Laravel ingestion backend and looks roughly like this:
export default {
	async queue(batch, env, ctx) {
		for (const message of batch.messages) {
			const response = await fetch("https://ingestion-endpoint", {
				method: "POST",
				headers: {
					"Content-Type": "application/json",
					"Authorization": `Bearer ${env.AUTH_TOKEN}`
				},
				body: JSON.stringify(message.body),
			});

			if (!response.ok) {
				console.error("Forwarding failed:", await response.text());
				throw new Error("Failed to forward message");
			} else {
				message.ack();
			}
		}
	},
};
Concurrency Limits on the Consumer Layer
What is great about Cloudflare consumer workers is that they allow us to configure max concurrency and work within backend resource limits. Cloudflare Workers themselves are globally scalable and can handle massive concurrent execution, but that does not mean every dependency behind the worker can safely absorb the same level of concurrency.
In our case, the constrained resource is our Laravel backend. By setting a max concurrency limit, we can leverage Cloudflare's near-real-time processing capability while still staying within the resource constraints of the backend receiving those forwarded events.
That balance matters. It lets us process large volumes quickly without turning the consumer layer into a self-inflicted denial of service against our own ingestion backend.
By leveraging consumer workers this way, I was able to ingest events with an average wait time of less than 5 seconds.
Vendor lock-in to Cloudflare
On a high level, it may seem like this architecture locks us too deeply into Cloudflare. That is one of the reasons I kept Cloudflare Workers in a proxy role in front of our backend ingestion service rather than pushing more core business logic into the worker layer.
This gives us an easier migration path in the future. If we ever need to move away from Cloudflare, we can change the ingestion endpoint to point directly to our backend service or to another proxy layer that we control, without requiring a major refactor across the entire ingestion pipeline.
The Ingestion Backend Becomes the Bottleneck
Now comes the Laravel backend (ingestion) side of the architecture. Observability workloads come with their own scalability challenges. They are heavily write-oriented, and alongside handling thousands of requests, we also need to store millions of records in the database in near real time.
That creates a very different scaling profile from a traditional application backend. In this kind of setup, the primary bottleneck is no longer just the app server. The underlying database that stores these records becomes the main pressure point.
The traditional way of horizontally scaling app servers is not enough on its own because the workload is dominated by high-concurrency writes. The database layer needs to be designed specifically for fast write throughput, storage efficiency, and high availability under constant ingestion pressure.
Race conditions and deadlocks happen more often than most people expect in this kind of workload. When you are constantly inserting and updating observability data at high volume, concurrency issues do not stay theoretical for long. They show up quickly and can directly impact ingestion reliability.
Because of that, I designed our database strategy around storage optimization and dedicated shards for high-usage customers so large tenants can scale without creating unnecessary pressure on everyone else sharing the platform.
Environment-Level Database Sharding
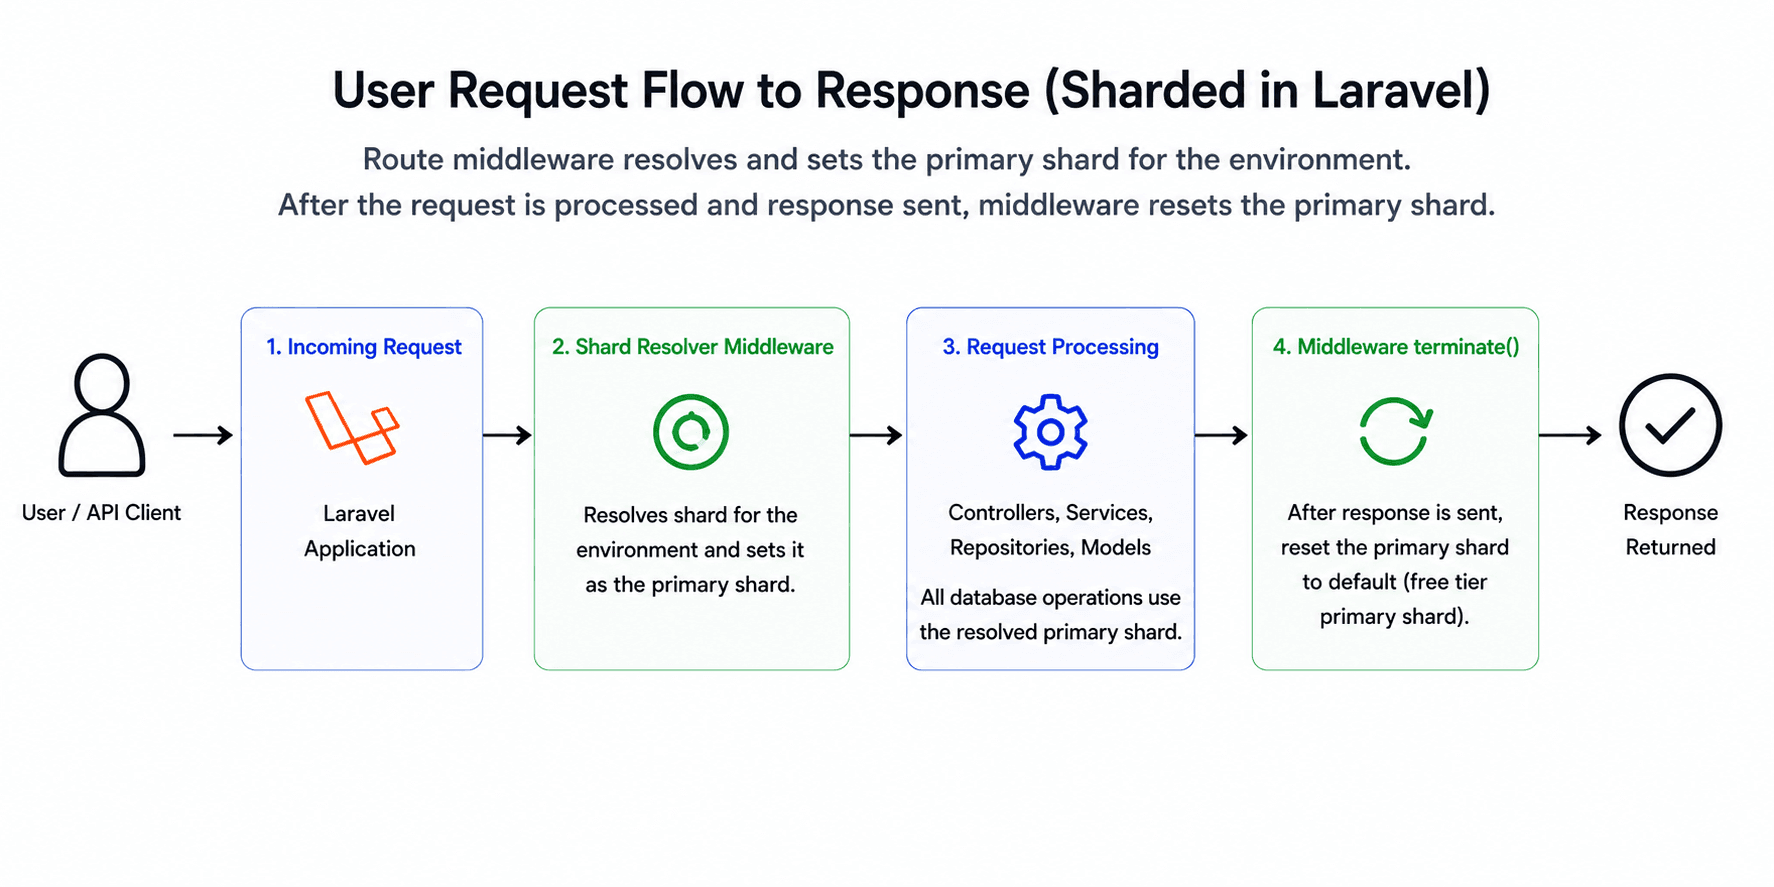
All customers in Laritor have applications, and each application can have multiple environments. Observability data is tied to an environment, and users access most of that data at the environment level. Because of that, I implemented database sharding at the environment level so data can be distributed cleanly across multiple shards.
Each environment has a shard configuration that determines where its observability data should be stored. Every environment has a primary shard and can optionally have a secondary shard. When a customer signs up on the free plan, the environment is assigned to our free-users database as its primary shard.
Once that customer becomes a paying user, we analyze their usage patterns and, depending on the workload, assign one of the paid shards as a secondary shard. This allows us to continue ingesting observability data in parallel on both the primary and secondary shards during migration.
After enough data is ingested into the secondary shard, we promote that secondary shard to become the new primary shard for the environment and stop writing to the old secondary path. This gives us a practical way to maintain multiple dedicated shards for paying customers while still offering generous compute and storage for free users. It also gives us the flexibility to provision fully dedicated shards for very high-usage customers when needed.
At the application layer, sharding is enforced through middleware applied to all routes prefixed by
an environment. That middleware resolves the environment's shard, sets it as the active primary shard,
and then allows the request to proceed. Once the request is complete, the middleware's
terminate method resets the active shard so we avoid shard leakage across requests.
Schema Design for Storage Efficiency
Storage efficiency is a separate problem of its own. Observability workloads require a huge amount of storage space, and database disk usage grows much faster than most people expect because you are storing gigabytes and eventually terabytes of data. That is why optimizing the schema for storage efficiency is extremely important.
One of our most common patterns is that every event is associated with a trace. A trace can be a request, a command, or a queued job. That means events often have a polymorphic relationship back to a trace record.
For example, if we are storing database queries, the queries table would typically
have two columns: traceable_id and traceable_type. The
traceable_id stores the related record ID, and traceable_type stores the
trace model class name, which could be something like App\Models\Request,
App\Models\Command, or App\Models\Job.
In Laravel, the relationship would usually be defined like this:
class Query extends Model
{
    public function trace(): MorphTo
    {
        return $this->morphTo();
    }
}
This is the out-of-the-box Eloquent way of defining polymorphic relationships, and it works well for most applications. But for observability workloads where storage grows exponentially, the default approach can increase storage usage significantly.
The main issue is the traceable_type column. With the default polymorphic
relationship, this column is typically defined as a varchar. So when we insert a
query record into the queries table with a traceable_type value like
App\Models\Request, that column consumes 19 bytes of storage: 18 bytes for the
string itself and 1 byte to store the string length.
Again, this is not a problem for the majority of workloads. But for observability systems, where we are storing millions of records in tables like this, the storage overhead grows very quickly. If we also add an index to that column, the storage usage of the index becomes significant too.
For example, if we store 100 million rows in this table, that single column alone would consume roughly 100 million × 19 bytes, which is approx 2GB of storage. If we add an index to the same column, that could add roughly another 2GB, bringing the total close to 4GB.
On the surface, that may not seem huge. But if we look deeper, this 4GB is only for one column in one table with 100 million rows. In observability workloads, you usually have many tables with similar columns, and each of those tables may eventually store billions of rows.
Replacing String Morph Types with Integers
To reduce that storage usage, I stopped defining traceable_type as a
varchar and instead defined it as an unsigned tinyint column. I then
mapped those string class names to integers so Laravel can still resolve the correct relationship
without storing the fully qualified class name in the database.
use Illuminate\Database\Eloquent\Relations\Relation;

Relation::enforceMorphMap([
    1 => App\Models\Request::class,
    2 => App\Models\Command::class,
    3 => App\Models\Job::class,
]);
By adding this to a Laravel service provider, I defined an integer mapping for the polymorphic relationship. The rest of the application code does not need to change. We can continue storing and querying polymorphic relationships the same way, and Laravel takes care of converting between the stored integer and the corresponding model class during reads and writes.
This change alone saved me a meaningful amount of storage. An unsigned tinyint
consumes only 1 byte of storage and supports values up to 255, which is far more than enough
for our use case.
That means 100 million records would consume roughly 100MB for this column, and with the index added, the total would be closer to about 200MB instead of roughly 4GB with the default string approach.
This small change alone brought the storage usage for this column down from roughly 4GB to about 200MB, which is about a 95% reduction.
And as I said earlier, this saving is only for this one column in one table with 100 million rows. We have many tables that require similar columns, and each of them stores millions or eventually billions of rows. When you combine that across the full observability dataset, the total storage savings become very significant.
You might be wondering why I chose tinyint instead of an enum column
type. There are two reasons. First, enum types require schema changes whenever you
add or remove values, which can affect production performance on very large tables. Second, it is
simply a personal preference. I generally prefer integers with explicit application-level mapping
because it gives me more control.
We applied a similar strategy throughout the application wherever it made sense, replacing strings with compact integers as much as possible to reduce long-term storage costs.
Normalizing Repeated String Values
We also normalized our tables as much as possible, primarily to save storage space and improve write speeds. Instead of storing full string values directly in high-volume transactional tables, we created lookup tables for repeated values and stored only their integer references in the main tables.
For example, to store mail events, instead of defining a table like
mails(id, mailable, recipient), we created a lookup table called
mailables(id, mailable) and then stored the reference in the main table as
mails(id, mailable_id, recipient).
This works well because the mailable is a Laravel class and usually stays the same
for every mail sent using that class. So instead of storing the full class name repeatedly in the
transactional table, we store its integer ID, which consumes far less space and keeps indexes
smaller as well.
We repeated the same strategy across other parts of the product too, including notifications, cache operations, feature flags, custom events, and similar datasets where repeated string values show up at high volume.
Choosing the Right Storage Hardware
For write-heavy workloads, the underlying hardware also plays a major role in overall performance. When the system is constantly ingesting records, the database ends up performing a very high number of I/O operations, which means you can run out of IOPS much faster than expected.
If you are using a storage class with fixed IOPS, like certain Amazon RDS storage setups, then performance is directly tied to the amount of IOPS provisioned for the instance. Lower IOPS simply cannot handle the write throughput required by observability workloads. In practice, this often pushes you toward purchasing dedicated IOPS to keep up with demand, which can become very expensive if you are not monitoring it carefully.
One of the reasons DigitalOcean worked well for this part of the system is that its block storage performance is driven more by the underlying hardware characteristics instead of a tightly fixed IOPS model. By leveraging DigitalOcean block storage backed by NVMe-based SSDs, I was able to drastically improve write performance compared to more traditional SSD-backed setups.
Tuning MySQL Log Flush Behavior
I also tuned MySQL itself for this kind of workload. By default, MySQL writes transactions to the log file immediately after execution. At observability scale, where the workload is extremely write-heavy, flushing every transaction to disk right away can hurt performance because it adds extra I/O pressure on every insert.
To reduce that bottleneck, I configured MySQL to flush log data to disk less frequently using the following settings:
innodb_flush_log_at_trx_commit = 2
innodb_flush_log_at_timeout = 5
The tradeoff is straightforward: if the MySQL server itself crashes, we may lose up to 5 seconds of data. In our case, that was an acceptable tradeoff because all event ingestion is backed by a queue, and I can safely retry queued jobs if I detect a MySQL crash.
This relatively small configuration change improved our insert performance by approximately 60%.
Avoiding Deduplication Deadlocks
Race conditions also occur far more frequently in observability workloads than most people expect. Consider a simple scenario where we need to resolve a route record and use its ID while storing requests. The most basic implementation might look like this:
$route = Route::query()->updateOrCreate([
    'name' => $routeName,
], [
    'url' => $routeUrl,
]);
This works fine for most applications. But under high concurrency, it can still lead to race conditions and duplicate records if multiple workers attempt the same insert at the same time.
A more robust improvement is to add a unique index on the name column in the
routes table and use an upsert:
Route::query()->upsert([
		['name' => $routeName, 'url' => $routeUrl]
	], ['name'], ['url']
);

$route = Route::query()
    ->where('name', $routeName)
    ->first();
On the surface, this looks efficient. But there is still a minor problem with it. If the
routes table uses an auto-increment primary key, every upsert attempt can still
advance the auto-increment counter even when no new row is actually inserted. That is not a
problem for most applications, but under high traffic it can make the ID space grow very quickly.
There is also some operational overhead with upserts. Under the hood, Laravel translates this to
an INSERT ... ON DUPLICATE KEY UPDATE query. The execution path looks roughly like
this:
-> allocate auto_increment
-> check unique index
-> duplicate found
-> lock existing row
-> evaluate update expressions
-> compare values
-> update values or skip if no changes
Under high concurrency, that can still lead to performance degradation and deadlocks because the existing row may be locked during the upsert path. Even if there are no actual changes to persist, MySQL still needs to lock the row, compare values, and decide whether an update is needed.
Even though the overhead is usually small, I decided to avoid upserts here to reduce the risk of deadlocks. Instead, I followed this approach:
$route = Route::query()
    ->where('name', $routeName)
    ->first();

if (is_null($route)) {
    Route::query()->insertOrIgnore([
        'name' => $routeName,
        'url' => $routeUrl,
    ]);

    $route = Route::query()
        ->where('name', $routeName)
        ->first();

    if ($route->url !== $routeUrl) {
        $route->update(['url' => $routeUrl]);
    }
}
Under the hood, this translates into an INSERT IGNORE INTO routes query, which
looks more like this operationally:
-> check unique index
-> duplicate found
-> skip row
Instead of trying to update the row or throwing an error when a duplicate is detected, MySQL simply ignores the conflict. That makes this pattern a better fit for highly concurrent applications where the goal is to avoid unnecessary locking and reduce the chance of deadlocks.
Removing Non-Critical Writes from the Hot Path
I ran into a similar pattern with queries. In Laritor, we have one table to store the query
itself, for example queries(query, last_executed_at), and another table called
query_executions to store execution metadata such as when the query ran, where it
ran, and how long it took.
In Laravel, the straightforward way to store this data would usually look like this:
DB::transaction(function () {
    foreach ($queries as $query) {
        Query::query()
            ->where('id', $query->id)
            ->update([
                'last_executed_at' => $query->executed_at
            ]);

        QueryExecution::query()
            ->create([
                'query_id' => $query->id,
                'executed_at' => $query->executed_at,
                'duration' => $query->duration,
            ]);
    }
});
There are three main problems with this approach.
First, updating last_executed_at under high concurrency can lead to deadlocks.
Second, the indexes on the queries table may need to be regenerated on every
update, which becomes expensive under heavy write pressure.
Third, inserting each query_executions row individually causes a full
roundtrip for every query execution, which quickly becomes a performance bottleneck.
My first improvement was to bulk insert the query_executions records and sort
queries by ID before applying updates to reduce deadlock risk:
DB::transaction(function () {
    foreach ($queries->sortBy('id') as $query) {
        Query::query()
            ->where('id', $query->id)
            ->update([
                'last_executed_at' => $query->executed_at
            ]);

        $records[] = [
            'query_id' => $query->id,
            'executed_at' => $query->executed_at,
            'duration' => $query->duration,
        ];
    }

    QueryExecution::query()
        ->insert($records);
});
That solved the problem of separate inserts and repeated roundtrips into
query_executions, but it still left the possibility of deadlocks on the
queries table because we were continuing to update last_executed_at
in real time.
So I stepped back and asked myself a simpler question: where is last_executed_at actually
used, and am I okay if it is a few seconds behind? My answer is yes.
Once I realized that, I removed that update from the real-time ingestion path entirely and moved it into a scheduled task. Our ingestion code became:
DB::transaction(function () {
    foreach ($queries as $query) {
        $records[] = [
            'query_id' => $query->id,
            'executed_at' => $query->executed_at,
            'duration' => $query->duration,
        ];
    }

    QueryExecution::query()
        ->insert($records);
});
Then I created a scheduled task to update the last_executed_at timestamp every
thirty seconds:
Schedule::call(function () {
    // Bulk update queries table with last_executed_at timestamp
})->everyThirtySeconds()
    ->withoutOverlapping()
    ->runInBackground();
This helped me avoid deadlocks entirely on that path and also removed the constant index
regeneration overhead that would have happened if I kept updating the queries
table on every single execution insert.
Why I Avoided OLAP Databases
Laritor is primarily powered by MySQL. In the observability space, many platforms rely on OLAP databases like ClickHouse, Snowflake, and similar systems. I deliberately avoided that approach and chose to stay with MySQL for a few reasons.
First, OLAP databases are powerful, but they also come with their own complexity and operational challenges. Laritor is a small bootstrapped company, and I wanted to build on tools I already know well and am deeply confident operating at scale.
Second, OLAP databases can get expensive very quickly. Many of them charge based on query execution. For observability workloads, where the system may execute thousands of queries per second, that pricing model becomes expensive fast. I wanted Laritor to stay affordable for every Laravel developer, and that is one of the reasons Laritor is priced 60% to 80% lower than many alternatives in the Laravel performance monitoring space.
Third, by sticking to widely used and familiar tooling, I avoid a lot of setup and operational complexity. That also gives me a cleaner path if I ever decide to make Laritor open source or offer a self-hosted version in the future.
As for dashboard performance, I was able to avoid OLAP databases and still keep the dashboard fast even with millions of rows by heavily optimizing the database and queries.
I will likely write a Part 2 of this post focused entirely on how I kept the dashboard fast while avoiding the complexity of OLAP databases.
Try Laritor
If you are building and scaling Laravel applications in production, try Laritor and see how much visibility you can get without paying the typical observability performance tax.
You can start monitoring requests, queries, jobs, scheduled tasks, exceptions, logs, cache operations, outbound requests, and more with a setup designed specifically for Laravel.