Performance Monitoring for Laravel Apps
Laritor helps you track and improve your Laravel app’s performance with continuous insights, automated alerts, and deep analytics, so you can focus on building, not debugging.
See Laritor in Action
Watch a quick walkthrough of Laritor’s performance monitoring & observability dashboard. See how easy it is to set up, track key metrics, spot slow endpoints, and receive instant alerts in one unified interface.
Optimized For Laravel Apps
Laritor is purpose-built for Laravel apps, capturing framework-specific features like jobs, commands, mails, cache, context and more. Then visualizing them in a unified, intelligent timeline with zero setup required.
Tracks every HTTP request with rich contex, URL, status, duration, memory, user, and more.
Commands
Monitors artisan commands with start/end time, exit codes, and optional output capture.
Scheduled Tasks
Logs all scheduled jobs, including their timing, performance, and results.
Queued Jobs
Captures job lifecycle, queue, status, delay, execution time, and origin of dispatch.
Exceptions
Records full stack traces, messages, and metadata for every unhandled exception.
Queries
Tracks all database queries with bindings, execution time, and N+1/duplicate detection.
Outbound Requests
Monitors external API calls with timings, status, and optional request/response data.
Cache Hits
Logs cache key usage and when they’re hit, across your app’s logic.
Logs
Captures log messages, levels, context, and timestamps directly from your app.
Mails
Tracks sent emails with recipient, subject, mailable class, and when they were sent.
Notifications
Monitors notifications including the recipient, class, and dispatch timestamp.
Health Checks
Runs built-in and custom checks on queues, tasks, DB, cache, sessions, and more.
Task Scheduler
Tracks whether Laravel’s native task scheduler is running and triggering tasks on time.
Server Metrics
Continuously monitors CPU, memory, and disk usage across your infrastructure.
Start Monitoring in Under 30 Seconds
Get Laravel performance monitoring and end-to-end observability up and running instantly with Laritor. One install gives you real-time insights purpose-built for Laravel developers.
Install Laritor Ingest Package
composer require binarybuilds/laritor-client
Add env variables:
LARITOR_ENABLED=true
LARITOR_INGEST_ENDPOINT=ingest-url
LARITOR_BACKEND_KEY=your-unique-key
No More Bottlenecks
Laritor gives you everything you need to catch performance issues early, from AI-powered insights to low-latency data streaming. It's built to help you debug faster, reduce noise, and stay focused on what matters.
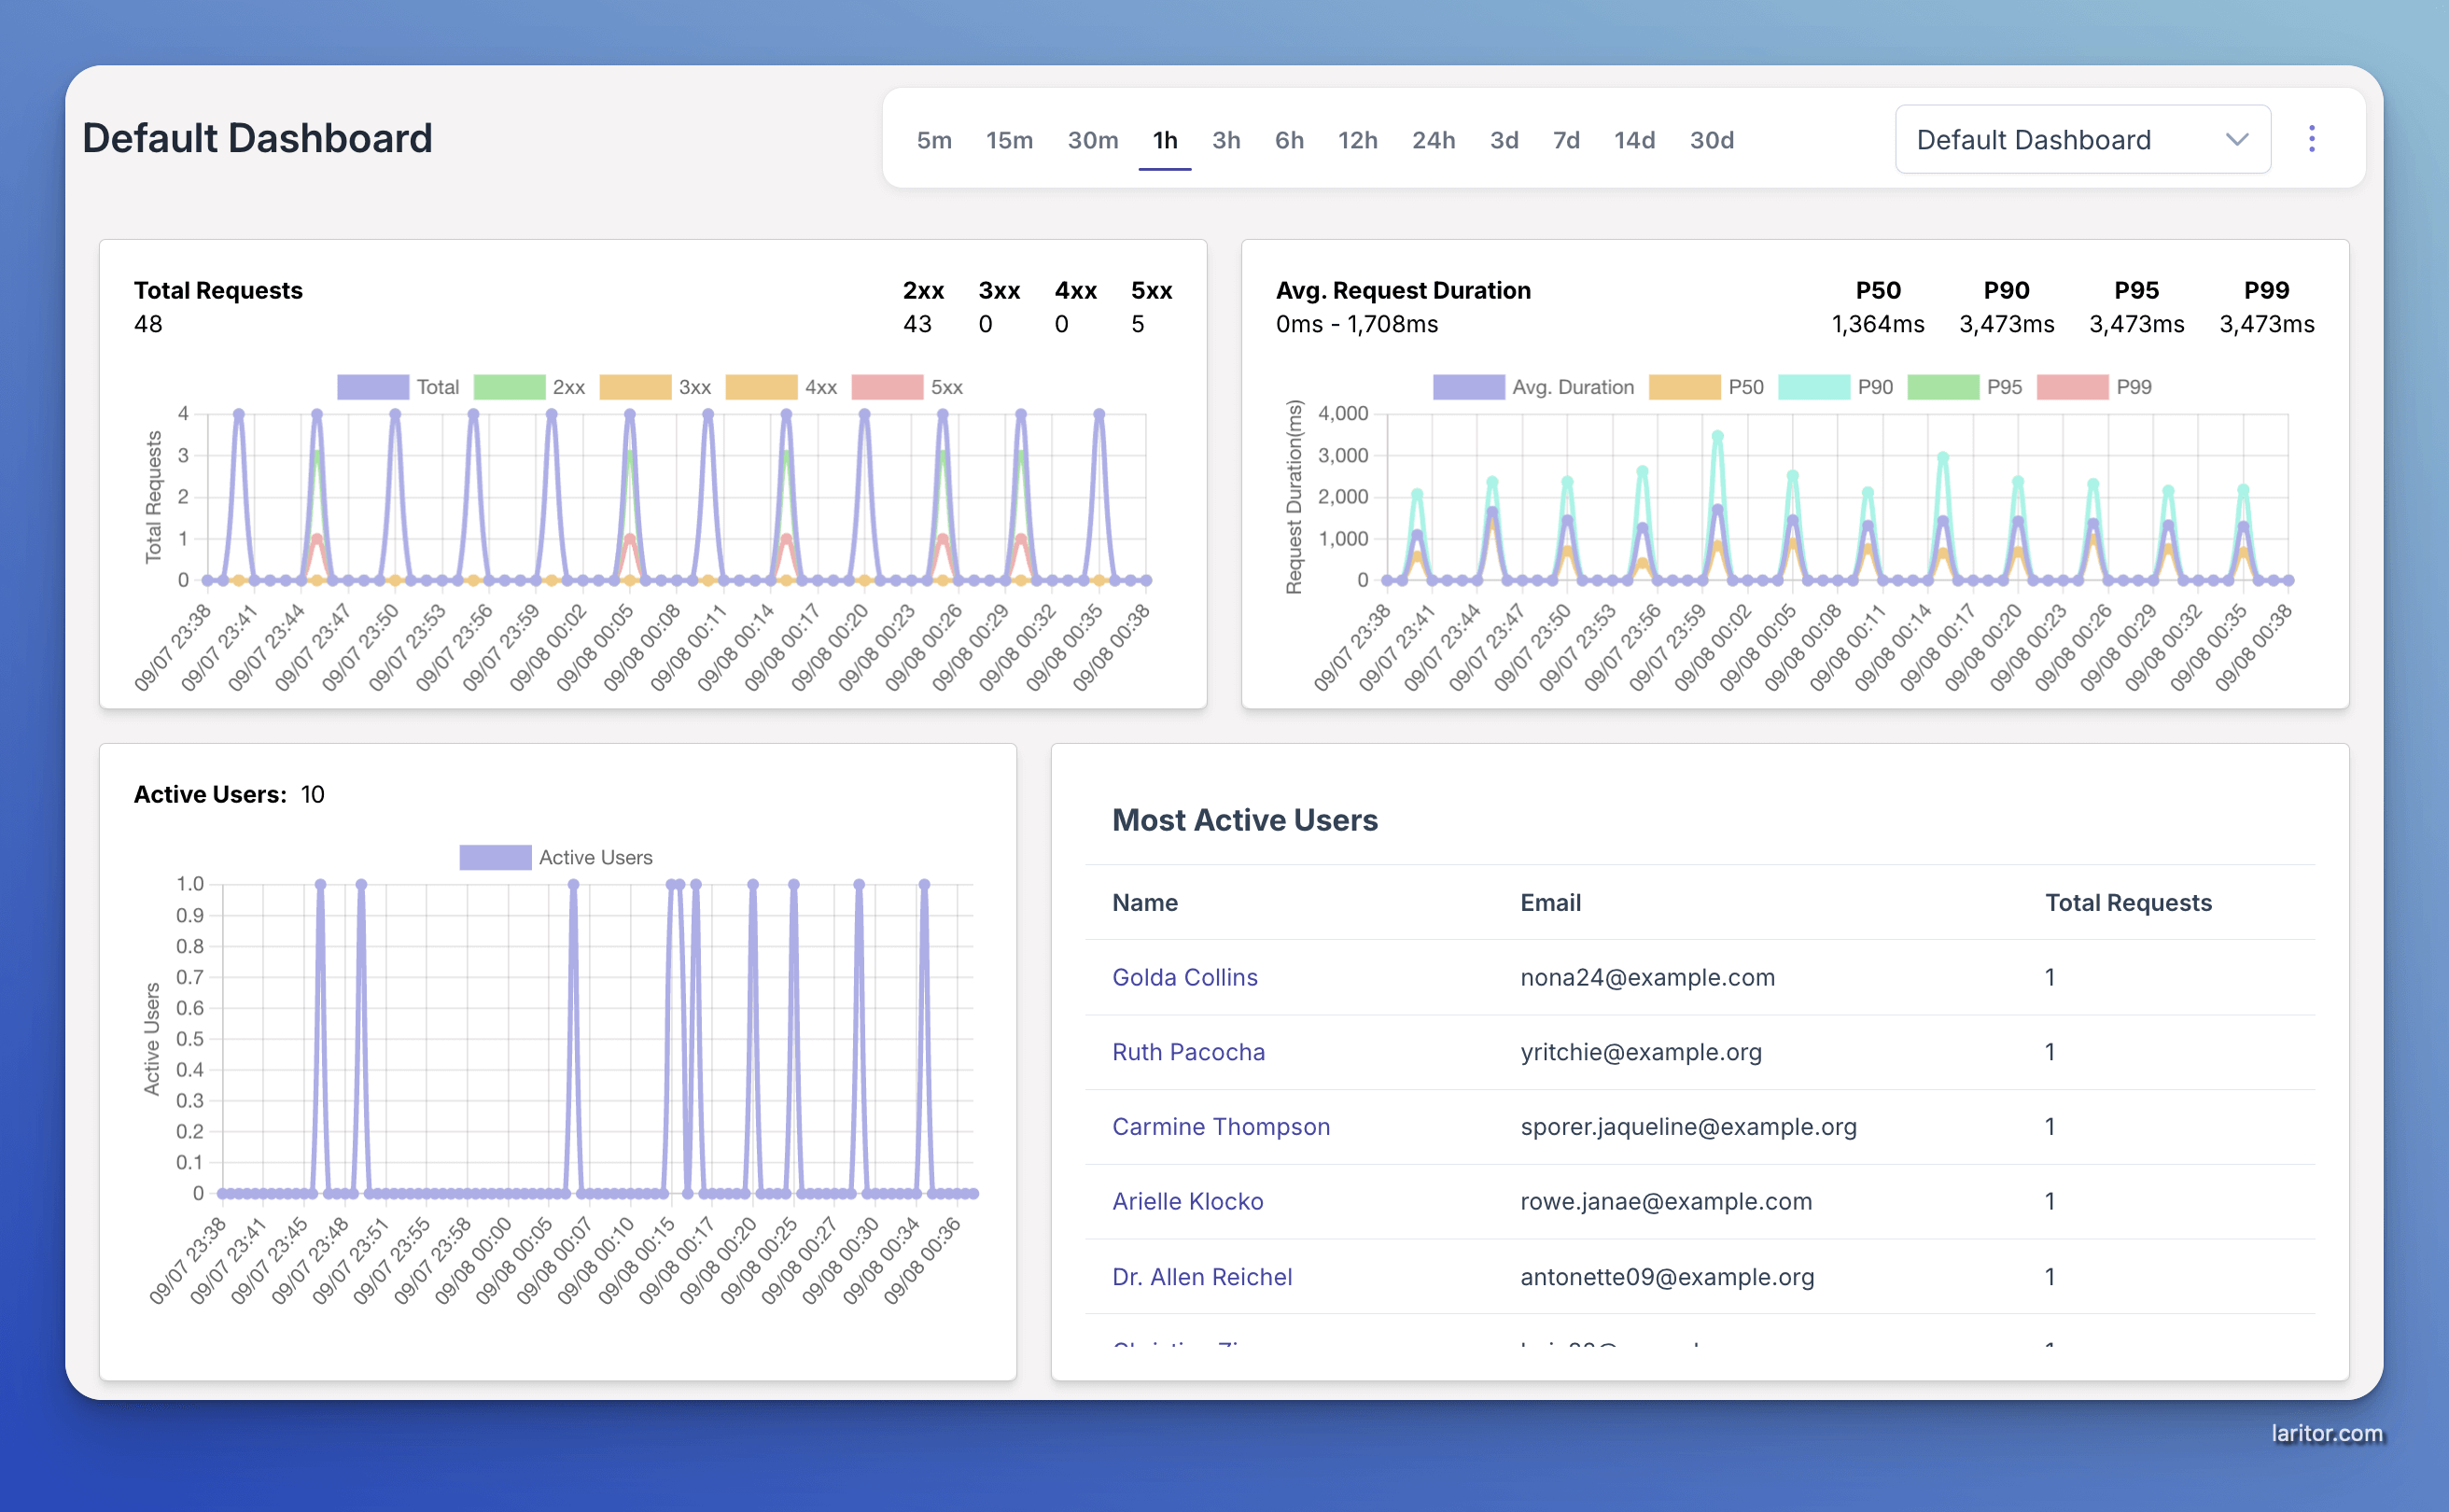
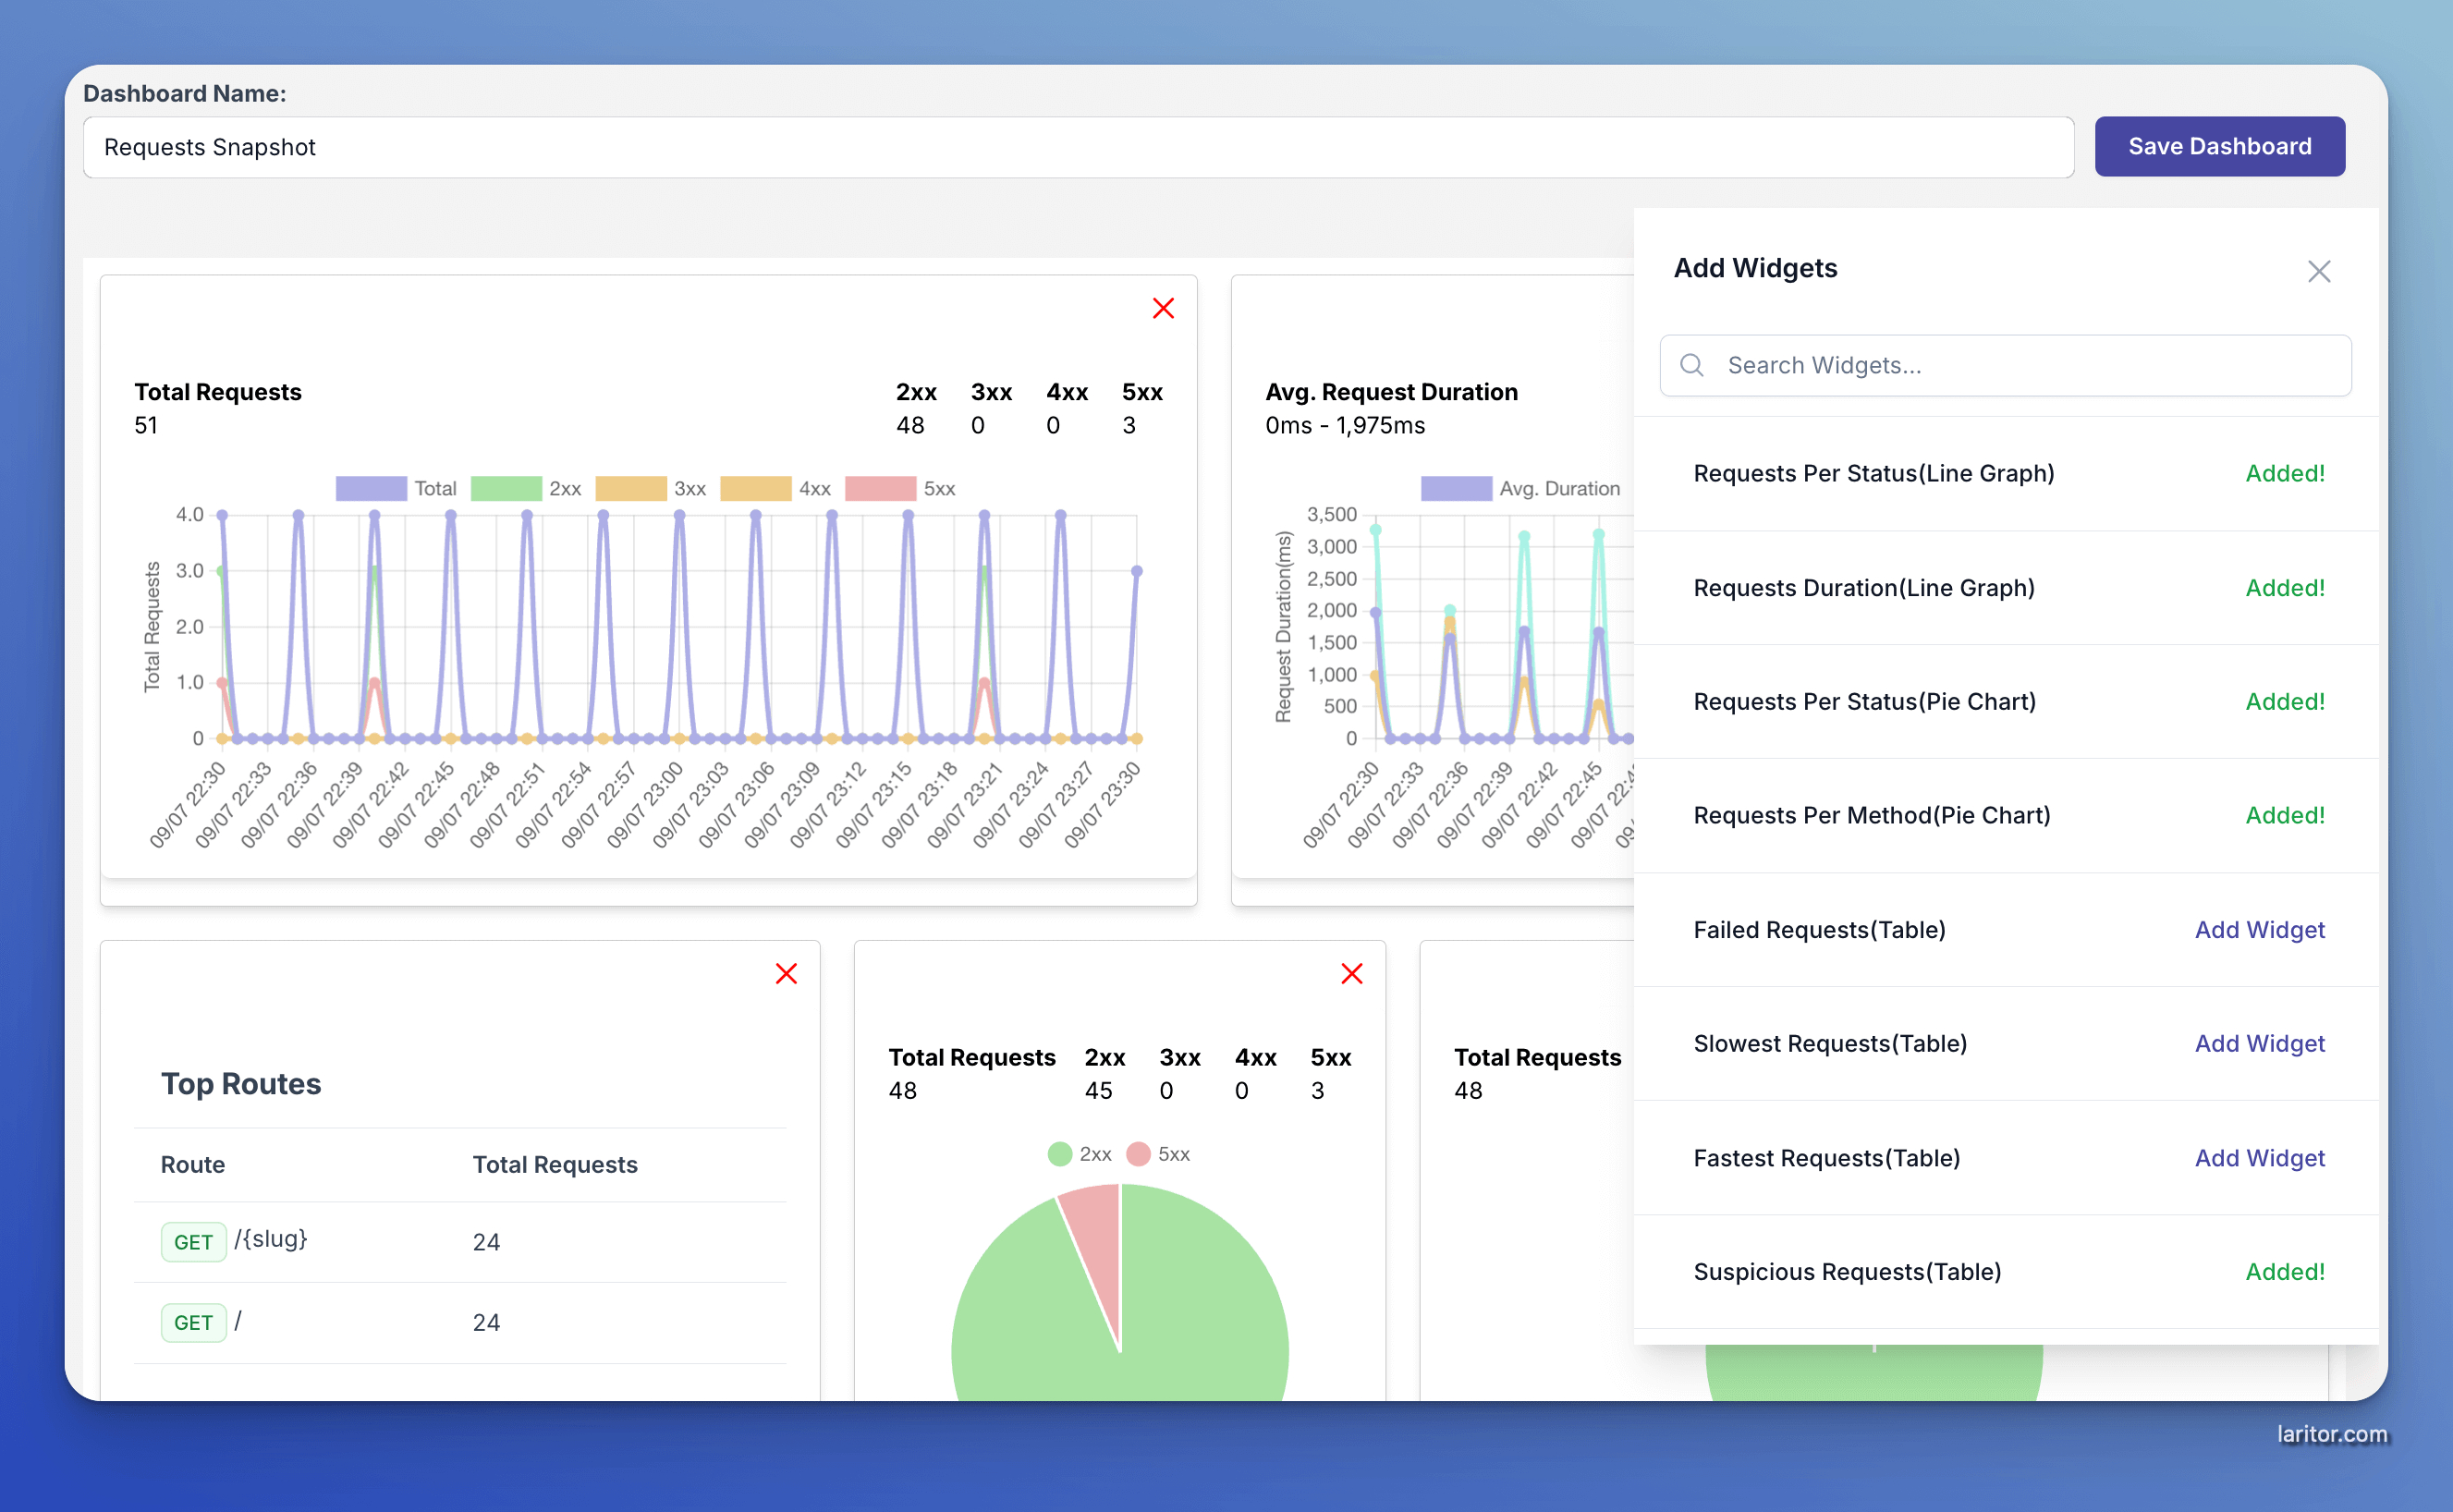
Customizable Dashboards
Laritor lets you build custom dashboards by simply dragging and dropping charts, giving you deep, live insights into your app’s performance without writing any code.
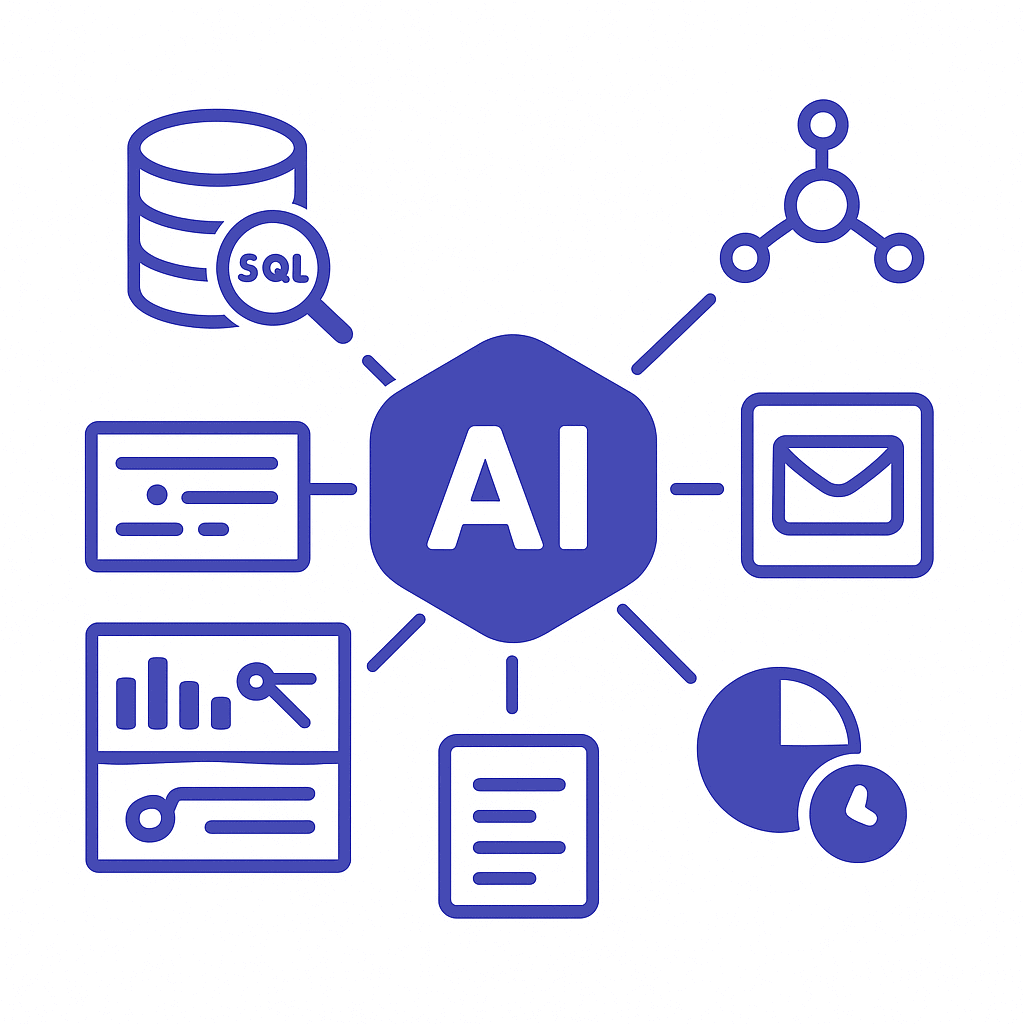
AI-Powered Optimization
Laritor’s AI analyzes every step of a request, including database queries, queued jobs, emails, logs, and more. It compares them against your schema and delivers tailored, end to end performance recommendations, not just simple query tweaks.
×![Full Image]()
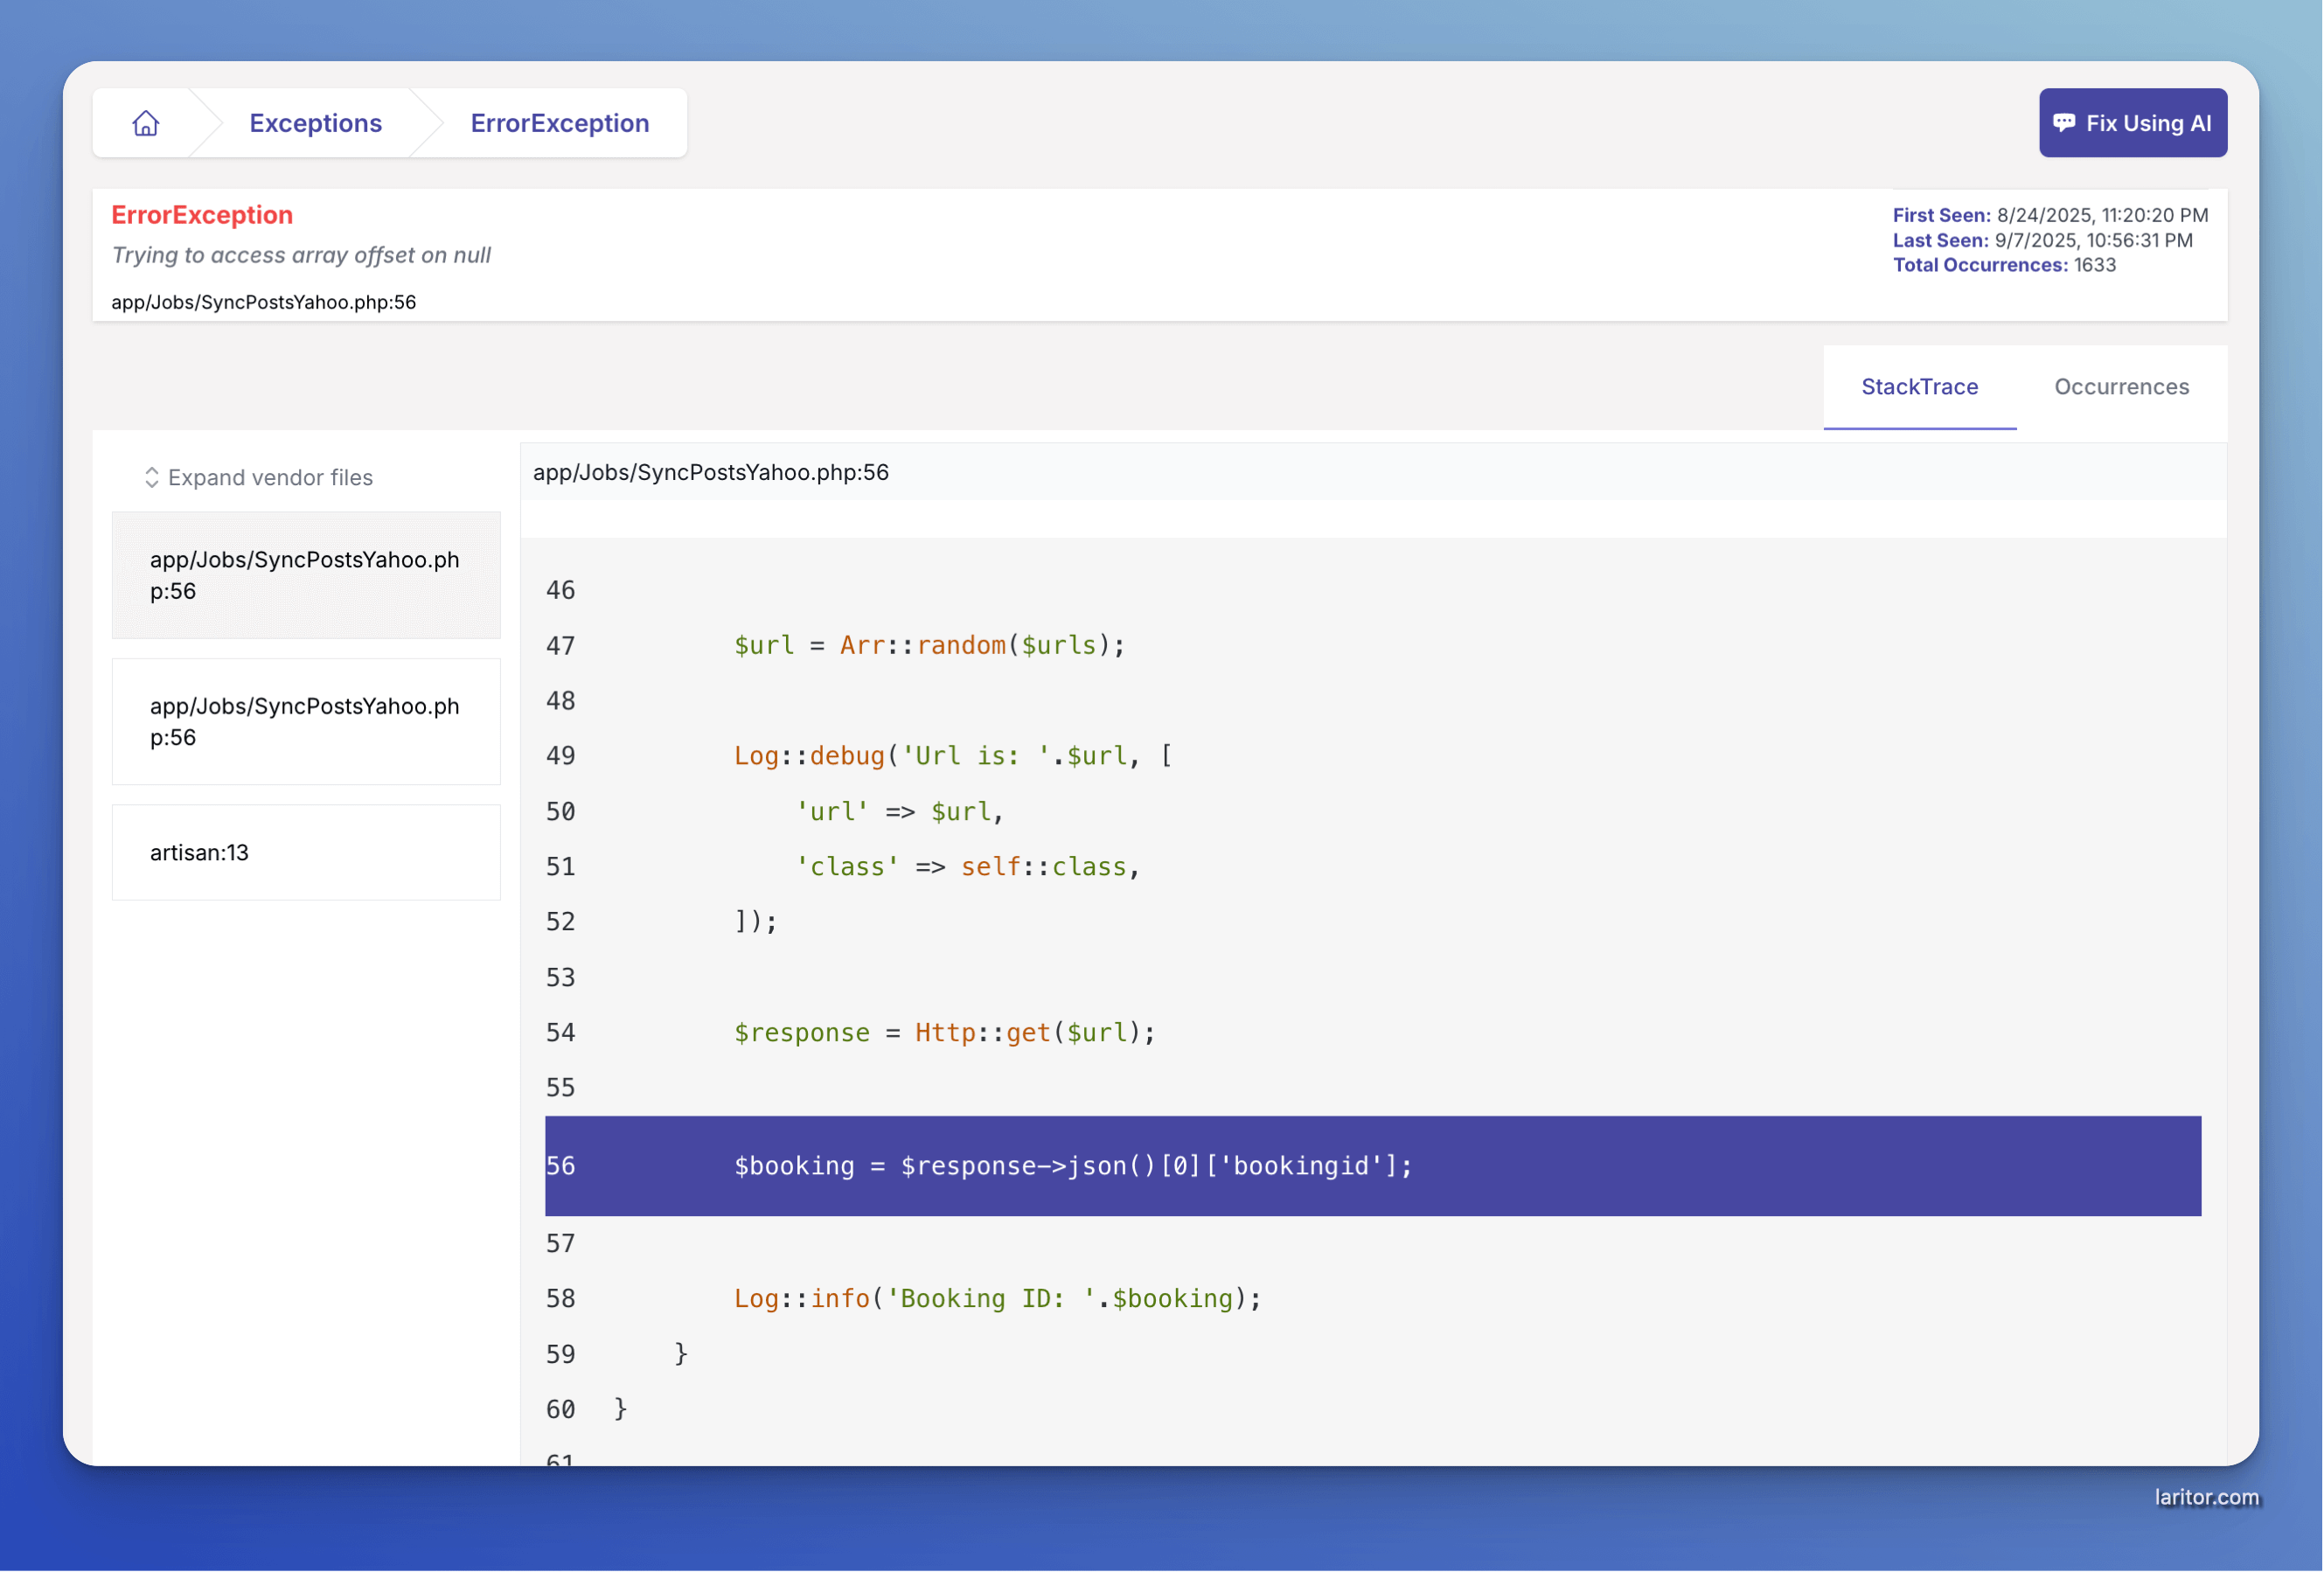
Error Tracking
See exactly where bugs occur with stacktraces, highlighted error lines, and deep exception context. Fix them instantly with AI assistance.

Instant Team Alerts
Define custom triggers such as slow requests, 4xx and 5xx errors, slow queries, exceptions, failed health checks, or server resource spikes. Laritor sends alerts directly to Email, Slack, Discord, Microsoft Teams, or any webhook endpoint.
×![Full Image]()
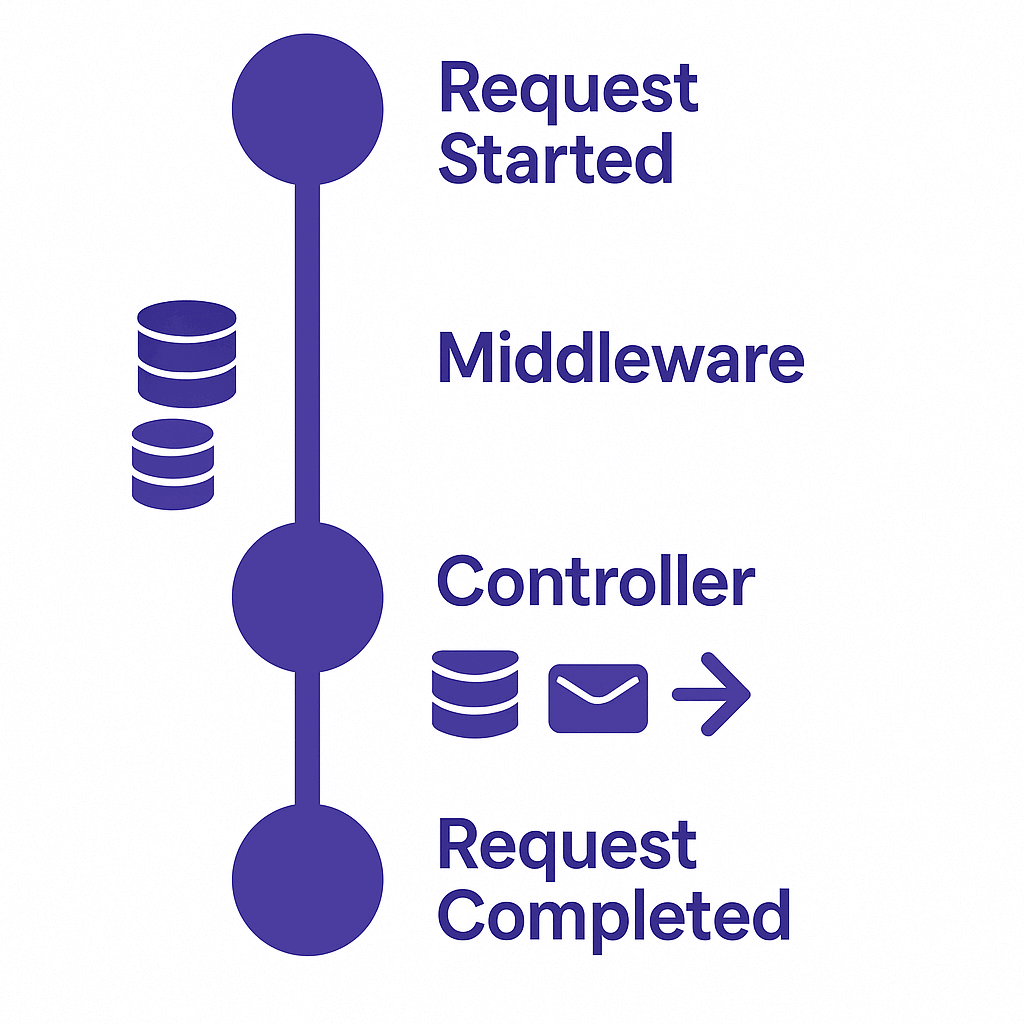
Interactive Request Timeline
Laritor captures every step of a request, including database queries, sent emails, notifications, queued jobs, log entries, and exceptions, in the exact order they occur. Everything is displayed in a clear timeline so you can trace and troubleshoot performance issues at a glance.
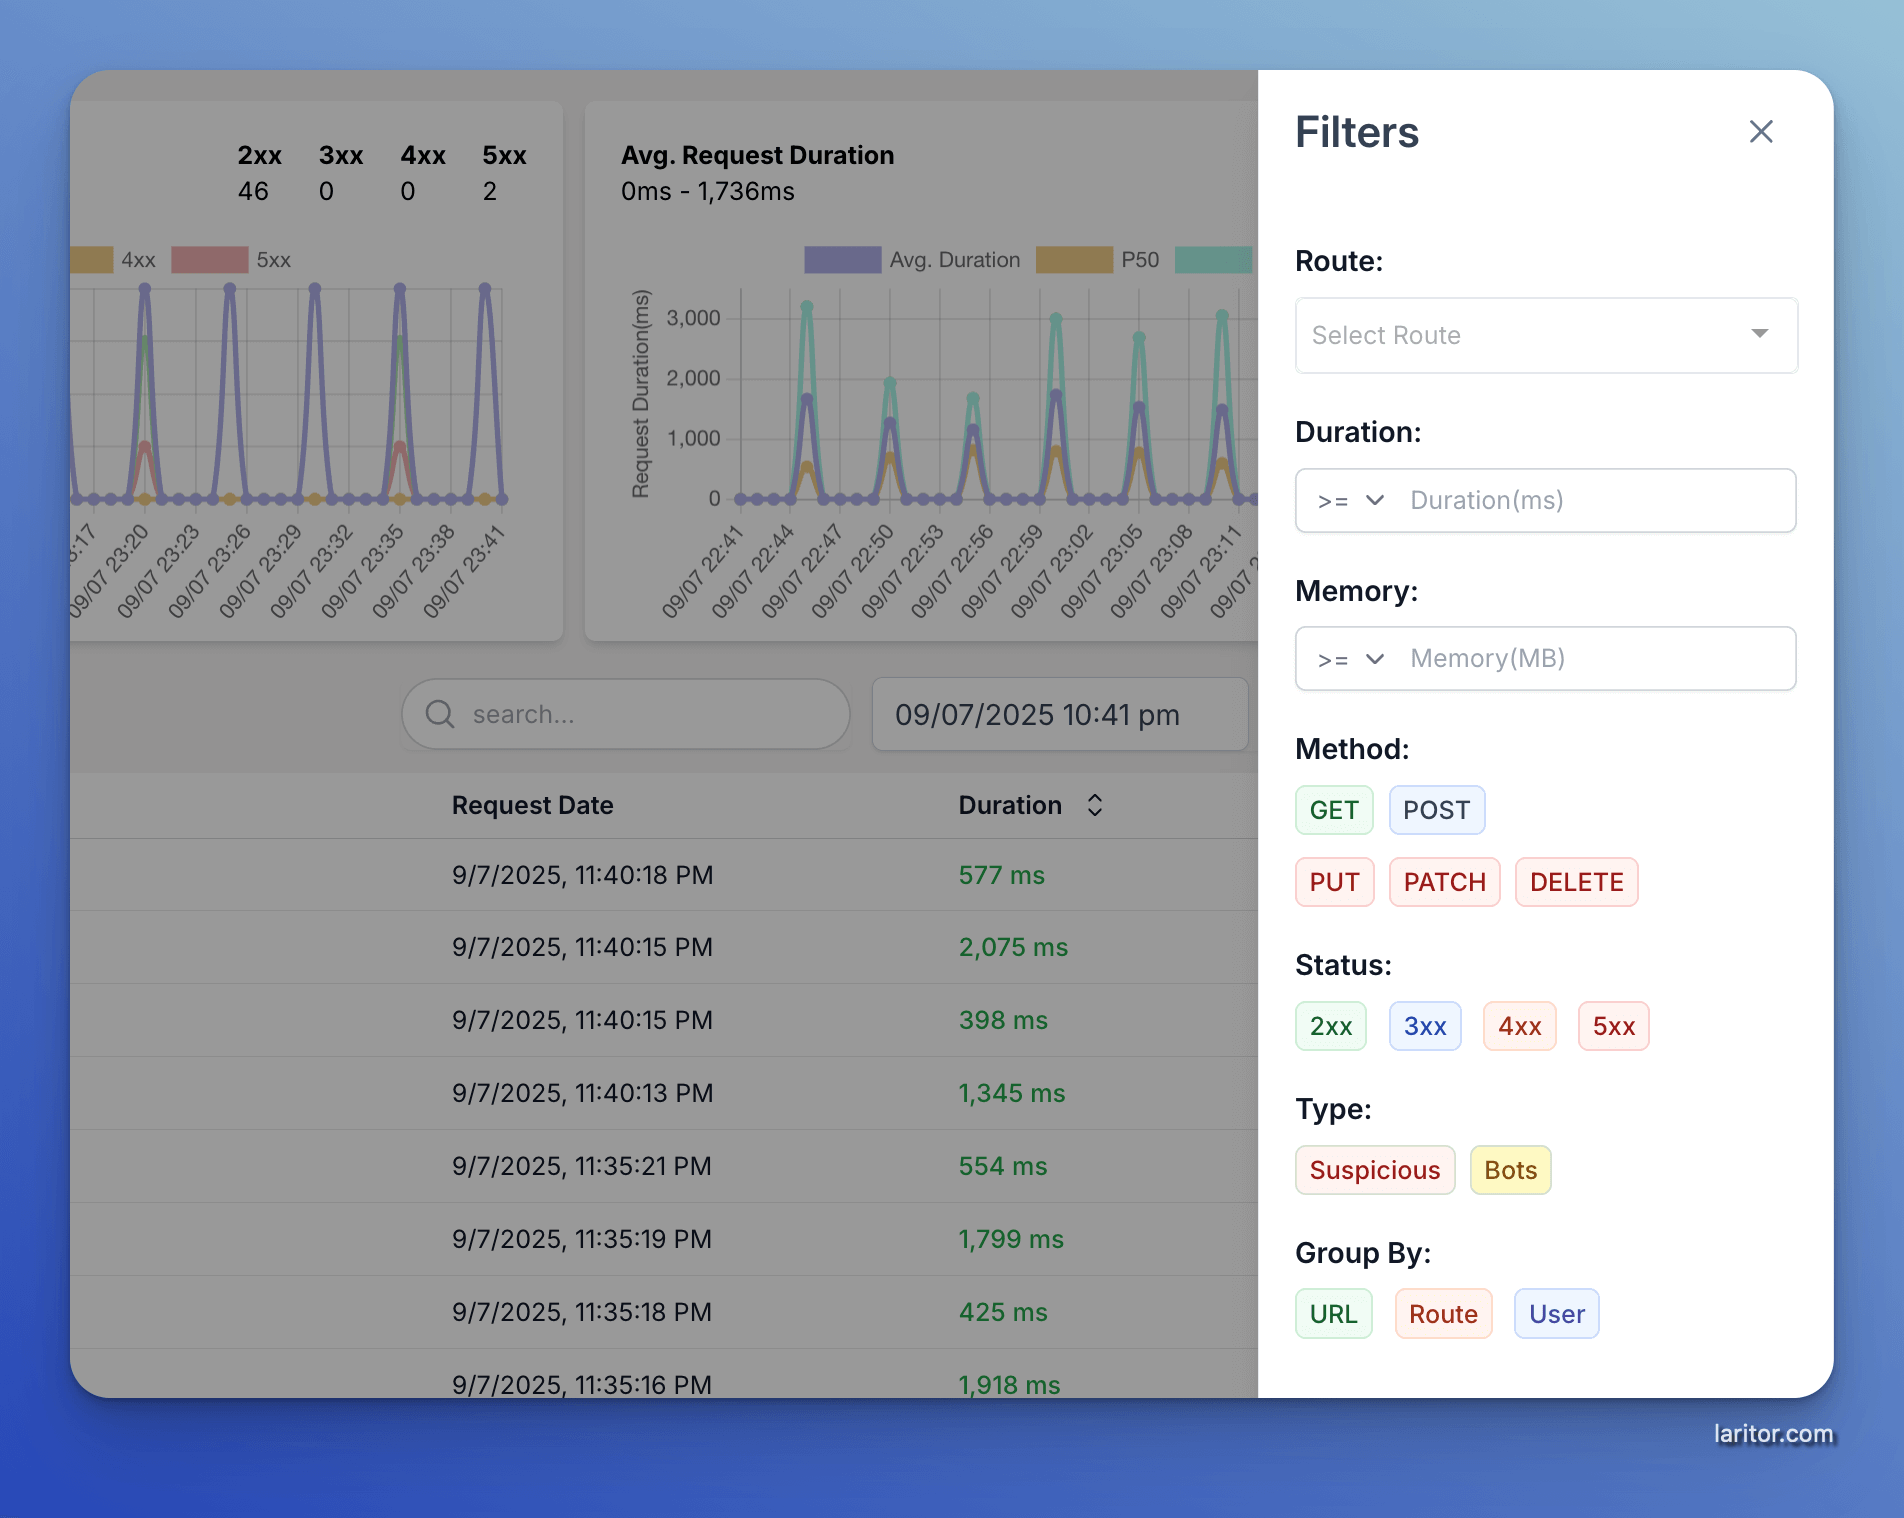
Advanced Filtering
Pinpoint the exact requests you need by chaining filters like date and time ranges, keyword searches, status codes, HTTP methods, routes, duration, memory usage, suspicious patterns, and bot traffic. Drill down to the most critical events in seconds.
×![Full Image]()
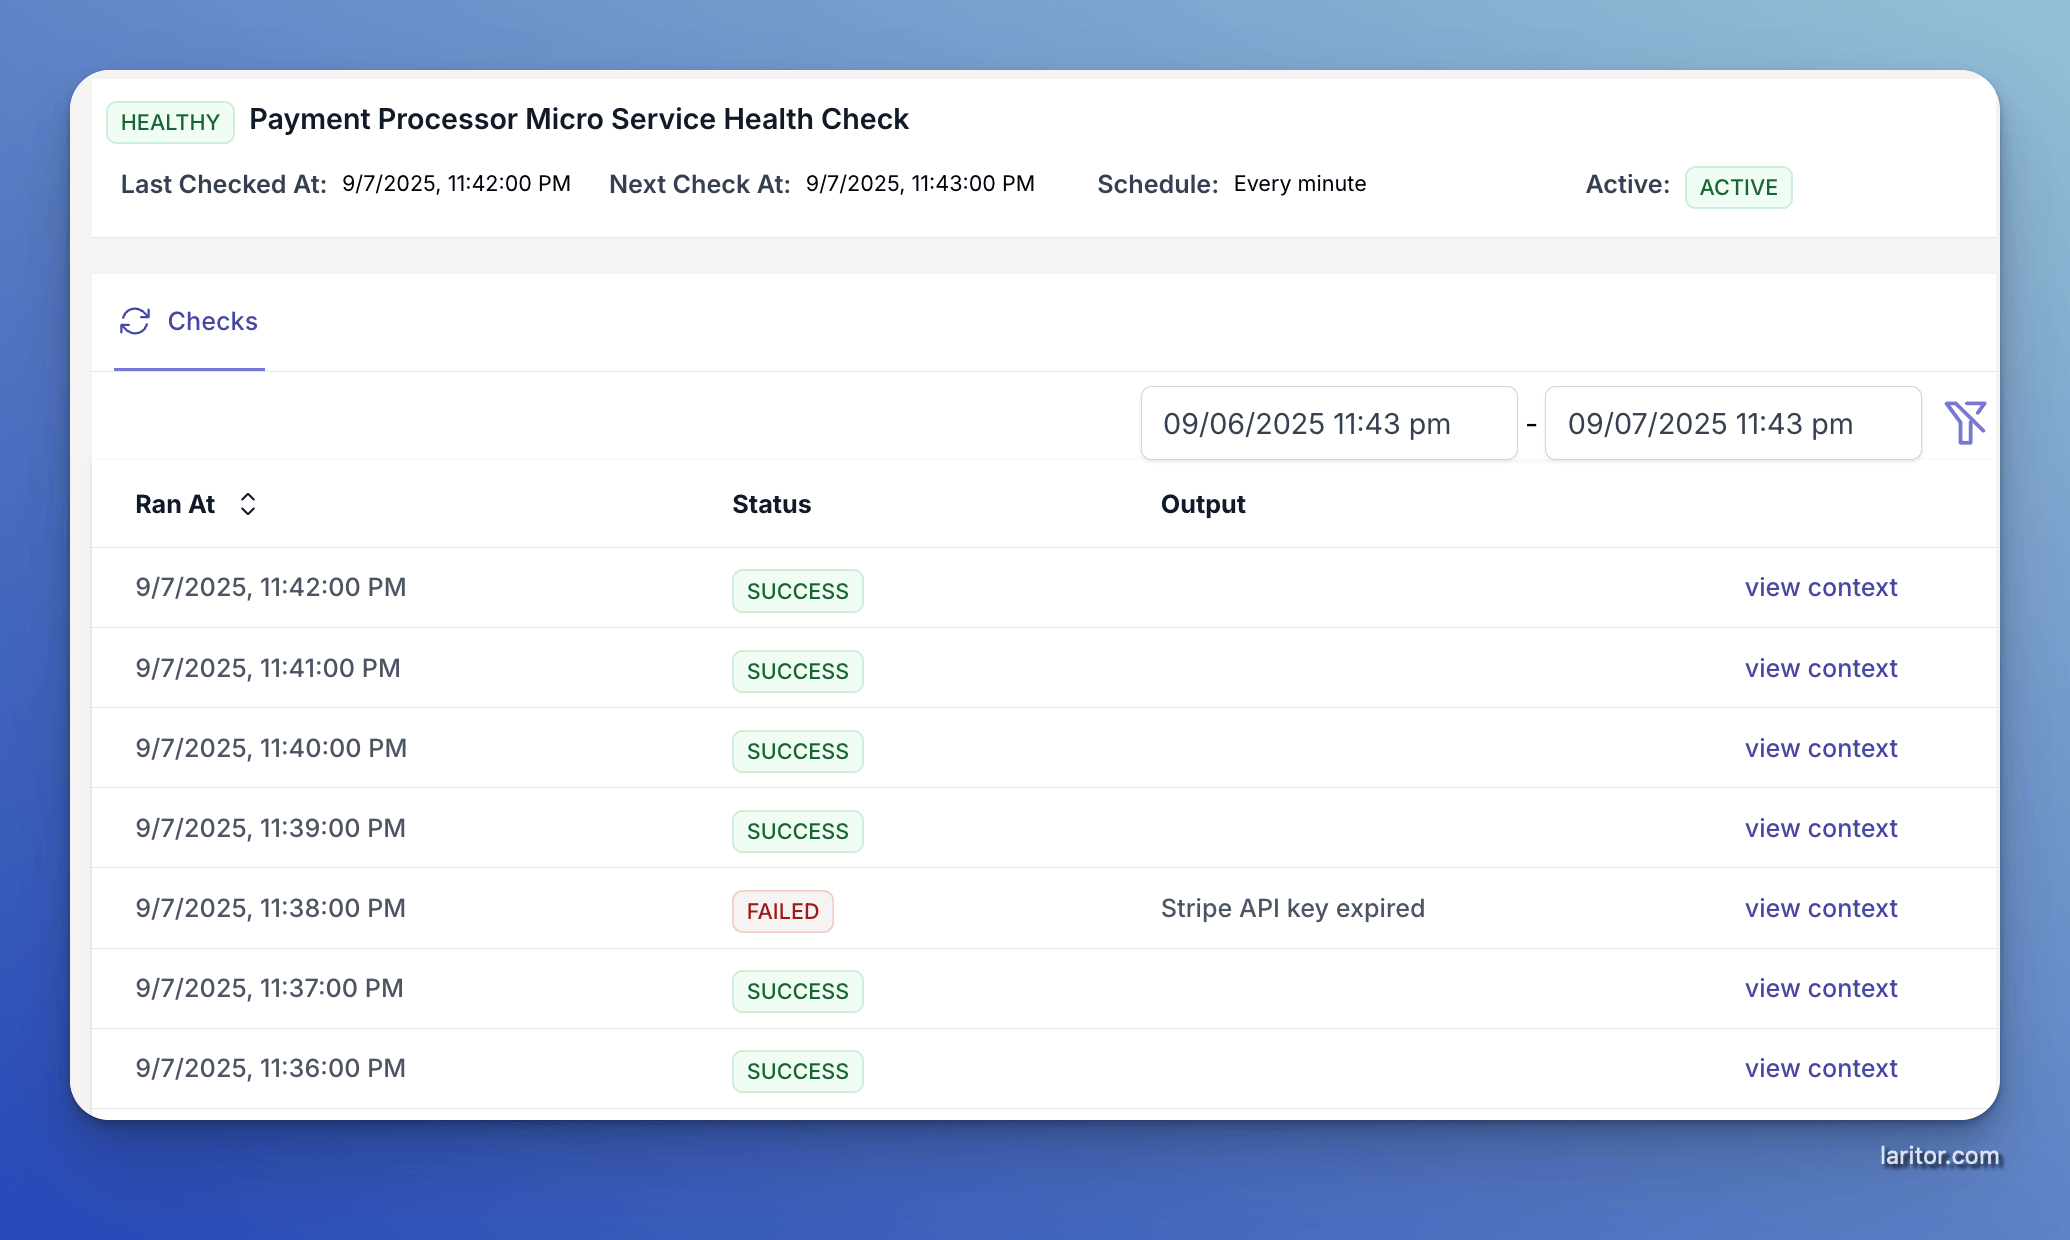
Extensible Health Checks
Extend Laritor’s built-in HealthCheck class to define your own pass or fail logic and custom success or failure messages. You can schedule any check to run at your preferred interval, and Laritor will trigger an alert automatically if it ever returns false.
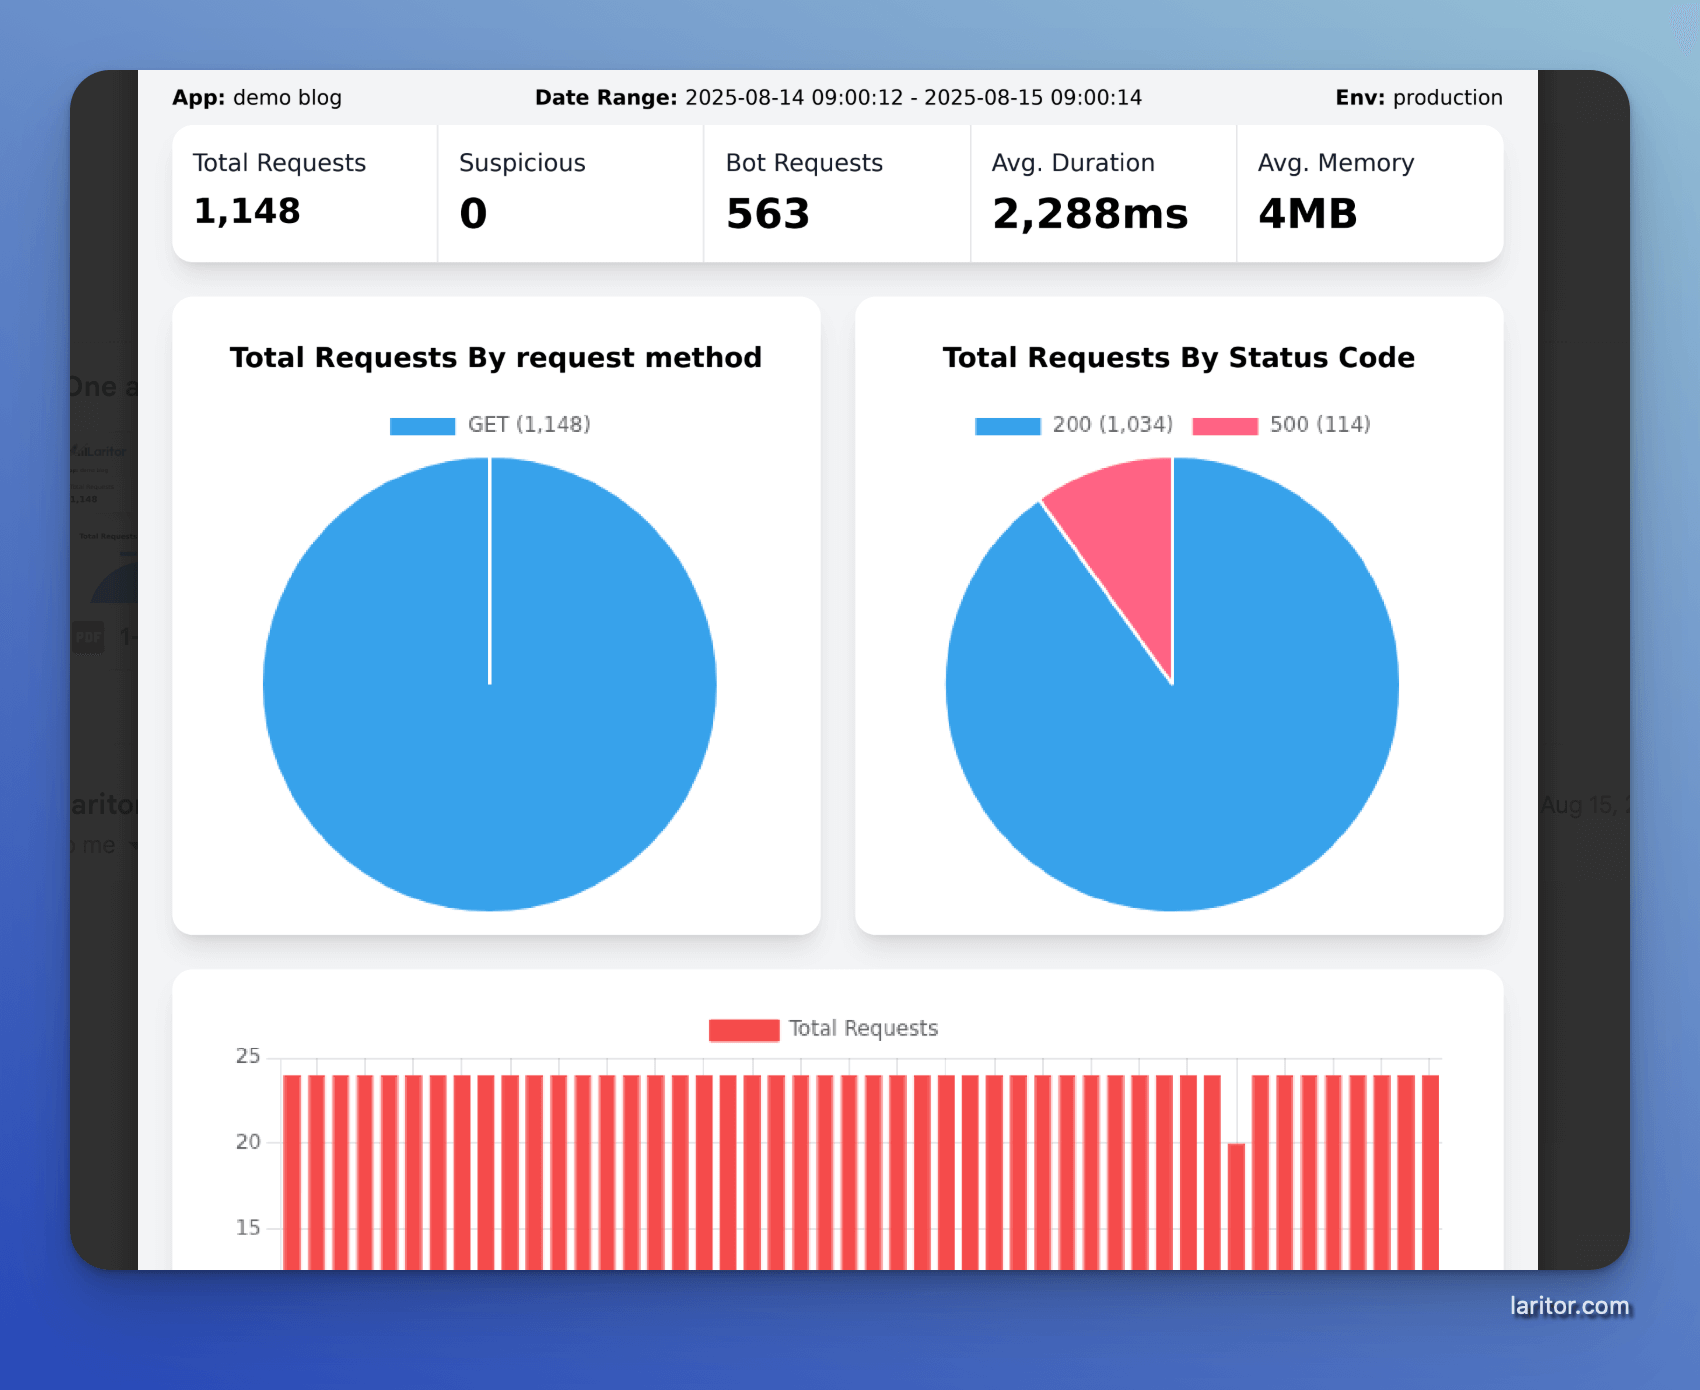
Customizable PDF Reports
Generate tailored reports with the metrics you choose and have them delivered straight to your inbox on a daily, weekly, or custom schedule.
×![Full Image]()
Start Monitoring Today
It’s time to take control of performance bottlenecks. Get started by signing up for a free account today.
Pay As You Go Pricing
We make it easy and affordable to start monitoring your Laravel app's performance.
Free
Everything included$0
300K events / month
* Event is a span in your application like database query, request, cache hit, queued job, mail sent, etc.
Start for Free- ✓Unlimited Applications
- ✓Unlimited Environments
- ✓Unlimited Servers
- ✓Unlimited Users / Seats
- ✓Unlimited Alerts
- ✓Unlimited Dashboards
- ✓Unlimited Reports
- ✓30 Days Data Retention
Exceeding 300K events requires upgrading to Pro.
Pro
Best valueFrom $10
20M events / month included
$0.15 per additional 100K events
Start for Free- ✓Unlimited Applications
- ✓Unlimited Environments
- ✓Unlimited Servers
- ✓Unlimited Users / Seats
- ✓Unlimited Alerts
- ✓Unlimited Dashboards
- ✓Unlimited Reports
- ✓30 Days Data Retention
Overage charges: $0.15 per 100K events beyond 20M.
Enter your usage details below to estimate costs:
Requests / Month
Commands / Month
Scheduled Tasks Runs
Jobs / Month
Estimated Monthly Costs:
Your Data is Protected
We take data security very seriously. We implemented the following data protection measures to protect your data.
Flexible Filtering
We allow flexible filtering options to avoid sending of sensitive information to Laritor.
Redacted Data
Your sensitive and PII information is redacted / anonymized before leaving your servers.
Regional Storage
You can choose the geographical region where you want your data to be stored.
Security Audits
We perform regular security audits to stay on top of latest security vulnerabilities.
Encryption in Transit
Your data is encrypted and transmitted to our servers securely using a valid SSL certificate.
Secure Infrastructure
Our servers are on digital ocean and we enforce MFA and IP restrictions to enhance security.
Still Have Questions?
Check our frequently asked questions or send an email to [email protected] and we will answer your questions with in 24 hours.